What Is a Gantt Chart?
A Gantt chart is a horizontal bar chart that shows a project schedule on a timeline. Each bar represents a task, indicating its start date, duration, and completion date. Modern Gantt charts can also display task owners, dependencies, milestones, and progress.
Summary Overview:
|
When looking at a Gantt chart, you can see the order of work, where tasks overlap, and which activities are on the critical path. Many Gantt tools, including Smartsheet, also offer features such as baseline comparisons, a current date line, and color-coded status indicators to make tracking easier.
American mechanical engineer Henry Gantt popularized the chart format in the early 20th century, adapting ideas first introduced by Karol Adamiecki, a Polish engineer. The interactive, automatically generated charts of today are used in fields from construction to software development. For inspiration, browse these examples of Gantt charts used across different industries.

What Is the Purpose of the Gantt Chart?
Even as Gantt charts have evolved across industries, their core purpose remains the same: to show what work needs to be done, when it should happen, and how tasks are connected. In short, a Gantt chart turns a task list into a time-based plan.
With a Gantt chart, you can review the sequencing of activities, see where they overlap, and identify task dependencies. By tracking start and finish dates alongside milestones, a Gantt chart also helps you detect schedule risks, balance workloads, and keep everything in sync when issues occur. For project managers, it’s a shared visual that makes status and priorities clear to everyone involved.
Learn more about the pros and cons of Gantt charts to decide whether they’re the right tool for your project.
What Are the 7 Important Elements of a Gantt Chart?
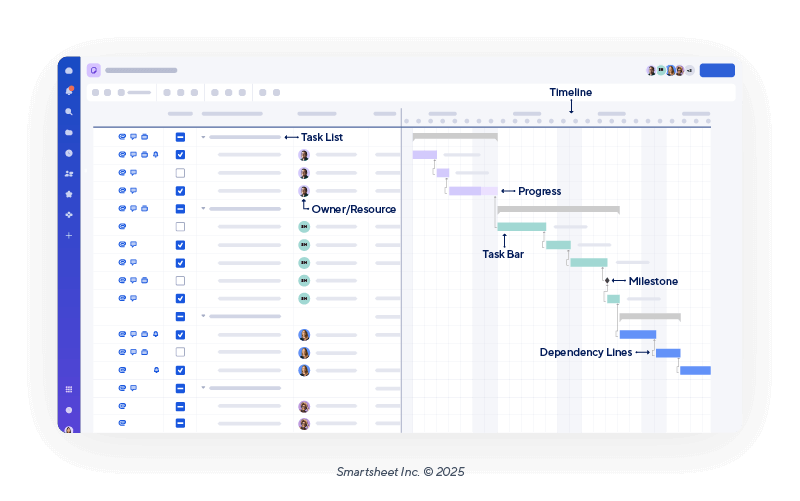
Most Gantt charts include seven main elements: task list, timeline, task bars, dependencies, milestones, owner or resource, and status. Together, they depict what tasks are needed, when they will happen, how they connect, who is responsible, and how work is progressing.
These are the elements of a Gantt chart:
- Task List: This is the foundation of your Gantt chart. It usually appears to the left of the actual chart as a vertical list of activities or deliverables, and is often organized by phase or work package.
- Timeline: Positioned along the top of the chart on the right, this horizontal time scale displays days, weeks, or months, depending on your project’s timeline.
- Task Bars: These horizontal bars are often color-coded and represent a task’s planned start date, duration, and finish date.
- Dependencies: Usually represented by arrows on the chart, dependencies show how tasks relate to one another — or when one task must start or finish before another can begin. Ultimately, dependencies define the work sequence.
- Milestones: These visual markers highlight key dates, deadlines, or phase completions. Milestones act as checkpoints for measuring progress.
- Owner/Resource: This is the person, team, or department assigned to complete the task. Naming owners or resources helps clarify responsibilities.
- Progress: Typically shown as shading inside the task bar, progress shows the percentage of work completed for each task. It gives quick insight into the project status, and it flags delays or tasks that are ahead of schedule.
Elements of a Gantt Chart
Components of a Gantt Chart
There are four structural components of a Gantt chart: the task grid, the chart pane, the scheduling logic, and view aids. After you define the tasks in the grid, the scheduling logic calculates timing and sequence, and the chart pane displays the results along with optional view aids.
Here is how these components work together to create a visual schedule:
- Task Grid: The table on the left side of the Gantt chart lists task information, such as WBS number, name, owner, start date, finish date, duration, and percentage complete. You can show, hide, or customize columns to fit your needs.
- Gantt Chart Pane: This visual timeline on the right side displays task bars, milestones, and dependency lines. You can zoom or resize the pane to adjust the time scale for better visibility.
- Scheduling Logic: This automated system calculates dates and task order based on dependencies, constraints, and working calendars. It manages relationships such as finish-to-start or start-to-start to lay out the project’s critical path.
- View Aids: These visual cues make the schedule easy to read at a glance. Common examples include a current date line, shading for nonworking days, baseline overlays, and critical path highlights.
Understand the fundamental differences between a Gantt chart vs. project timeline and learn which visualization tool is best suited for your project's specific needs.
How to Create a Gantt Chart
You can build a Gantt chart in spreadsheets or in project management software. In Excel and Google Sheets, use a stacked bar chart to simulate the timeline. In Smartsheet, Gantt View includes built-in scheduling features such as dependencies, baselines, and critical path tracking that automatically update task dates.

Explore these Smartsheet resources covering how to make a Gantt chart in different tools and formats:
- How to create a Gantt chart in Smartsheet
- How to make a Gantt chart in Excel
- How to make a Gantt chart in Google Sheets
- Gantt chart templates
- Gantt chart templates with dependencies
- Gantt chart templates for multiple projects
Once you set up your chart, the next step is knowing how to interpret it so you can spot issues early and keep work on track.
How to Read a Gantt Chart
Reading a Gantt chart is easier when you focus on three key elements: task bars, dependency lines, and milestone markers. Task bars show when each task starts and ends, dependency lines indicate how tasks are connected, and milestone markers highlight major deadlines.
If you’re new to Gantt charts, here is an overview of how to interpret them:
- Review the Task Bars
Task bars show each activity’s start date, duration, and finish date. Their position indicates timing, and their length reflects how long the work should take. Shading inside each bar might show how much work is complete. Compare this progress shading against the schedule to spot delays.
- Trace the Dependency Lines
Dependency lines, often displayed as arrows, connect tasks to show how they relate to one another. For example, a finish-to-start dependency means one task must finish before the next can begin, while a start-to-start dependency means one task must start for another to start. Follow these lines to see task sequences and identify your critical path — the series of tasks that determines your project’s completion date.
- Locate Milestone Markers
Milestones, often depicted as diamonds, represent zero-duration events, such as deadlines, approvals, or phase completions. Check whether tasks preceding your milestones are on track so that you can address risks quickly.
As you familiarize yourself with Gantt charts, you can start using more advanced techniques to get even more value out of them.

George Chasiotis, Co-Founder of Restartt, a go-to-market agency for SaaS companies, uses a top-down approach to reading a Gantt chart: “I zoom out first,” he says. “I want to see the big picture, the start and end dates, milestones, and the sequence of phases. Then I look at the dependencies because that’s where the real risks live. If one important task slips, I look for what other tasks get pushed.”

Consultant Paul Koetke, a Platinum Partner with Smartsheet, begins by looking at risks: “I always start by looking at the critical path first — that red line tells me immediately where the project can succeed or fail,” he explains. “Then I scan for any tasks behind schedule or with dependencies backing up. Within 30 seconds, I can tell you if a project is healthy or if we're heading for trouble.”
How to Use Gantt Charts for Project Management
Gantt charts help project managers combine project tasks, dates, dependencies, milestones, and statuses into one timeline view. Project managers use them to detect bottlenecks, allocate resources, monitor progress, and adjust plans as needed throughout the project lifecycle.
Gantt charts aid project managers in several key duties:
- Building a Clear Plan: List and sequence tasks, set start and finish dates, and connect dependencies. In a construction project, you might link a task — such as pouring the foundation to framing the walls — so that delays in one automatically update the schedule for the other. Explore a variety of free construction Gantt chart templates to help manage your projects, track progress, and coordinate tasks effectively.
“Gantt charts force you to think sequentially and identify dependencies you'd otherwise miss,” says Koetke. “I've seen too many projects fail because someone assumed two tasks could happen simultaneously when one actually depends on the other. The planning stage is where you catch these issues instead of in real life when they're expensive to fix.” - Assigning Work: Assign work to people or teams, while leveling workloads and making certain everyone has the materials and tools needed to do their work.
- Tracking Actual Progress: Update the chart as work is completed to keep schedules useful and realistic.
- Watching Dependencies: Monitor linked tasks for snags that could extend the project’s completion date.
- Communicating Status: Your chart provides a shared view of progress, upcoming work, and lurking risks. It also reinforces accountability, shows cause and effect when dates shift, and fosters cross-team communication.

“The Gantt chart is a great visual representation for stakeholders to highlight when value will be unlocked and the clear critical path to unlocking that value,” says Marisa Browne, a PMP-certified project manager at Traffix, a North American transportation and logistics company. “I generally include a Gantt chart in my project kickoff deck to highlight the ideal path and timeline for each phase of a project, even if the timeline is not completely solidified.”
Beyond day-to-day execution, Gantt charts also help you create doable timelines in the planning phase so you can prevent problems before they start.
Why Use Gantt Charts for Project Planning?
A Gantt chart makes project planning easier by turning tasks into a visual timeline. This timeline shows sequences, overlaps, and milestones, helping teams estimate durations, deploy resources, and identify potential risks early. Gantt charts also improve visibility and team coordination.
Here are the major benefits of using Gantt charts for project planning:
- Better Visibility: The timeline shows the entire project in one view, including task bars, dependency lines, and progress gauges.

Gianluca Ferruggia, General Manager at DesignRush, has seen firsthand how a well-built Gantt chart can bring clarity to complex, cross-team projects. “A Gantt chart creates shared context between stakeholders and forces teams to think temporally — who must finish before the next step starts and what can run in parallel,” he says. “That clarity in the planning stage reduces risk, limits scope creep, and makes later adjustments far easier.” - Improved Coordination: Assigning owners and linking dependencies helps keep responsibilities clear so that teams can stay in sync.
- Risk Awareness: Marking dependencies early can uncover where delays in one task might cause setbacks in another and delay the entire schedule.

Gene Genin, CEO and Founding Partner of OEM Source, a sustainable IT asset disposition company, says the planning stage is when a Gantt chart’s flexibility matters most. “Gantt charts visualize dependencies so nothing falls between the cracks,” he says. “They also make it easy to move timelines around when needed, which is what we count on in rush projects. That is critical to keeping everything on track.”
How Does a Gantt Chart Help With Project Scheduling?
A Gantt chart makes scheduling more effective by showing the sequence, timing, and overlap of tasks in one visual view. It highlights dependencies so that you can see which activities need to finish before others begin, which can run in tandem, and where delays will affect the end date.
Using a Gantt chart can help you schedule projects in these ways:
- Link Tasks That Have Dependencies: Connecting related tasks helps you build a realistic project timeline and catch scheduling conflicts early. Ferruggia gives the following example of a time when his team mapped out dependencies during a cross-functional launch: “By visualizing the sequence of tasks and their dependencies, we were able to identify that the QA team was scheduled to start after the marketing materials were due — a common misalignment,” he says. “Updating the dates gave us the ability to overlap parts of the design and QA work without sacrificing quality, and it reduced a two-week project cycle.”
- Identify the Critical Path: Determine which chain of tasks controls the project’s completion date so you know where delays will have the greatest impact.
For more information on how to do this, read our guide to understanding and using the critical path in Gantt charts. - Adjust for Slack and Float: Use gaps between dependent tasks to reallocate resources or absorb delays without affecting the overall deadline.

Adrien Kallel, CEO and Co-Founder of Remote People, uses slack and float proactively. “Maintain a current baseline, update percentage complete and actuals on a fixed cadence, and review both free and total float at each status meeting to avoid consuming slack unknowingly.” - Sequence Work for Efficiency: Cluster associated tasks or schedule them back-to-back to keep up momentum.

Christopher Deanovic, Operations Leader at Task Masters, shares the following example of how sequencing eliminated idle time in a landscaping project. “The visual timeline revealed that our retaining wall crew would block sprinkler line trenching for three days longer than estimated,” he says. “We adjusted the sequence before breaking ground and finished the entire project without a single crew standing idle.” - Keep the Schedule Current: Update task dates and durations regularly to reflect actual progress.
Tips for Gantt Charts
Gantt charts are most effective when kept current and easy to read, and they stay focused on only key details. Tips and best practices include applying filters for your audience, setting realistic task durations, updating statuses regularly, and using baselines to measure performance.
These real-world tips will help you get the most out of your Gantt charts:
- Keep Task Details Manageable: Separate work into tasks that are large enough to be meaningful but small enough to track. Overly broad tasks hide progress; overly granular tasks complicate the chart. Consider converting a work breakdown structure to a Gantt chart.
- Don’t Clutter Your Chart: Display only the details you need to track meaningful progress. Choose concise labels, avoid too much color-coding, and zoom to a timescale that makes sense for your project and audience.
“The biggest mistake when using a Gantt chart is adding too much detail,” Browne says. “Less is more with a Gantt chart. If you cannot easily identify the critical path, highlight the current project status, and understand the overall timeline, the Gantt chart loses its value.” - Filter for Your Audience: Use filters in your chart views to control what information is shown. For example, show executives only big-picture timelines and milestones, while displaying more detailed tasks for team members managing the work.
- Set Realistic Durations: Base timelines on historical data or input from those doing the work.
- Update Status: Refresh the chart as work is completed — at least weekly. Outdated charts cause confusion.
- Limit Dependencies: Link only those tasks that fundamentally rely on each other. Excessive linking creates fragile schedules that are hard to adjust.
- Highlight Milestones: Use milestones to mark approvals, deliverables, and critical deadlines. They keep attention on key goals and signal phase changes.
- Use Baselines: Set a baseline once planning is complete, and compare actual advancement against it to measure performance.

Arthur Favier, Founder and CEO of Oppizi, relies on locked baselines to measure shifts. “Lock a baseline at kickoff, and lock another after major scope changes. That way you always have a fixed reference point for progress and can see exactly when and where slippage has occurred.” - Add a Current Date Line: Display a current date line so that it’s easy to see what’s in progress, overdue, or upcoming.
- Watch the Critical Path: Monitor the tasks that determine the project’s end date, and react quickly if they slip.
- Integrate Your Other Tools: Connect your chart to task trackers, calendars, or other resource planning tools to reduce duplicate data entry.
- Save a Clean Backup Before Major Changes: Always keep a restorable version of your chart before making big edits. Many cloud-based tools track version history automatically, but a clearly labeled manual backup ensures you can roll back quickly if something breaks or a stakeholder wants to see the previous plan.

Fineas Tatar, Co-CEO of Viva, always keeps an untouched copy of his Gantt charts. “Before making any significant structural changes to a Gantt chart — such as adjusting dependencies, shifting milestones, or reassigning owners — I save a backup of the original file,” he explains. “This habit has saved project leads from the stress of undoing changes when a stakeholder asks to revert to a previous version.”
Types of Gantt Charts (With Gantt Chart Templates)
There are different types of Gantt charts for different scenarios, such as basic projects, projects with many dependencies, multiple concurrent projects, and Agile projects. Select the Gantt template that best suits your needs. Each comes with built-in calculations and other tools to auto-generate your chart.
Here are some key Gantt formats:
- Basic Project Gantt Plan: Use a basic Gantt chart project template to plan deliverables, track costs, and manage project phases all in one view.
- Gantt Chart With Dependencies: This dependencies-enabled Gantt template set includes options with a work breakdown structure (WBS) that automatically update timelines when tasks shift.
- Multiple-Project Gantt Chart: Oversee several timelines at once with these multiproject Gantt templates that use color-coding to compare and track progress across initiatives.
- Agile Gantt Chart (Sprint-Focused): Track sprints with an Agile Gantt chart template that shows tasks, story points, owners, and status on a visual timeline.
Learn about the key differences between various project management methodologies, from Gantt charts vs. Kanban boards to Gantt charts vs. roadmaps. Additionally, learn about the distinction between PERT and Gantt charts to help you choose the best tool for your next project.
How to Choose Gantt Chart Software
To choose which Gantt chart software is right for you, compare at least three vendors. Study their key features in core scheduling, automation, collaboration, integration, and adjustability. Your team’s right choice should make it easy to plan and execute on your terms.
Assess these key areas when choosing Gantt chart software:
- Core Scheduling Capabilities: Look for features such as automatic date adjustments, baselines, and critical path highlighting to keep timelines accurate. Also keep in mind what types of dependencies you need to track. Many simpler, free tools support only one type: start-to-finish. If your projects include finish-to-start, start-to-start, or finish-to-finish dependencies, look for software that supports more complex scheduling.
- Collaboration: A Gantt chart is most effective when everyone can see and update it. Prioritize tools with real-time updates, in-line commenting, and needed integrations. “The best Gantt chart in the world is useless if only one person can update it,” says Koetke. “In Smartsheet, when a project manager updates a task status, everyone sees it immediately. The critical path recalculates automatically, dependencies adjust, and stakeholders get notified. That real-time visibility is what turns a static chart into a living project management tool.”
- Flexibility: You’ll likely want to tailor columns, color-coding, and views to match your team’s process. See if the tool offers multiple views — such as grid, Kanban, or calendar — so teams can work in the format they prefer.
- Reporting: Pick software that makes it easy to turn project information into revealing visual reports. Find dashboards, exportable charts, and summary views you can share with stakeholders without extra formatting work.
- Scalability: Confirm that the tool will suit your organization’s growth. It should have portfolio-level views, resource features, and role-based permissions.
- Software Integration: Gantt software should tie in with task managers, collaboration apps, and other tools your team already relies on. This helps you avoid double data entry and ensures everyone is working with the same information.
- Support: Evaluate onboarding, tutorials, and client support. How easily can your team get help when they have questions or issues?
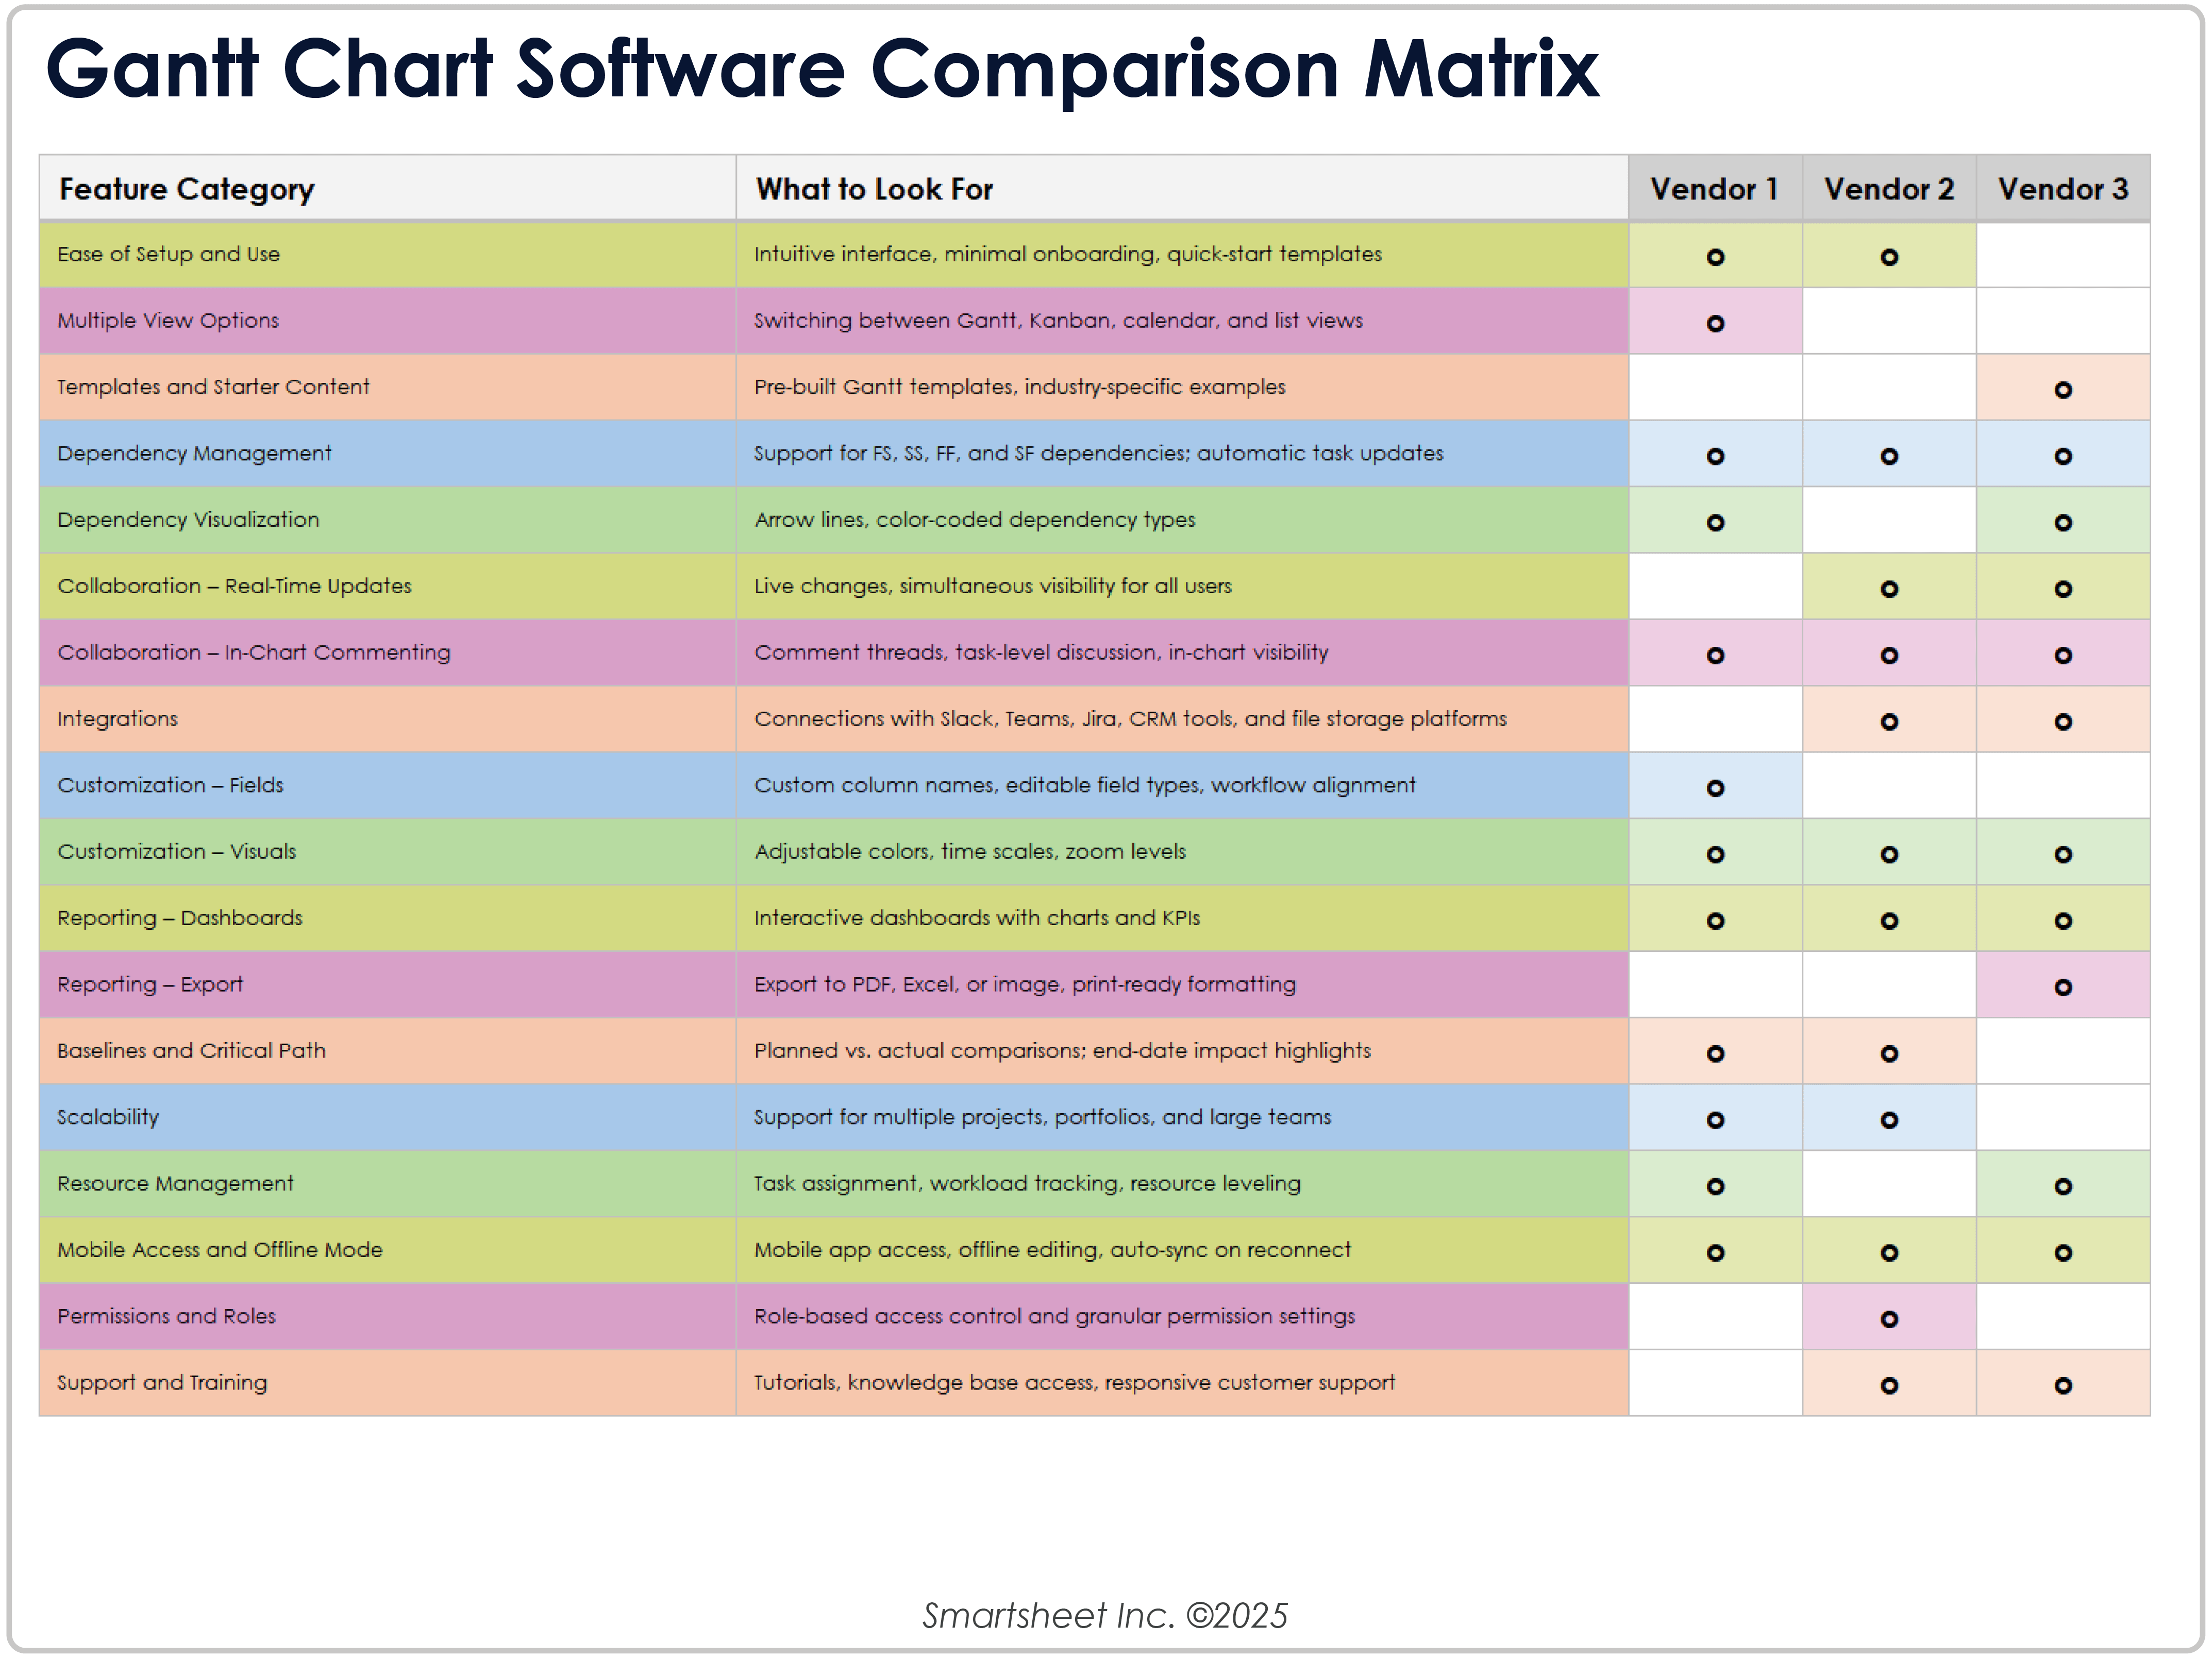
Download a Gantt Chart Software Comparison Matrix for
Excel
| Google Sheets
To make an informed decision, download this easy-to-use comparison matrix. It outlines essential capabilities, explains what to look for in each, and gives you space to score three vendors side-by-side.
To learn more about Smartsheet’s unique features, see this overview of our Gantt chart software.
Streamline Your Planning and Workflow With Smartsheet for Project Management
From simple task management and project planning to complex resource and portfolio management, Smartsheet helps you improve collaboration and increase work velocity -- empowering you to get more done.
The Smartsheet platform makes it easy to plan, capture, manage, and report on work from anywhere, helping your team be more effective and get more done. Report on key metrics and get real-time visibility into work as it happens with roll-up reports, dashboards, and automated workflows built to keep your team connected and informed.
When teams have clarity into the work getting done, there’s no telling how much more they can accomplish in the same amount of time. Try Smartsheet for free, today.
Gantt Chart FAQs
The best Gantt chart software for large teams includes features such as portfolio views, resource management, and role-based permissions. Smartsheet is a strong option, offering scalable plans with real-time collaboration, workload tracking, and support for managing multiple projects across teams.
Smartsheet offers one of the widest ranges of integrations, with more than 175 connections to tools such as Microsoft, Adobe, Google, and Salesforce. It also offers expanded automation through platforms such as Zapier, enabling smooth workflows across your tech stack.
Yes, Smartsheet is generally a stronger option for Gantt charts, especially if you’re managing large projects. It provides a Gantt interface with advanced features such as baselines, critical path highlighting, and dependency management. Monday.com also offers a Gantt view, but it’s layered on top of its board-style workflows and emphasizes ease of use over depth.
Yes, Smartsheet offers paid Gantt chart plans that come with customer support. Higher-tier plans provide added benefits such as priority response times, live chat, and onboarding assistance. Support levels vary by plan, so it’s important to review service coverage and availability.
Smartsheet is a top choice for remote teams. It offers cloud-based Gantt charts with real-time updates, task-level commenting, and built-in collaboration features. Its shared access and live editing capabilities help distributed teams stay aligned.
Smartsheet integrates seamlessly with Slack, enabling automatic task updates, real-time notifications, and some two-way interaction. This way, teams can stay informed without leaving Slack.
To access a Gantt chart in Smartsheet, open your project sheet and switch to Gantt View from the toolbar. Configure Project Settings with designated start and end date columns, then enable features such as dependencies and baselines as needed.