How to Make a Gantt Chart in Excel With a Template
To create a Gantt chart in Excel, download a Gantt chart template from this page, and follow the steps below. This step-by-step guide provides details on how to open the template, enter your project-specific data, and add color-coded duration bars for each task.
Learn about Gantt chart essentials, including what a Gantt chart is, how to use one for project management, and what are the different types.
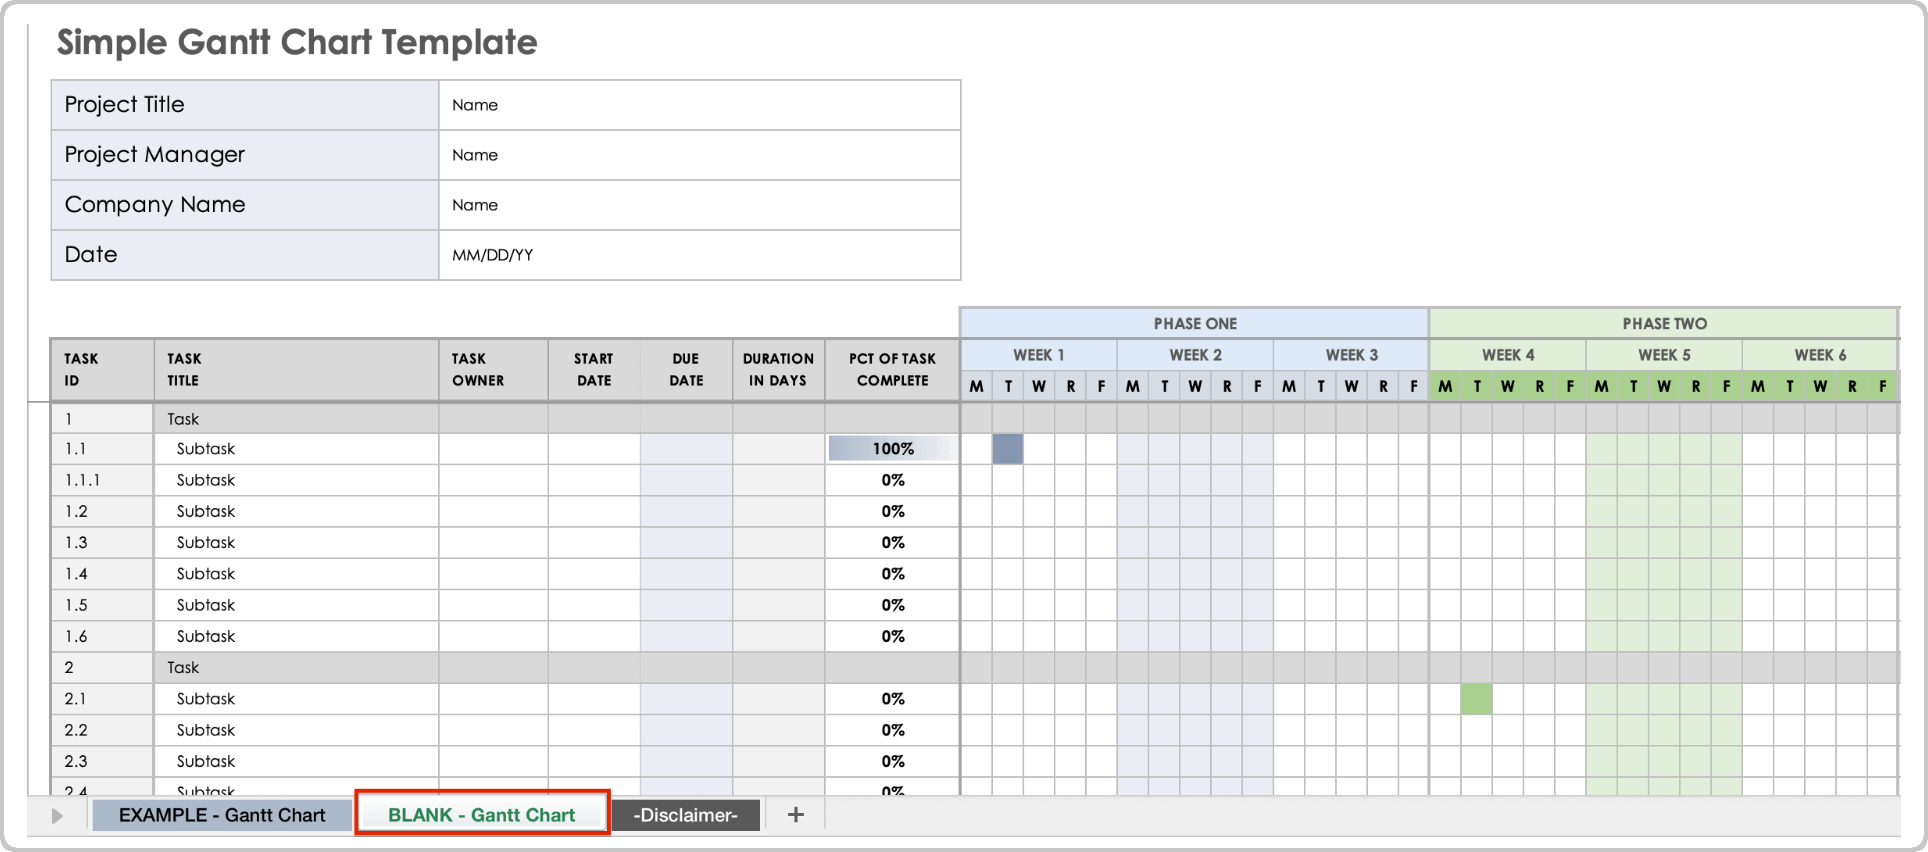
- Download the simple Gantt chart template.
- Open the blank template by clicking the BLANK - Gantt Chart tab at the bottom of the worksheet.
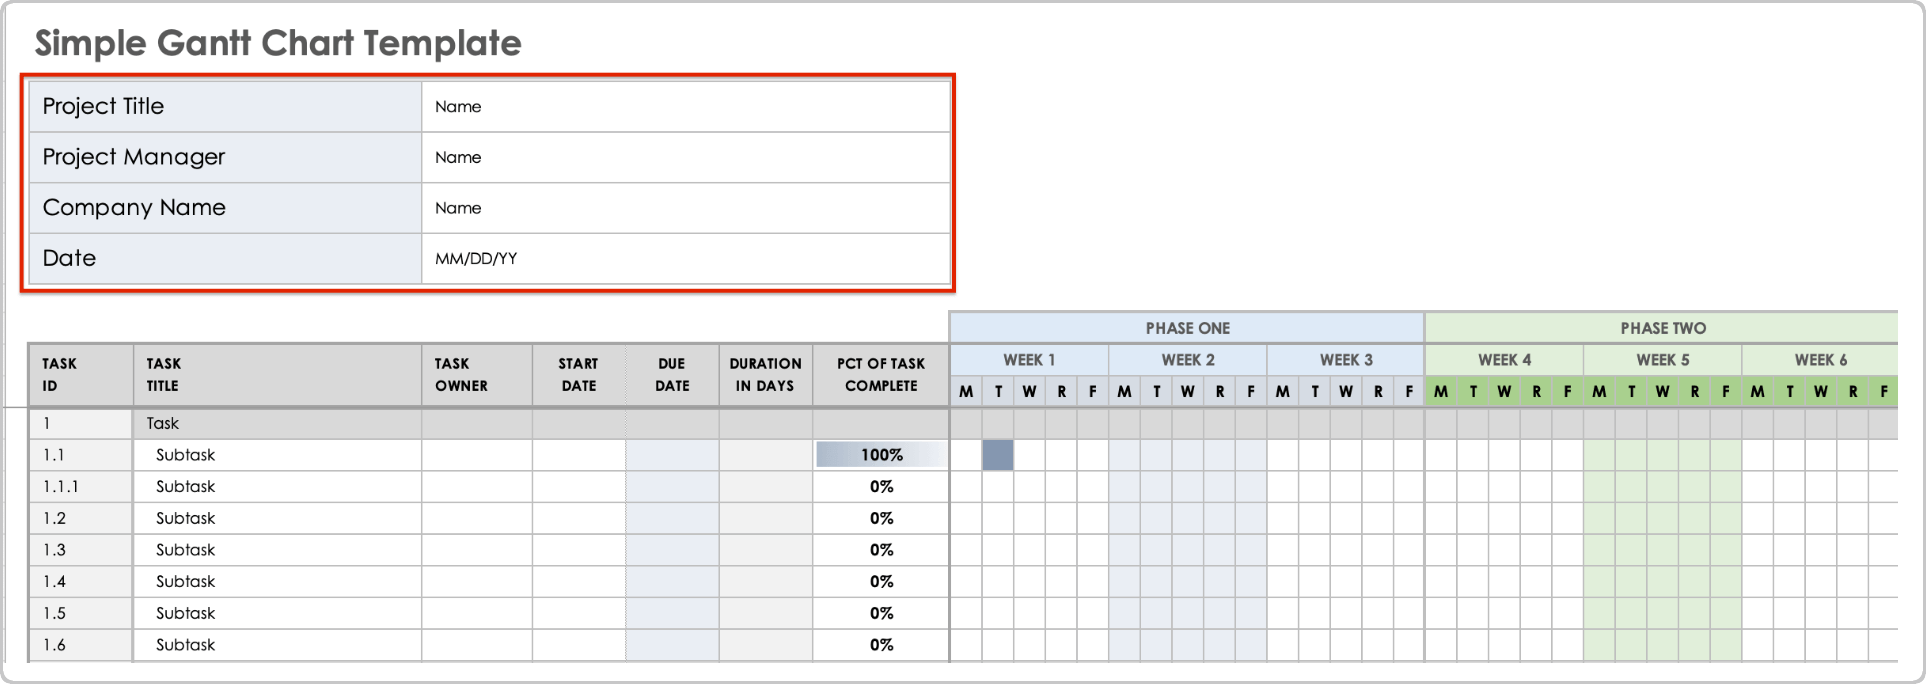
- Enter project details in the Project Title, Project Manager, Company Name, and Date fields.
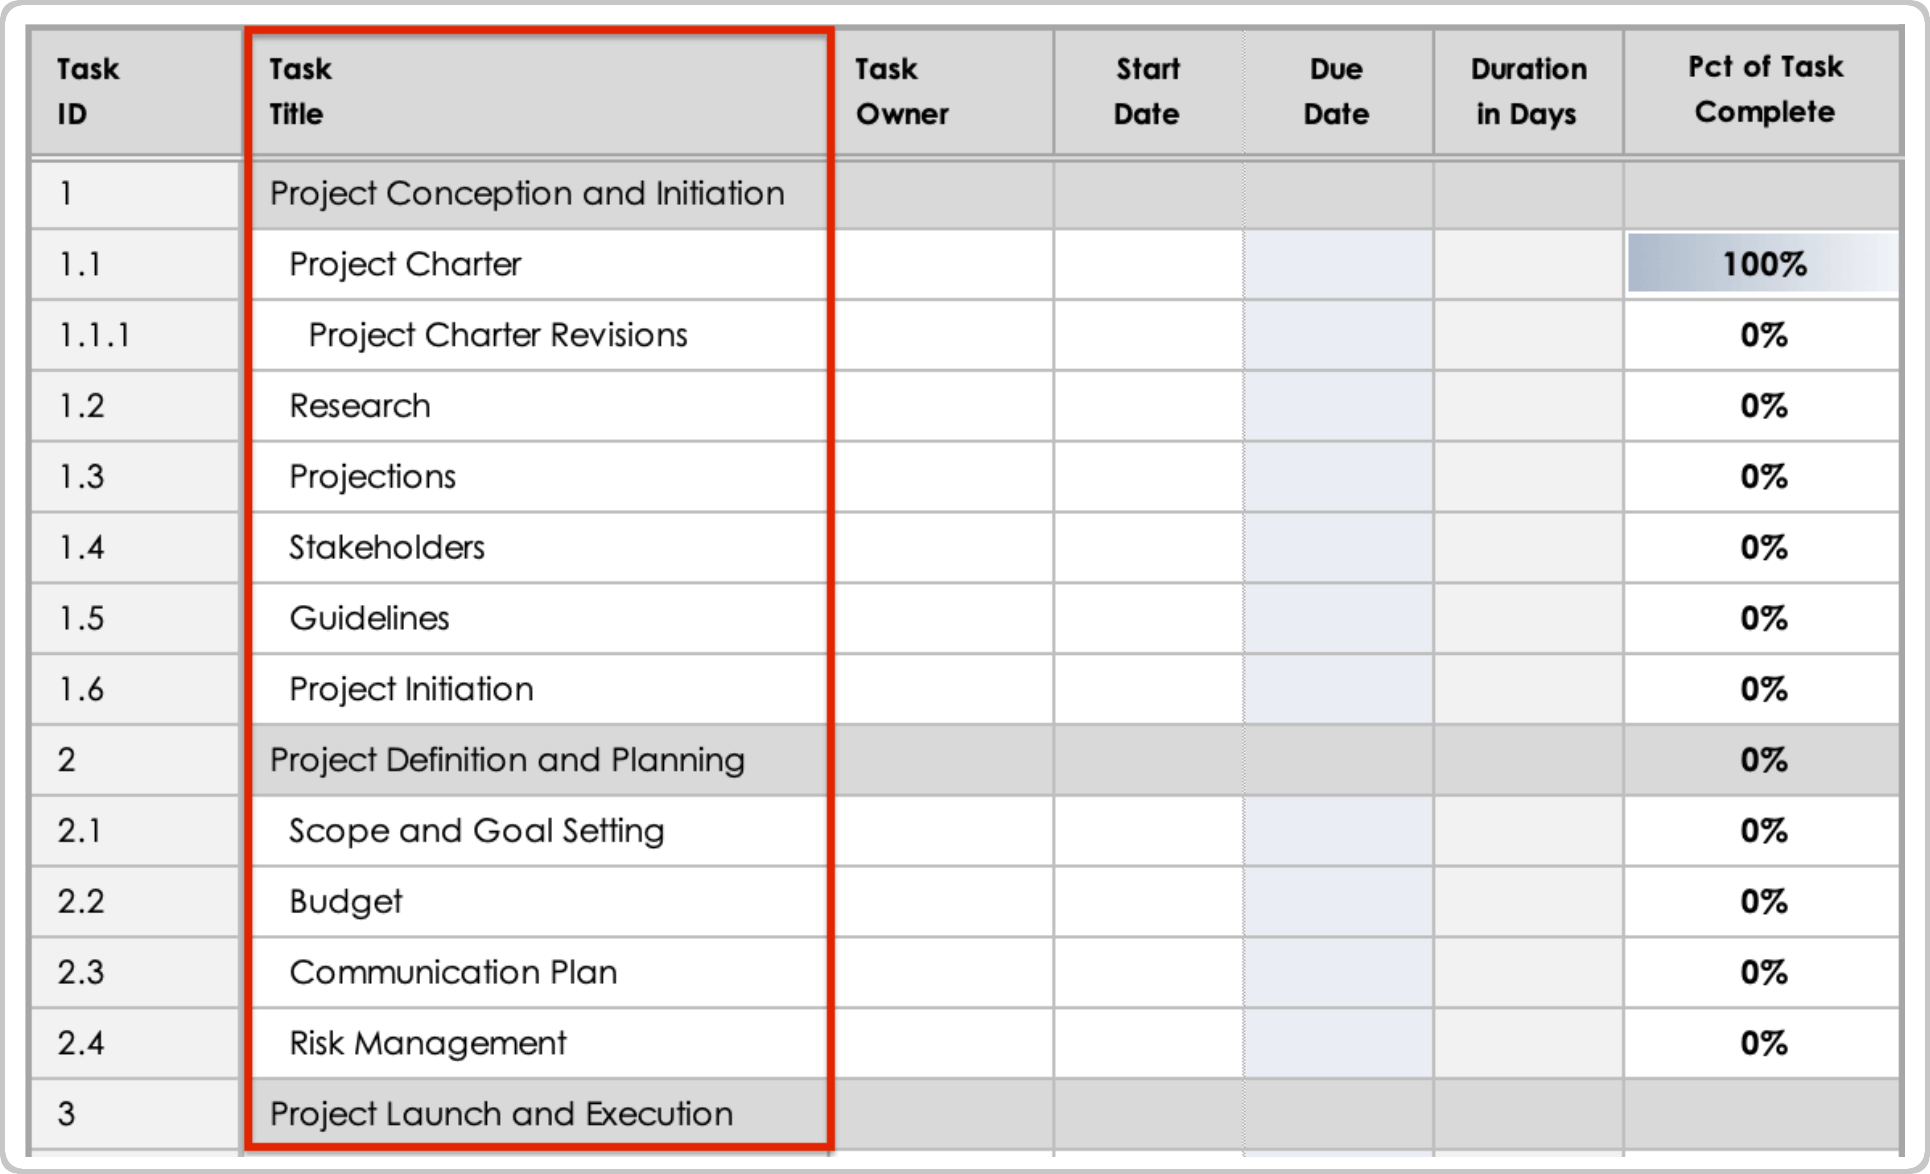
- To create your task list, enter each of the project tasks in the Task Title column. Delete or add rows as needed.
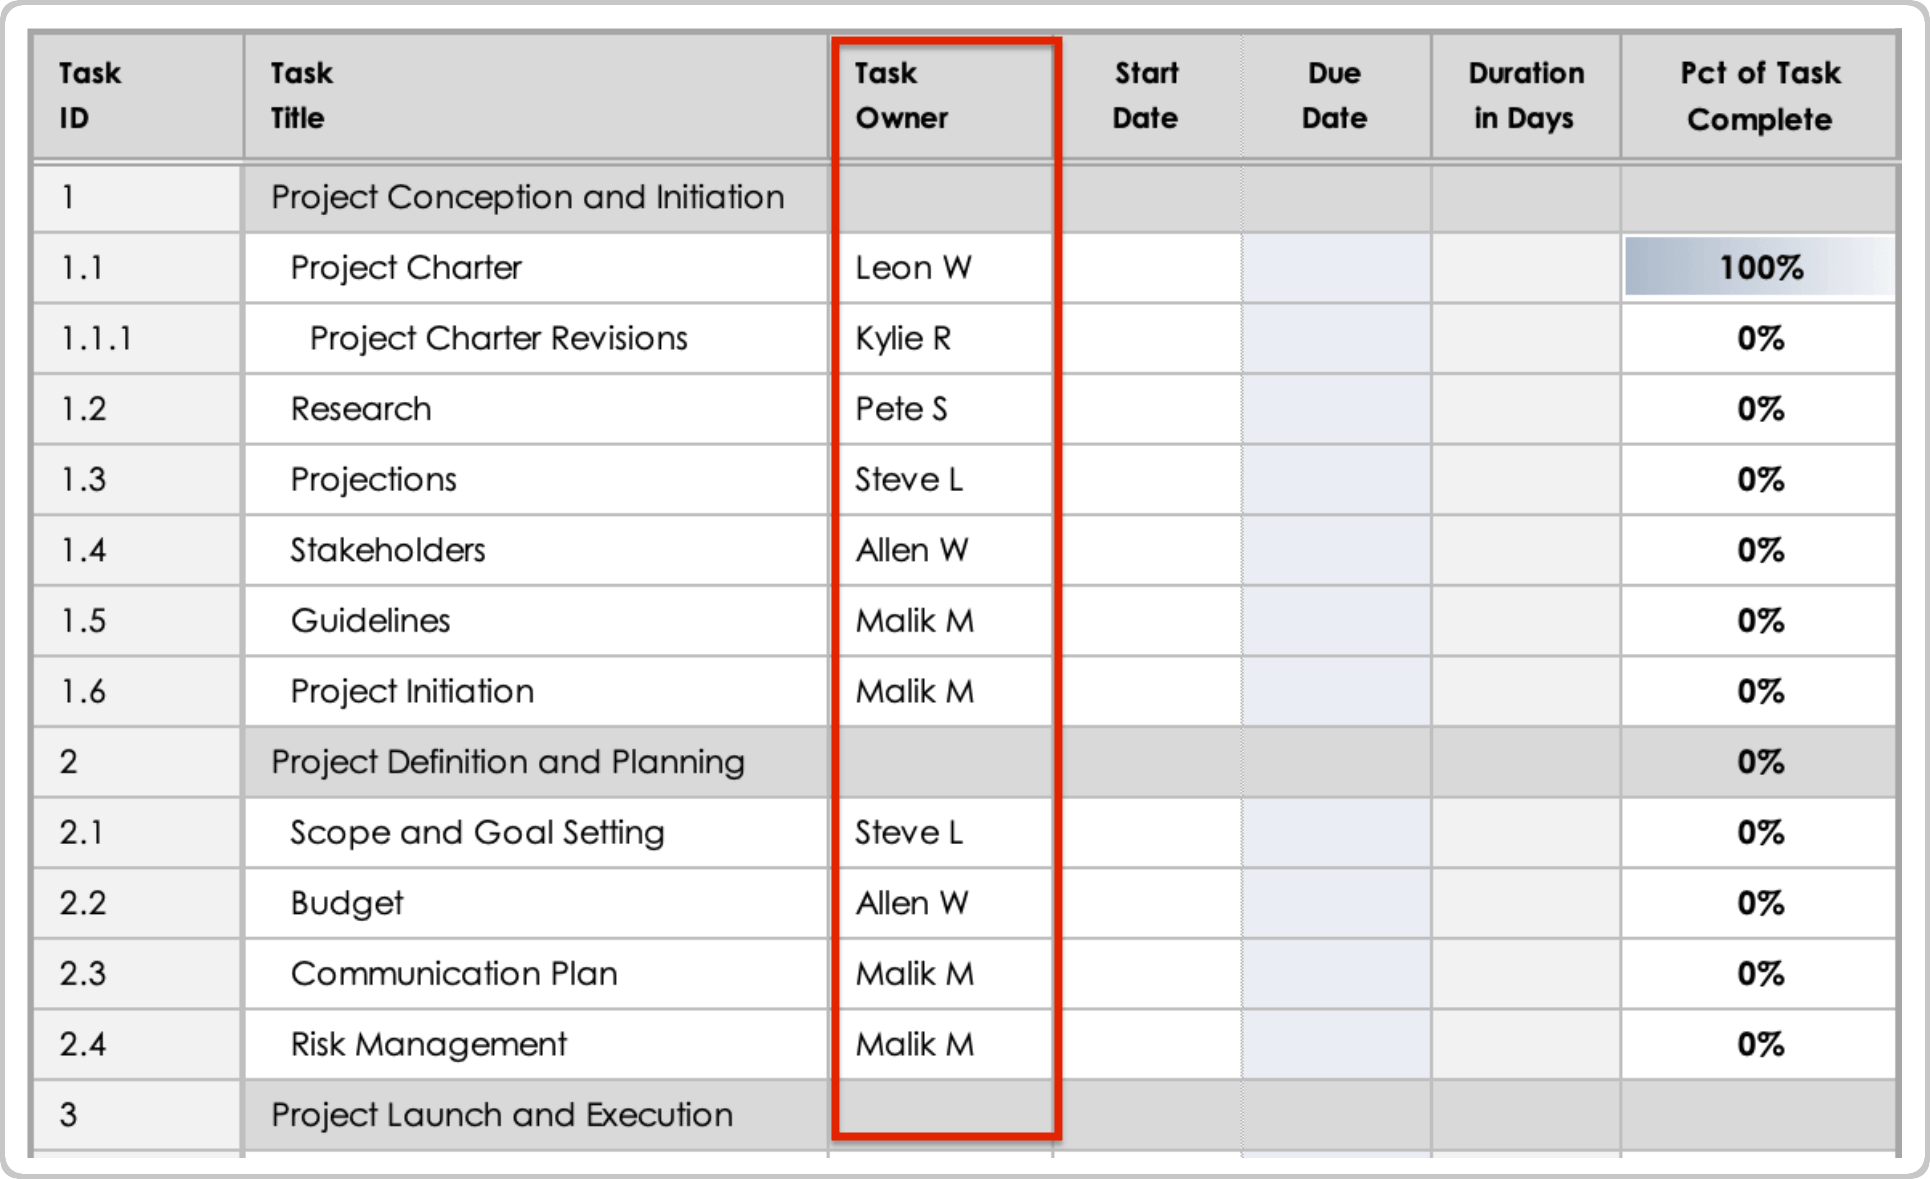
- Assign owners to each task by listing the names in the Task Owner column.
- Enter the start and end date for each task in the Start Date and Due Date columns.
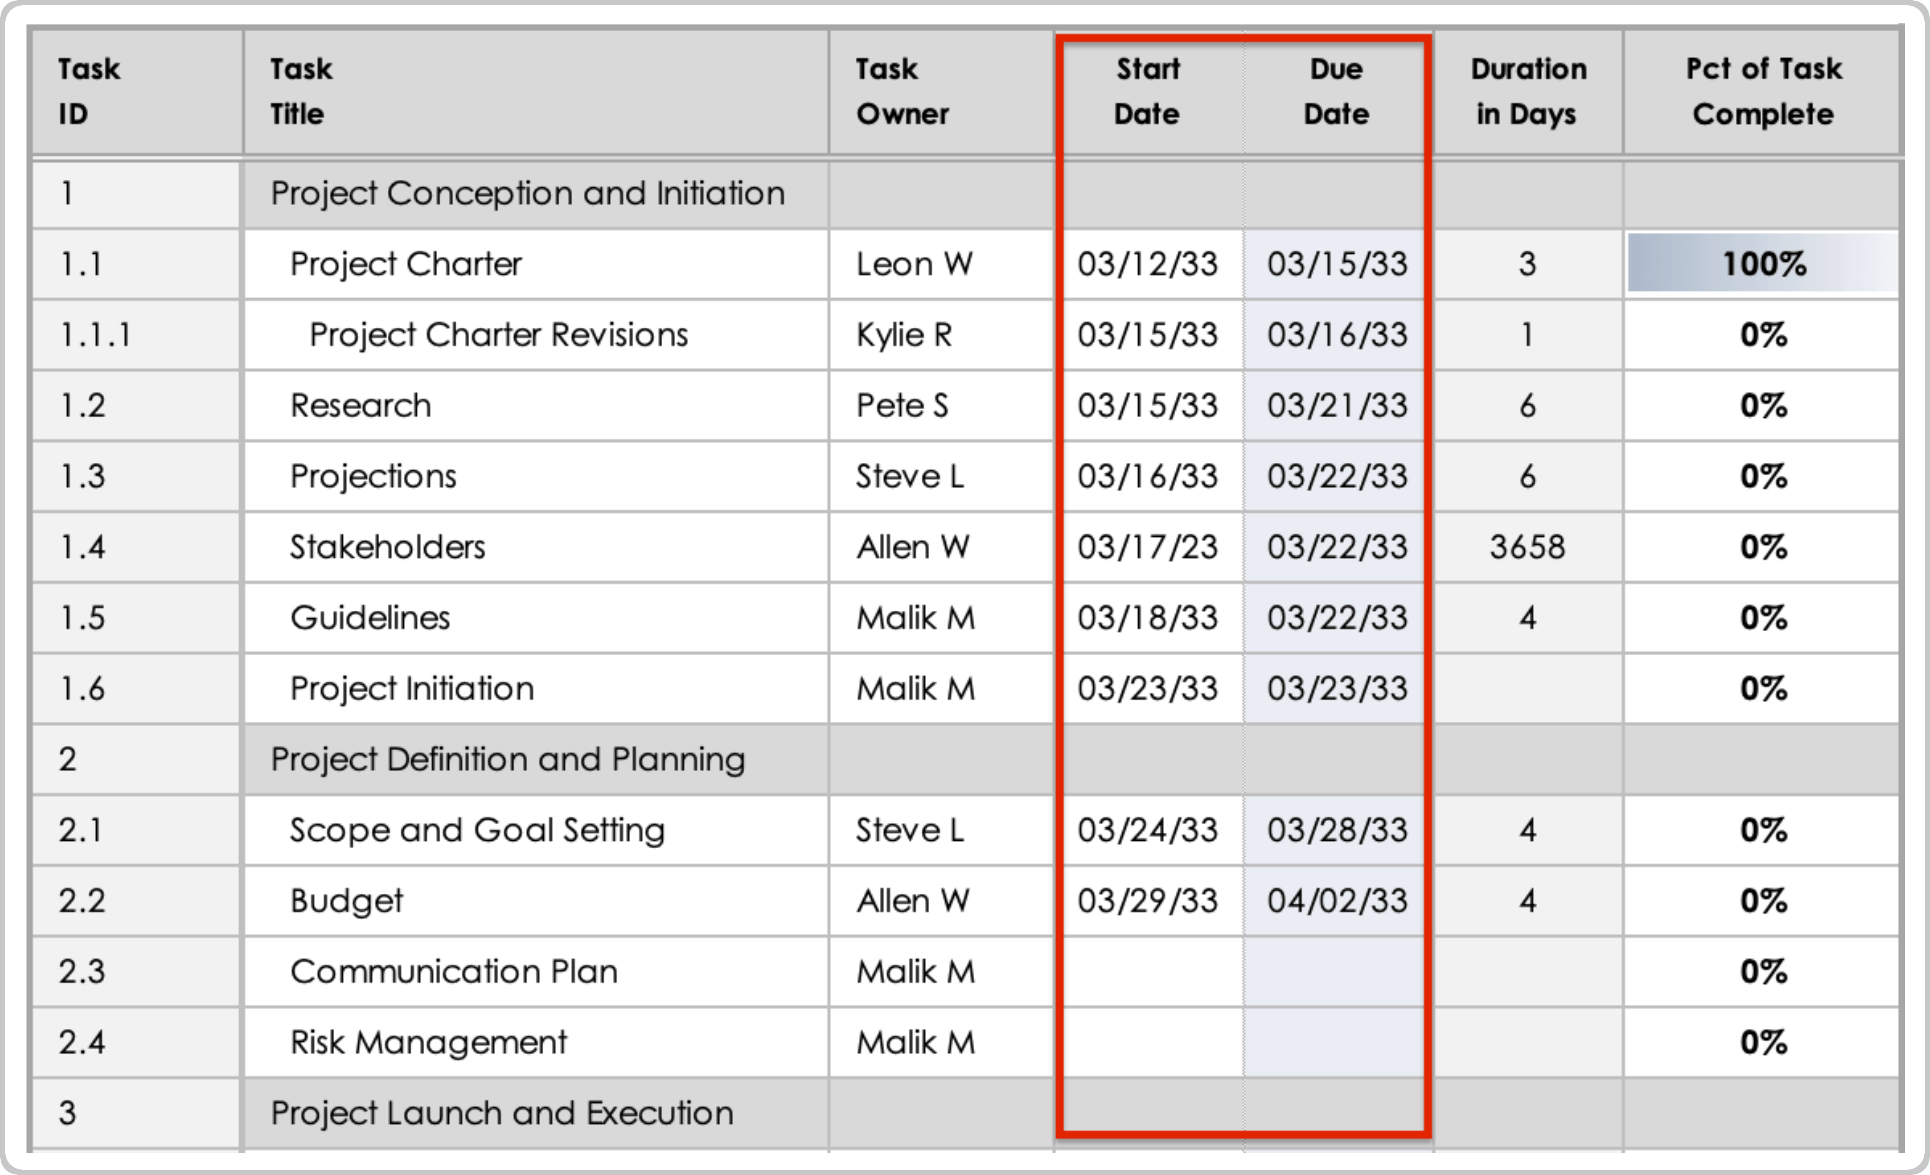
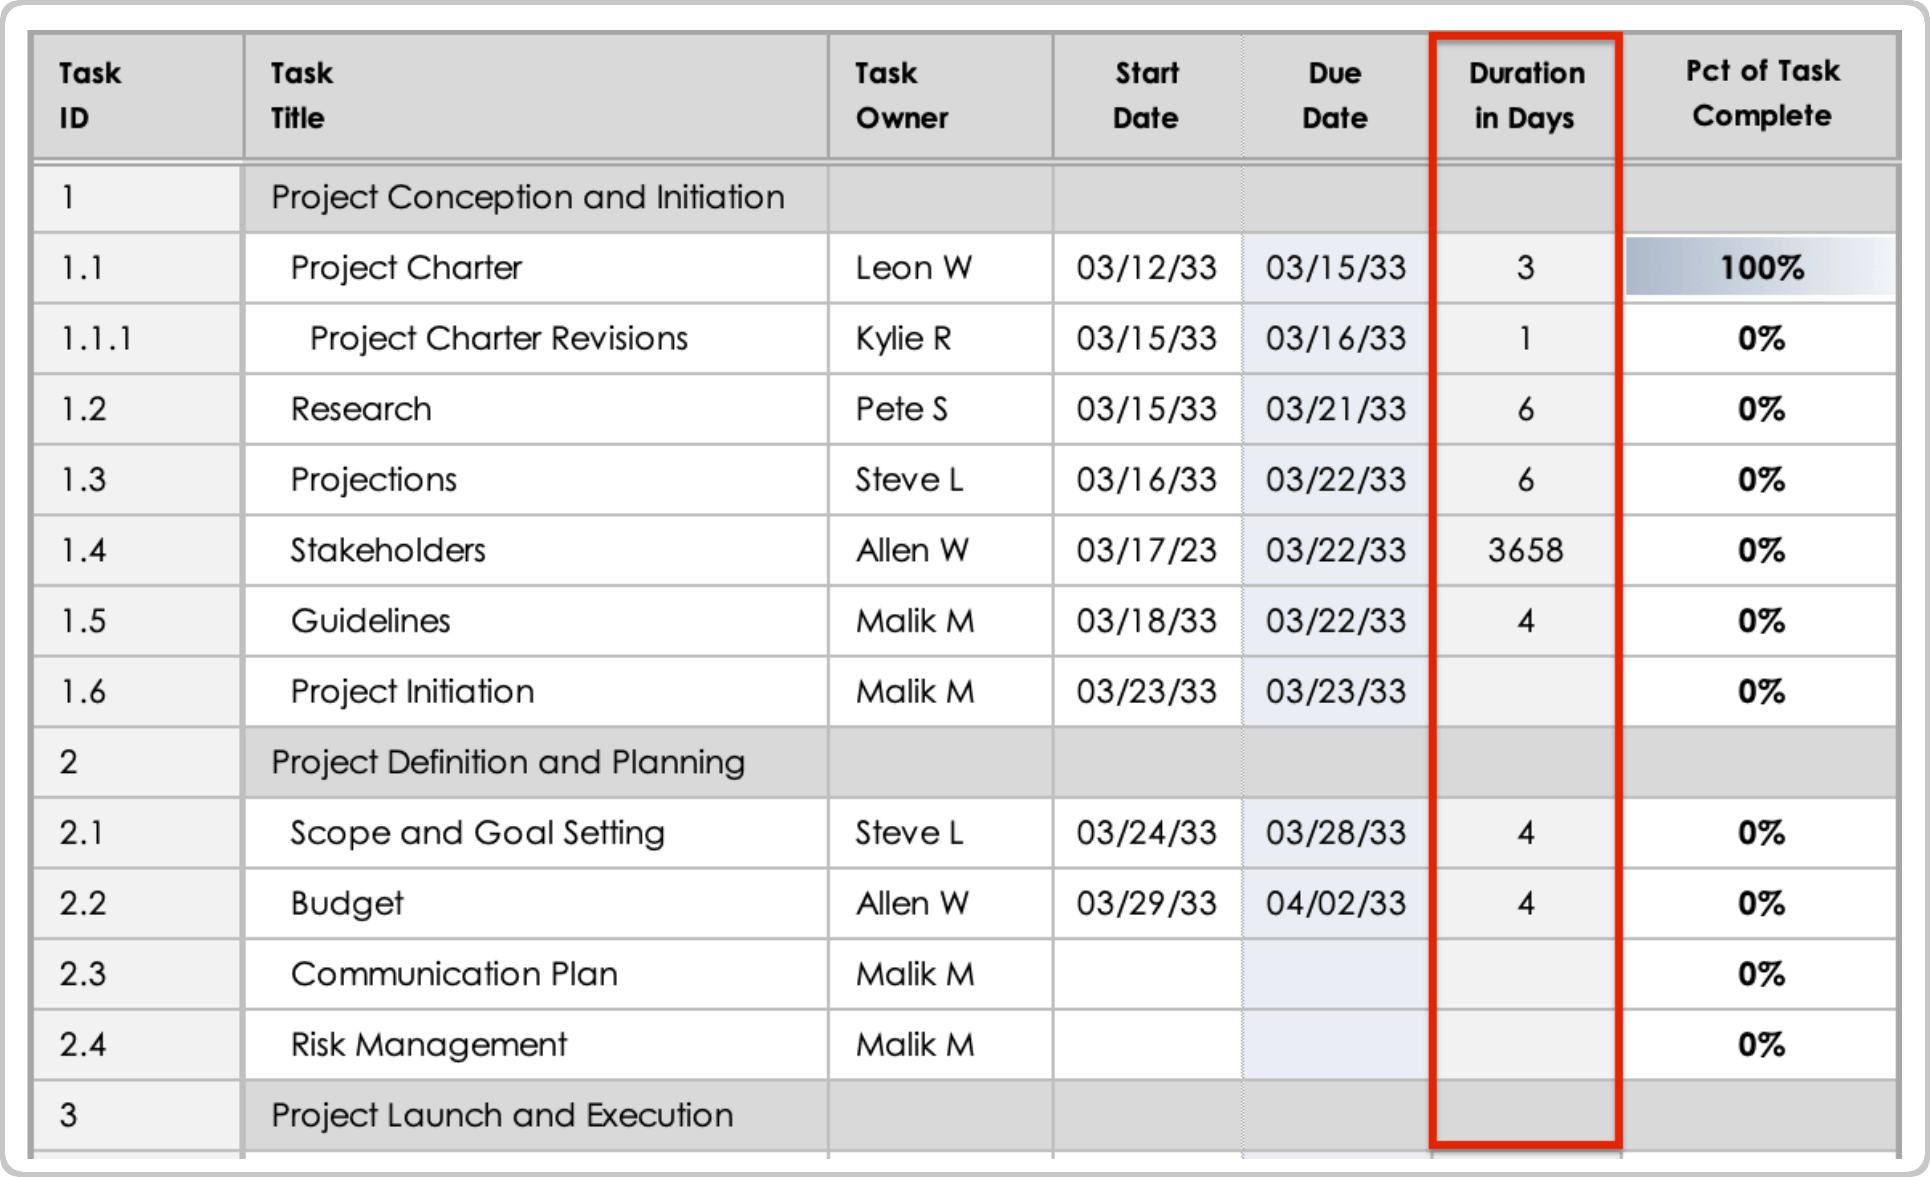
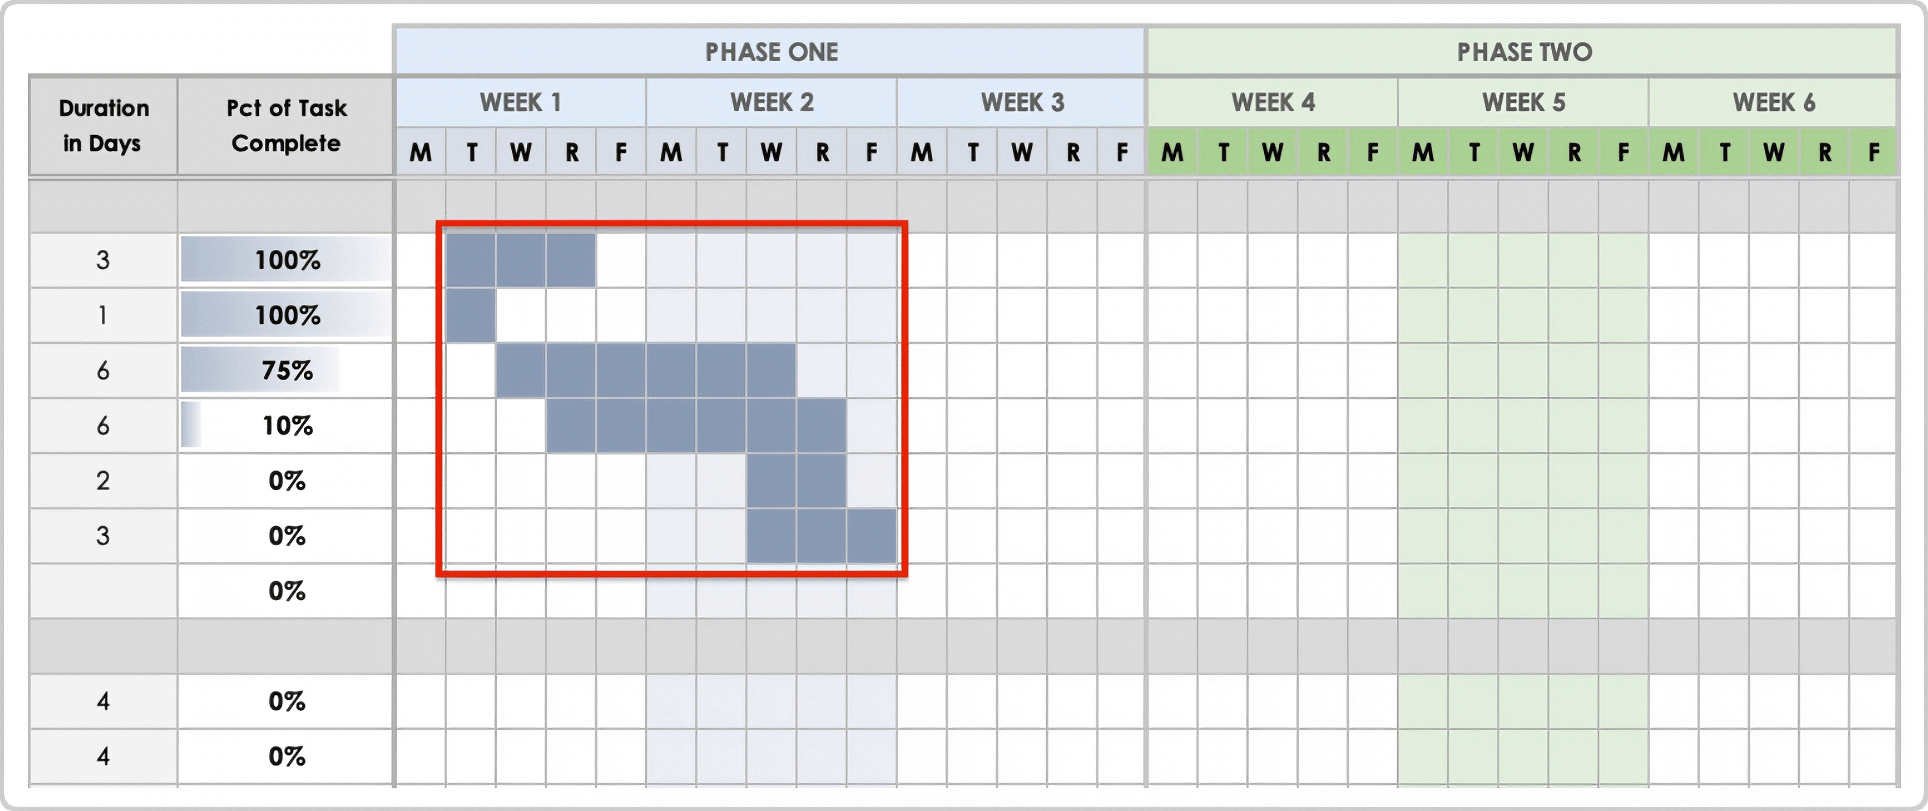
The Duration in Days column will automatically calculate based on the start and end dates you enter.
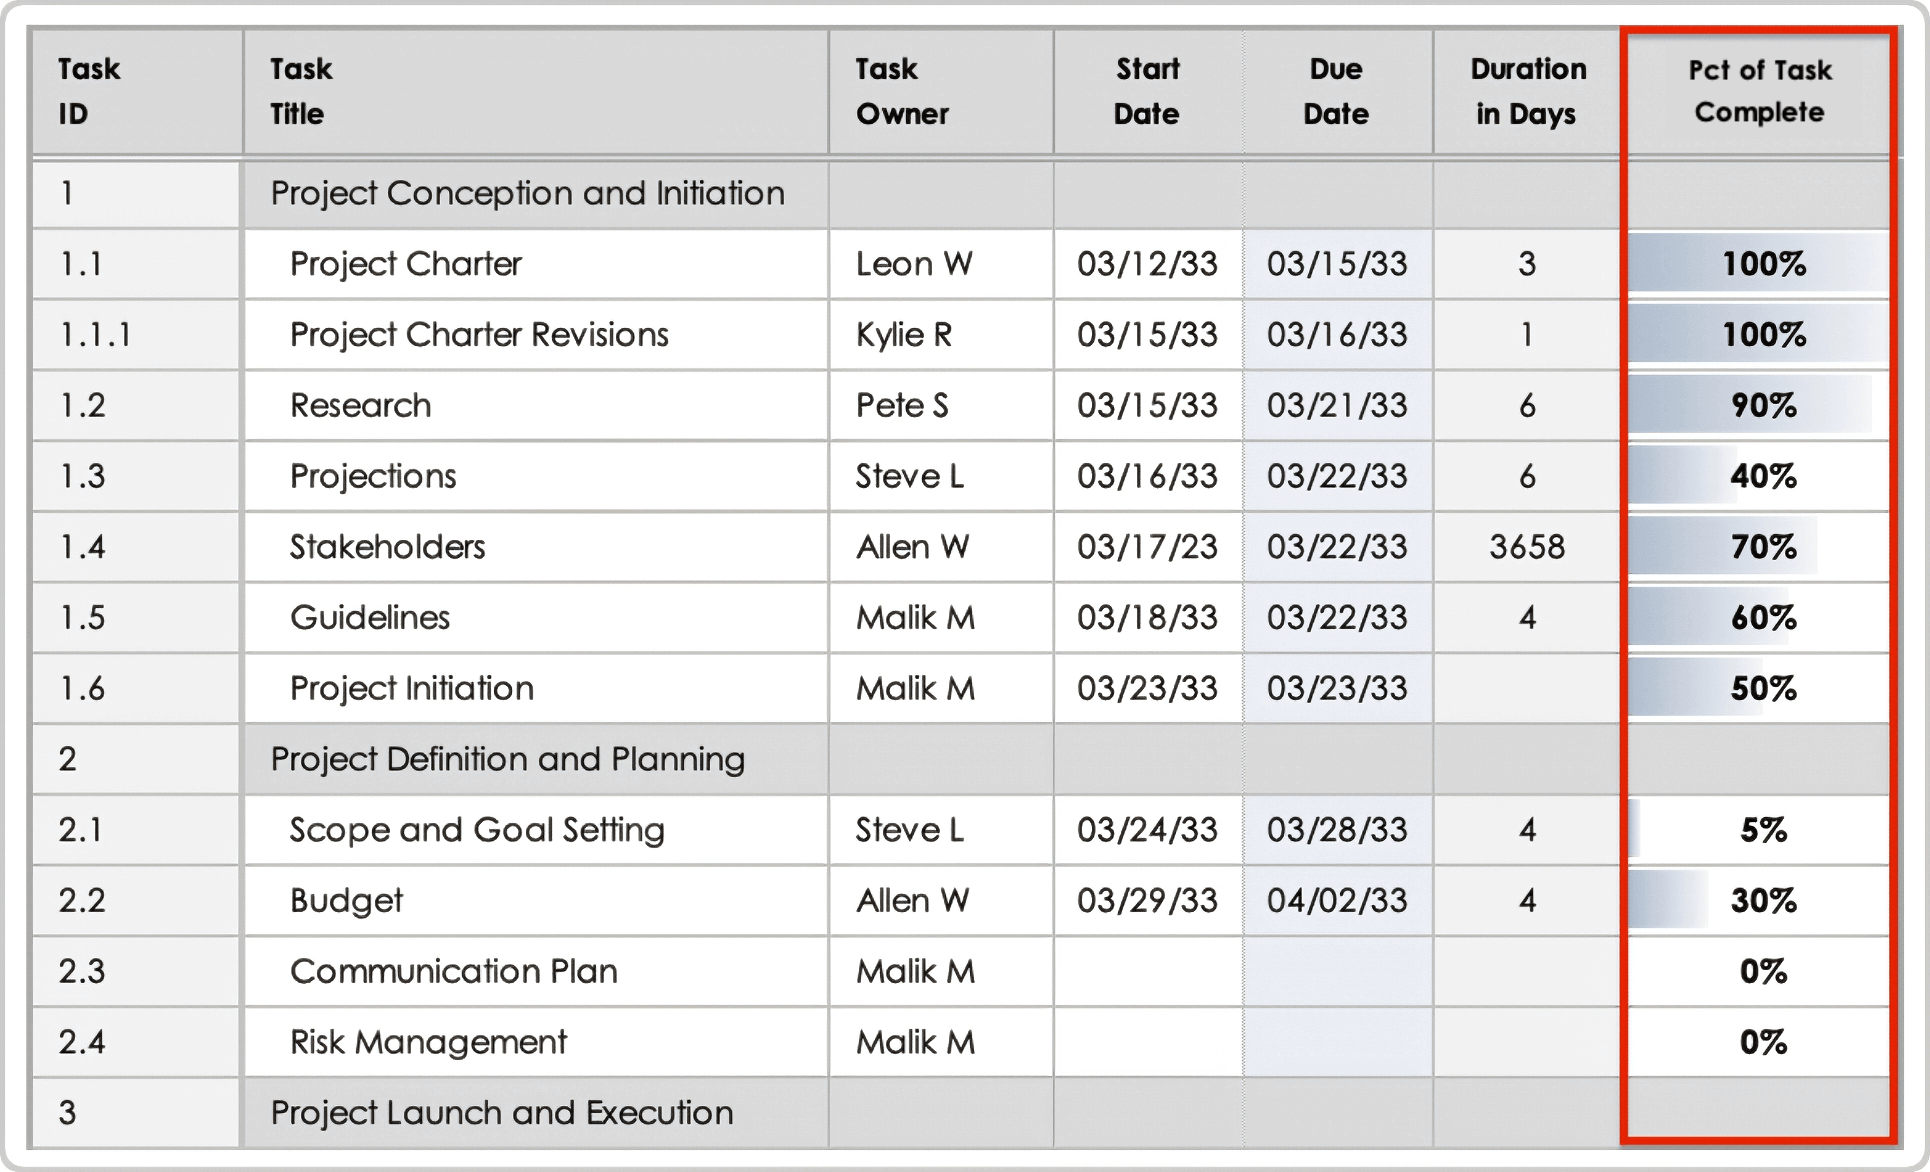
- Enter the completion percentage for each task in the Pct of Task Complete column. The cell’s color gradient will change based on the percentage you enter.
- To create graphical duration bars on the Gantt chart, click the pre-filled cell in the Phase One section of the first task. Drag it across the columns to match the duration in days.
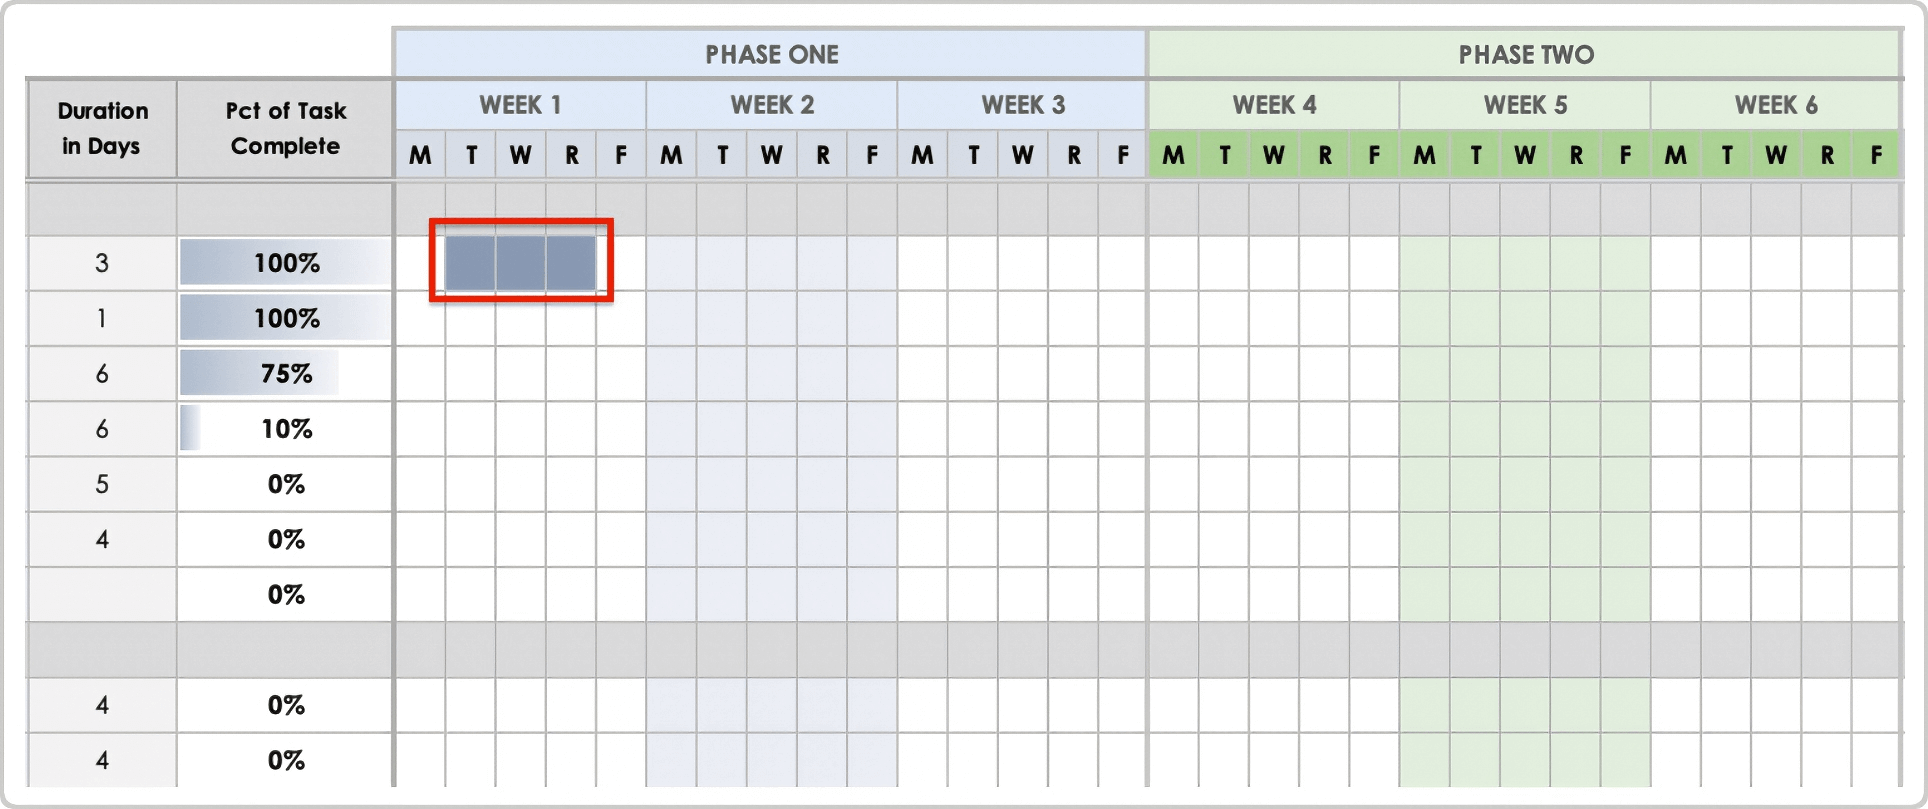
Continue adding duration bars by clicking a prefilled cell. Then right-click, copy the pre-filled cell, and paste it into a cell of the second task. Click and drag it to match the duration in days.
Check out this collection of free Gantt chart templates in Excel, including a 12-month template and one with dependencies.
How to Build a Gantt Chart in Excel
Build a Gantt chart in Excel during the project planning phase to set the schedule and ensure the project stays on track. Follow these steps to create a Gantt chart with custom data, automated calculations, and duration bars to easily visualize your project’s progress.
- To create a new spreadsheet, open Excel and click New > Blank workbook.
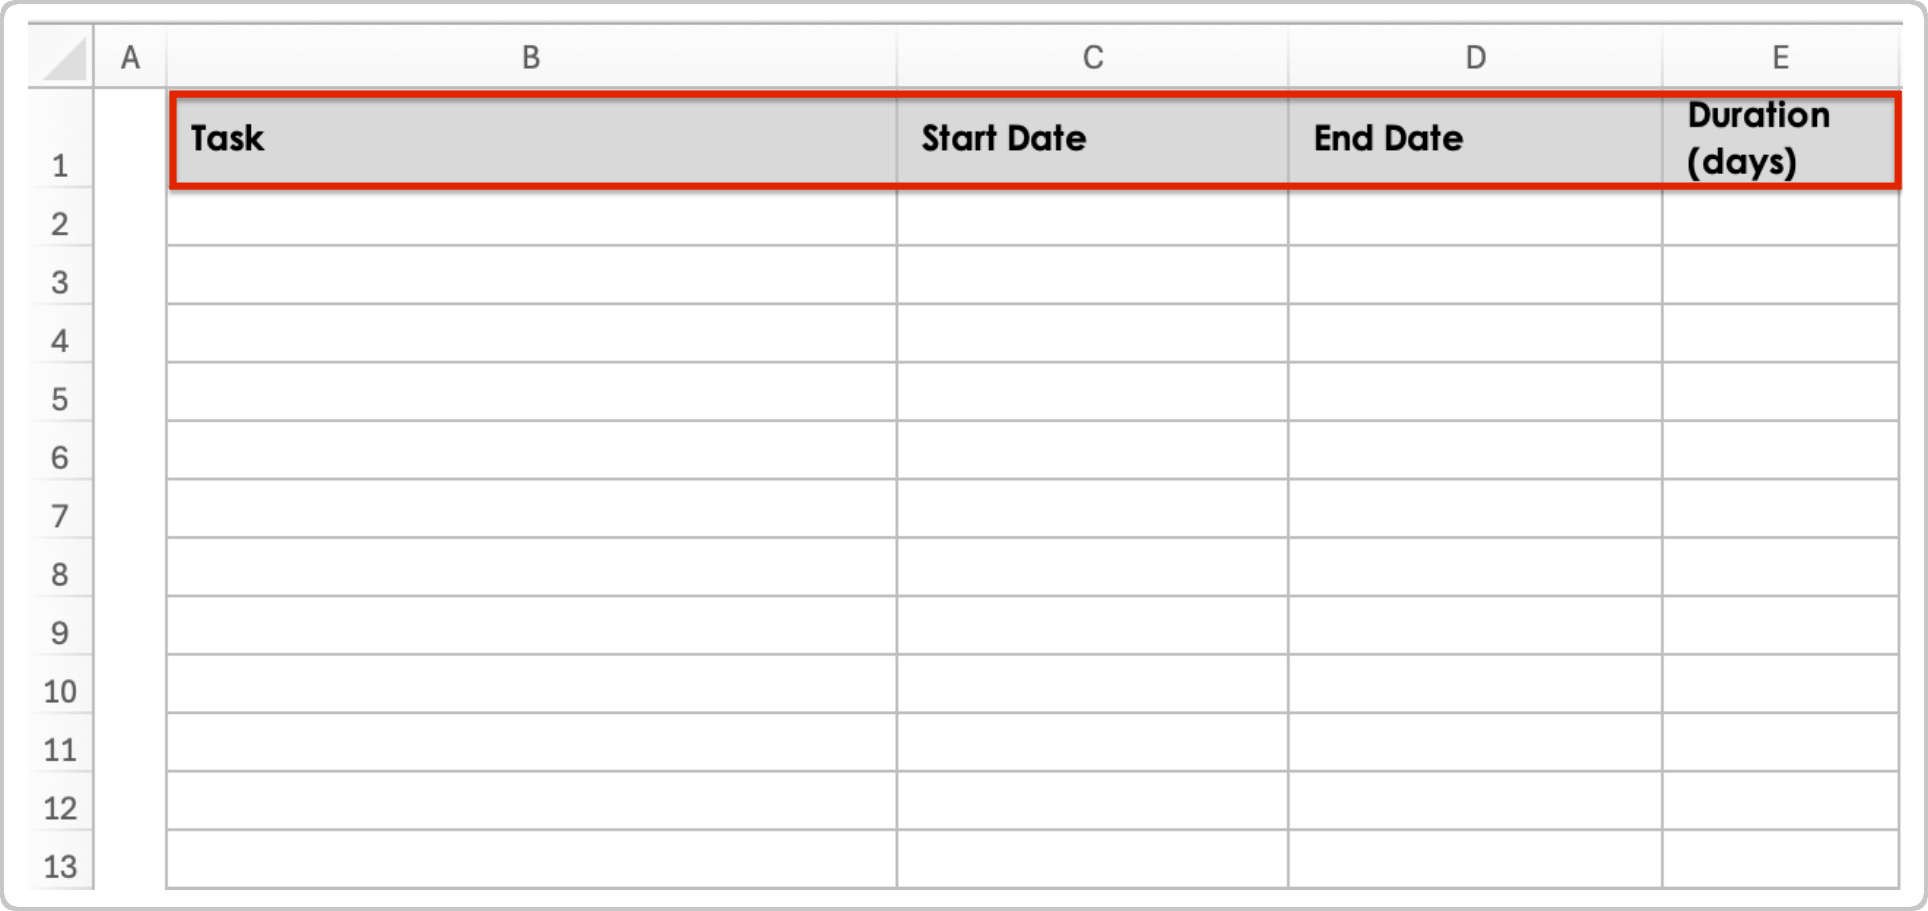
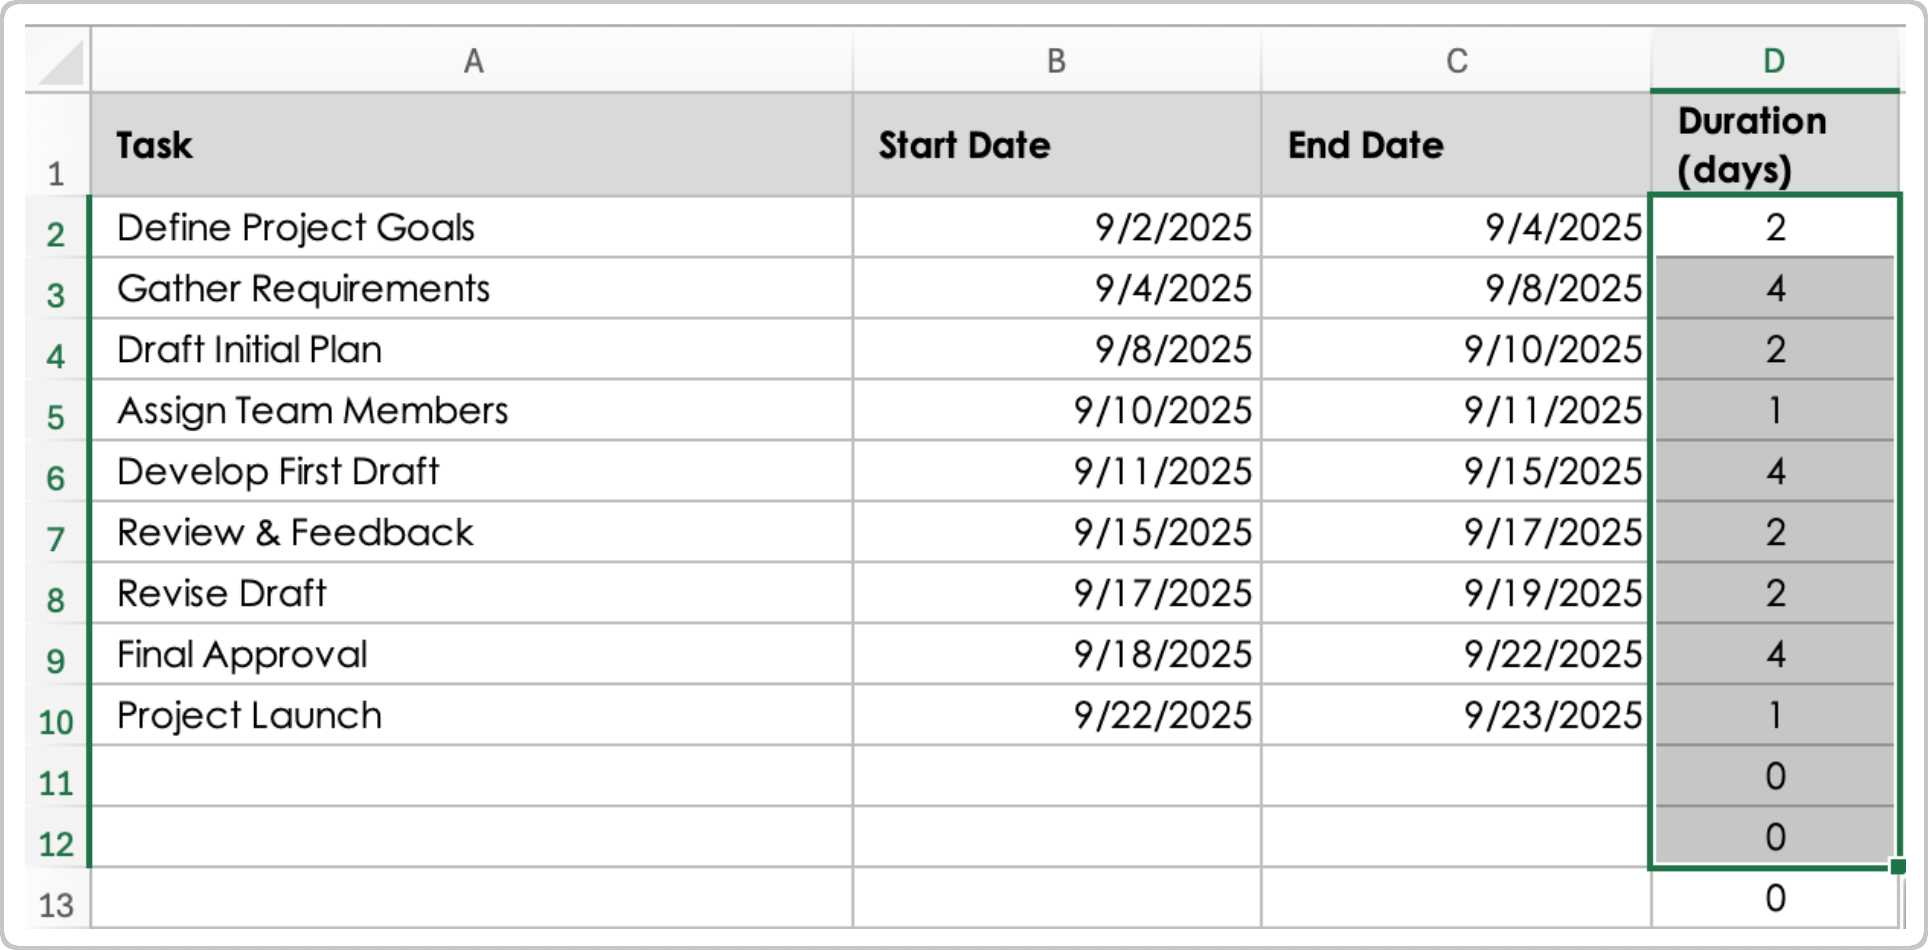
- Create the following column headings for your data set: Task, Start Date, End Date, and Duration (days).
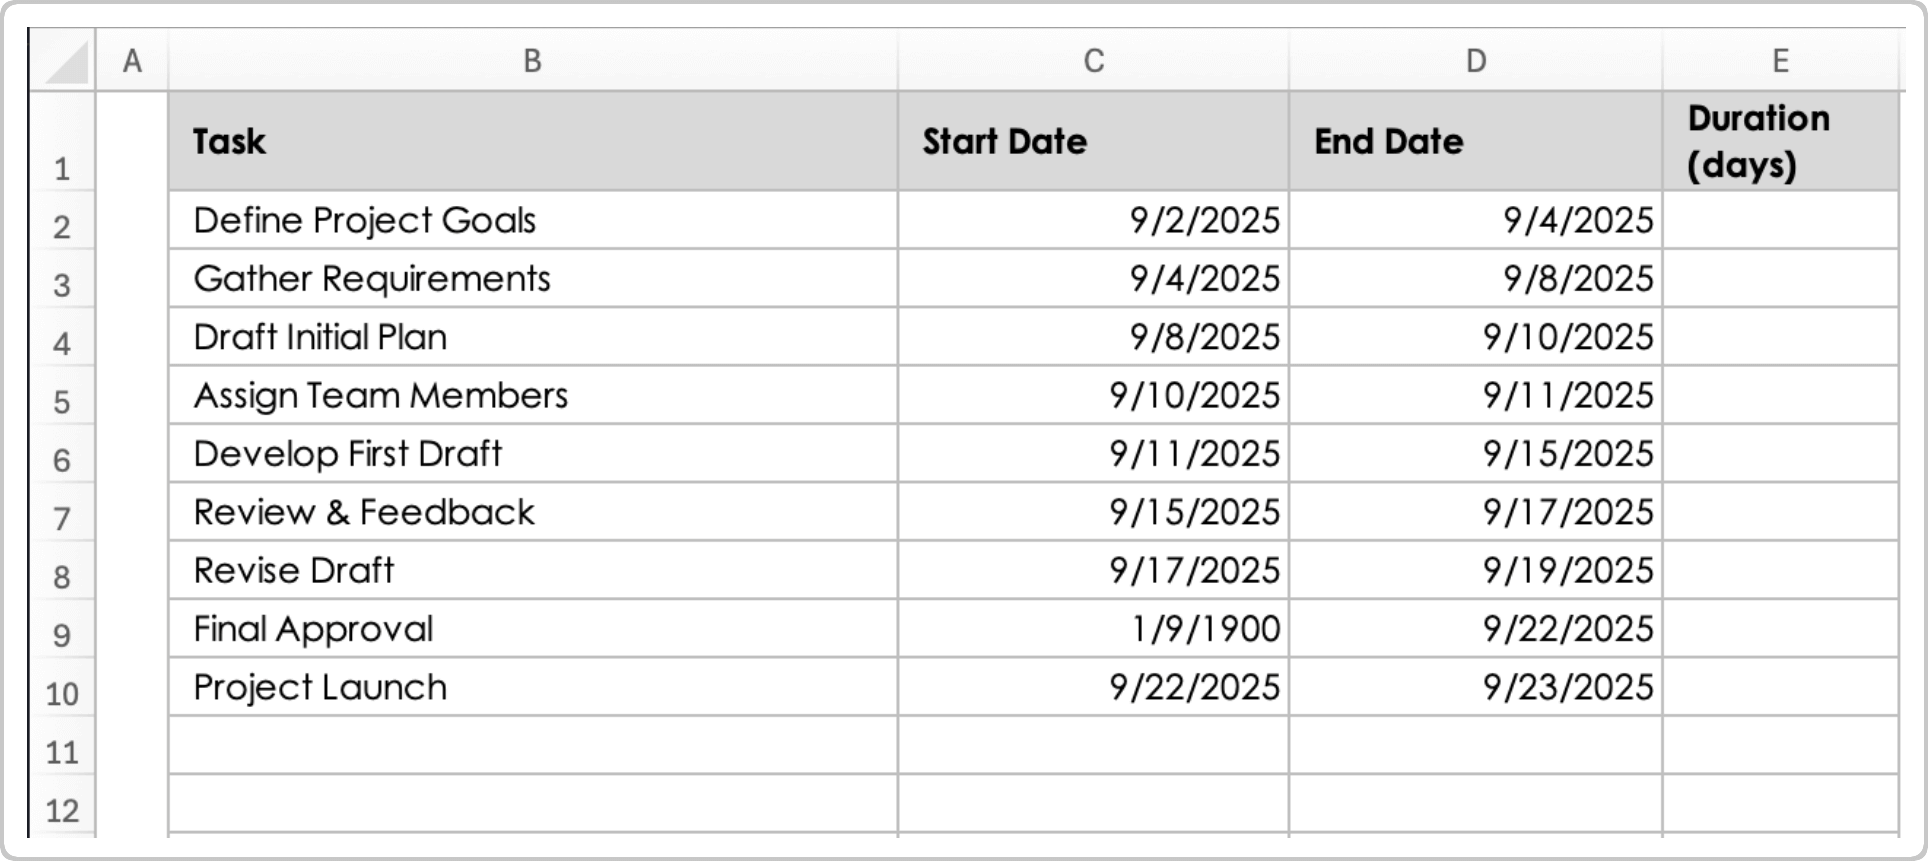
- Enter project data, including task names and start and end dates.
- Create a formula to automatically calculate the duration for each task. To do so, enter a formula that subtracts the start date from the end date. In the example below, the formula is =C2-B2.
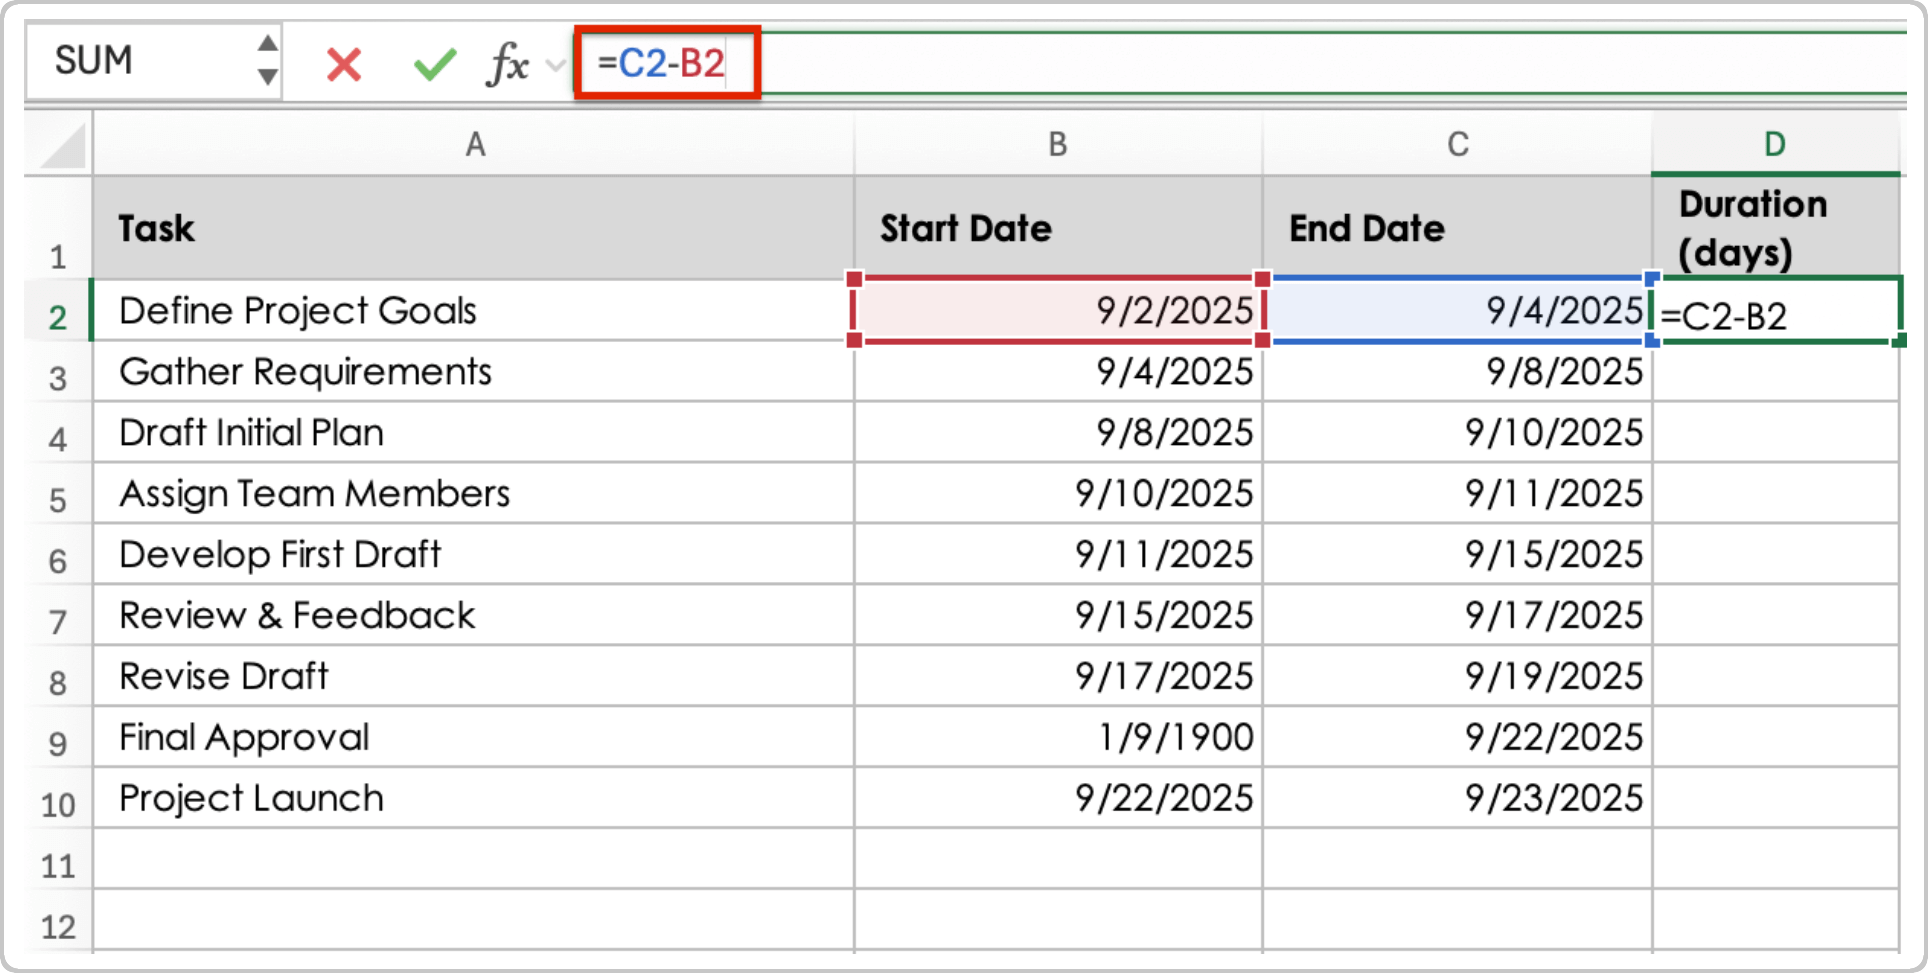
Click and drag the formula so that it applies to all rows.
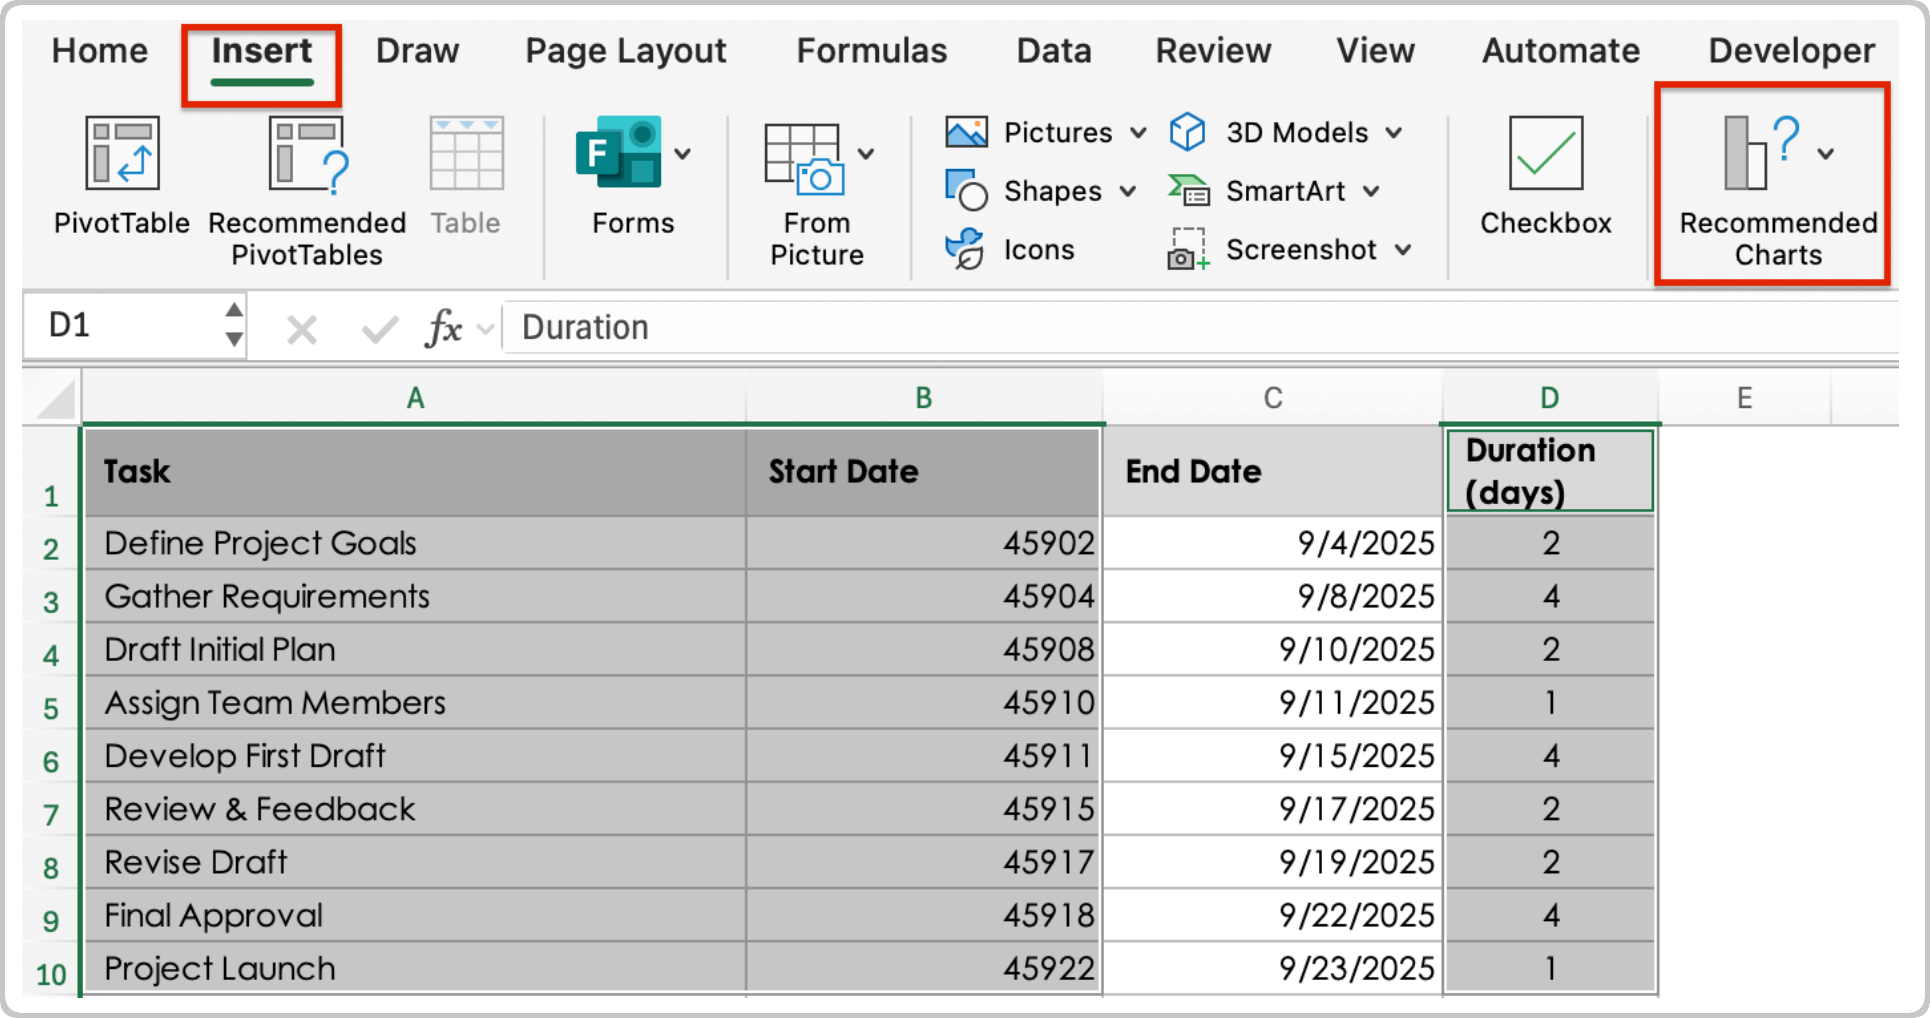
- To format the Start Date column, highlight the column and right-click. Click Format Cells. Under the Number tab, click General, then OK.
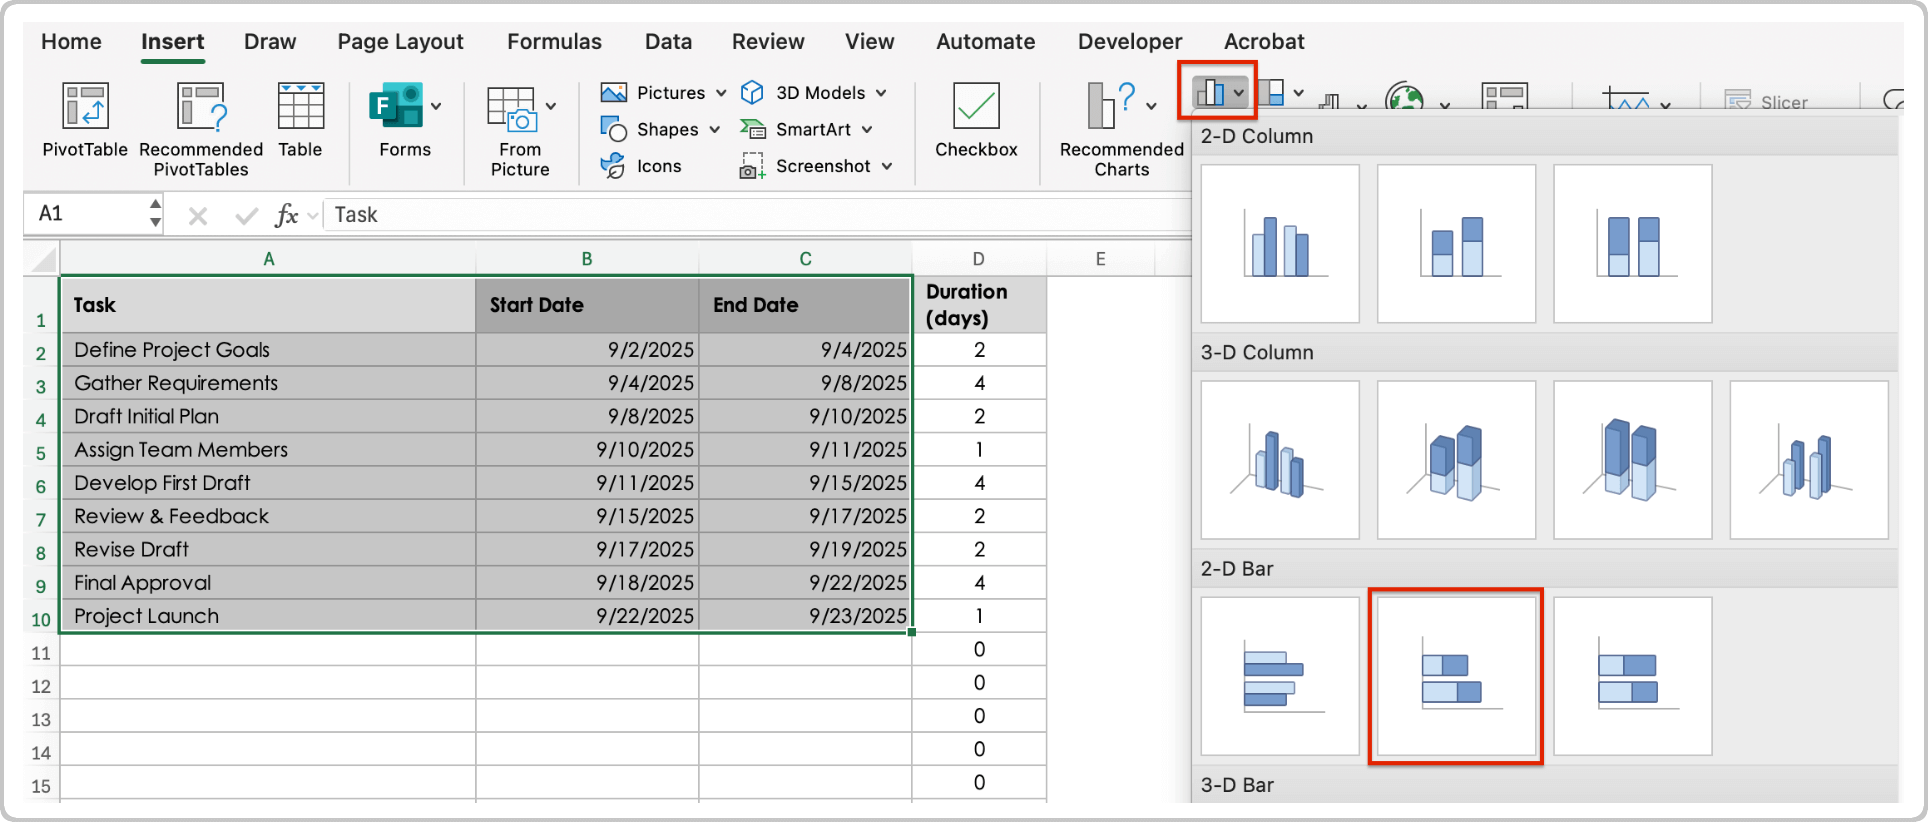
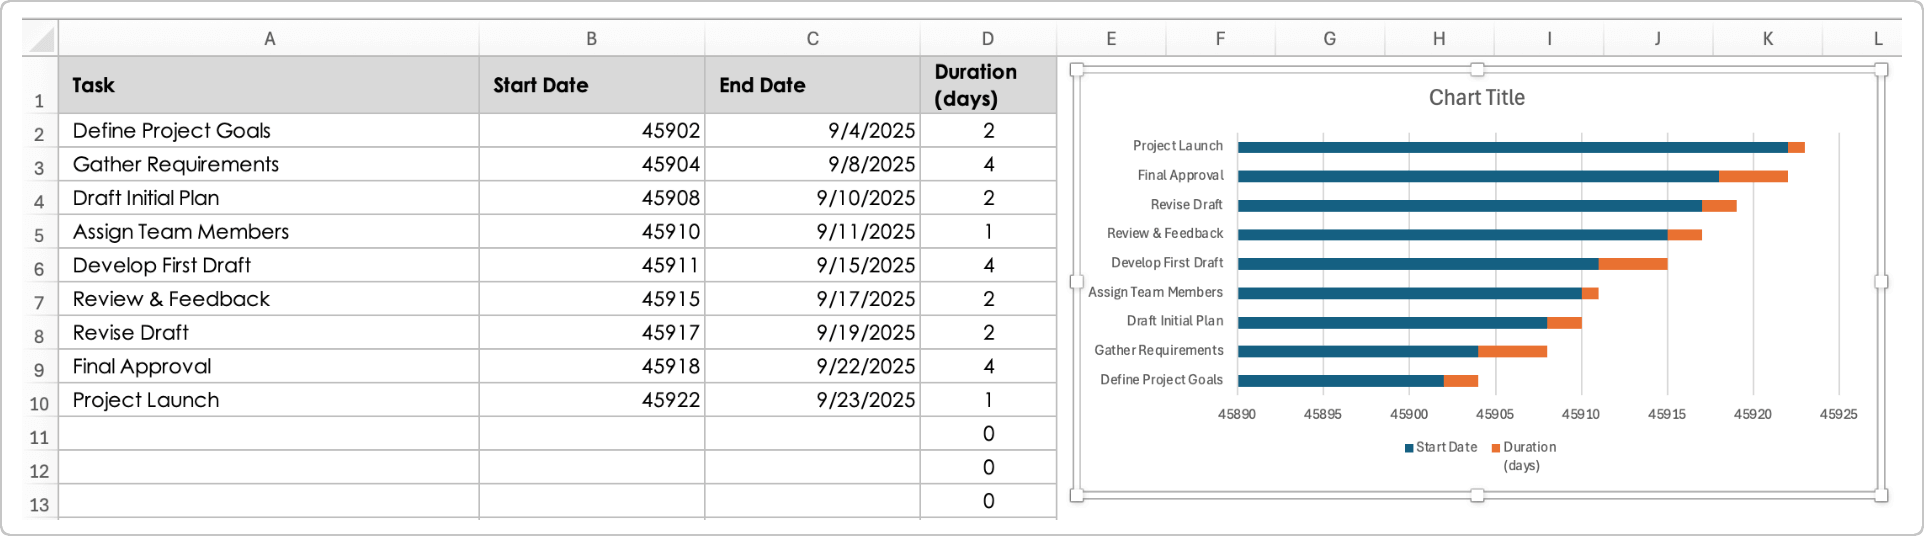
- Insert a stacked bar chart by selecting the data range, including the Task, Start Date, and Duration (days) columns. Click Insert > Recommended Charts.
Click the All Charts tab, followed by Bar > Stacked Bar > OK.
A bar chart will populate to the right of the table.
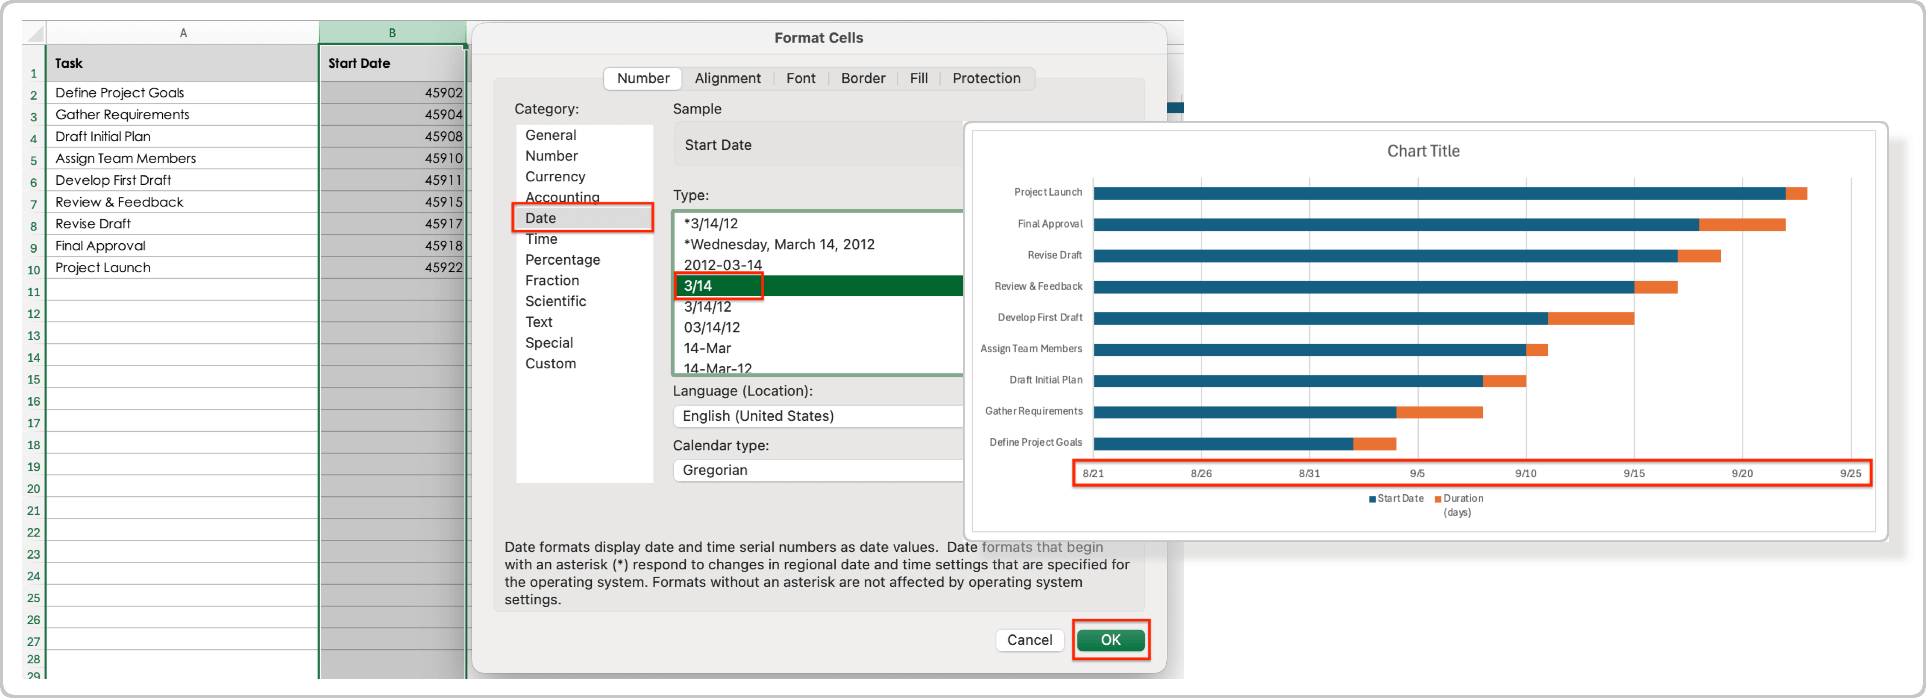
- To format the x-axis to list dates, highlight the Start Date column. Right-click and select Format Cells. Then click Date and select a format. Click OK.
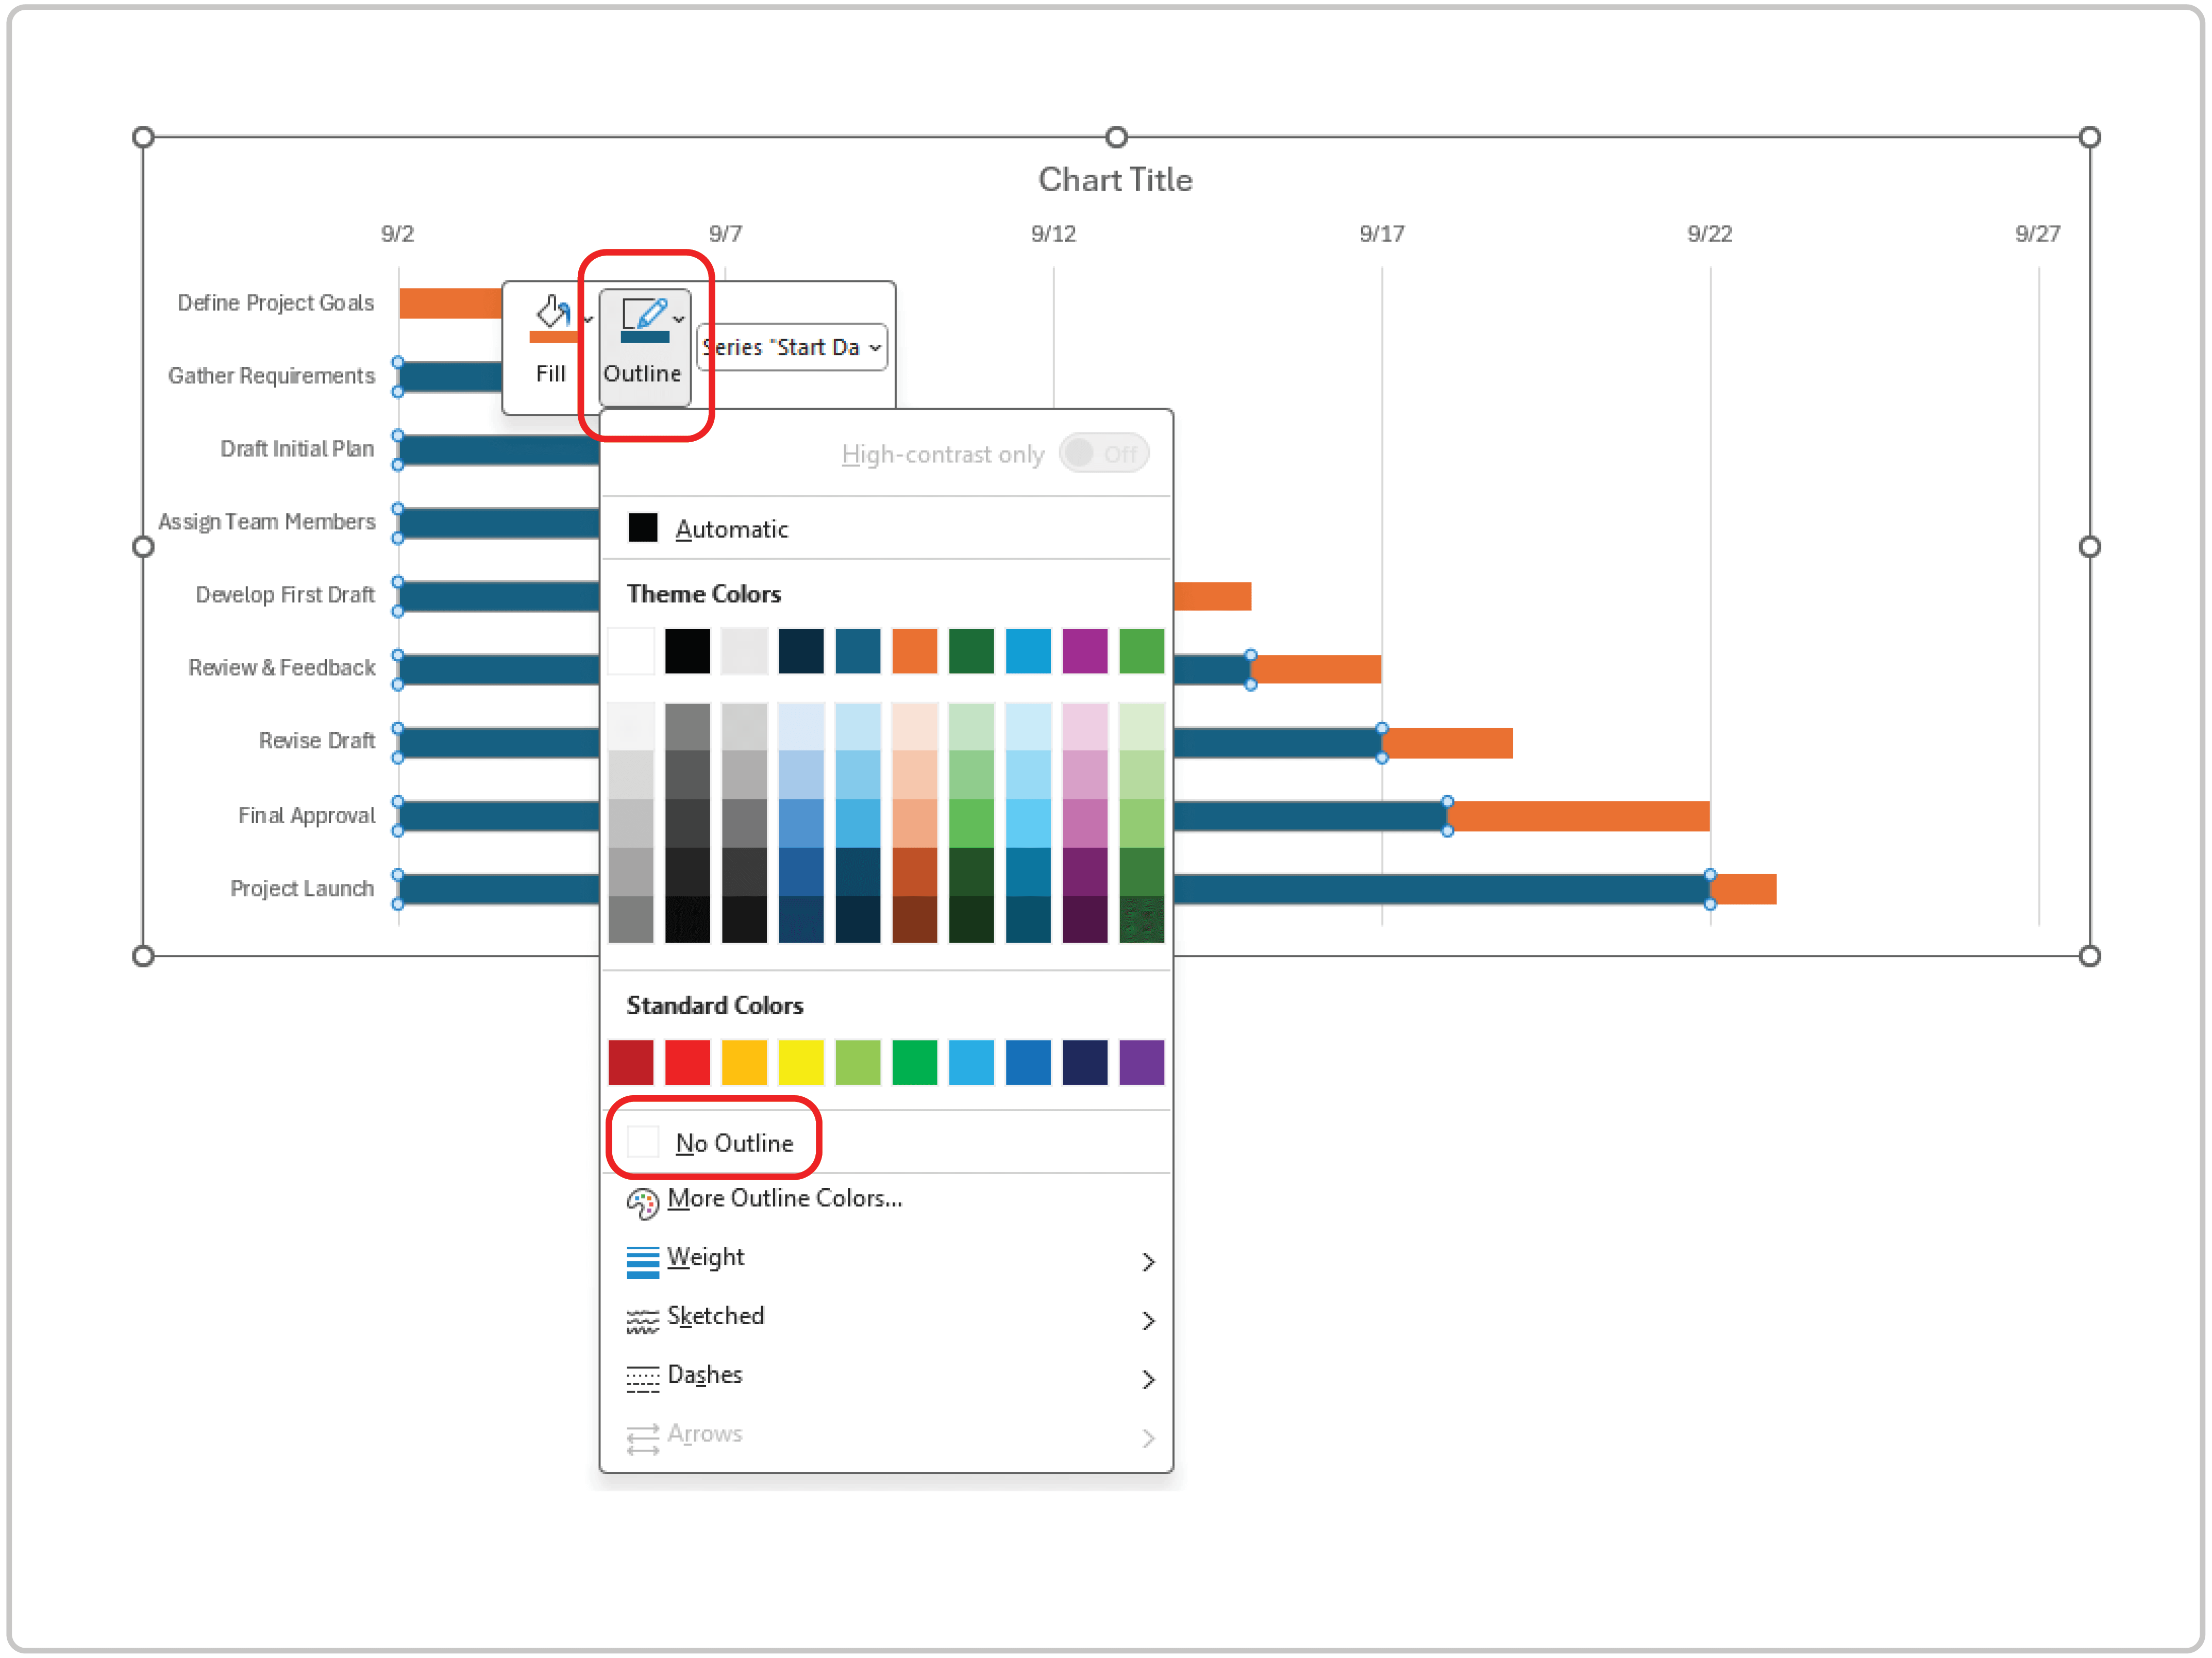
- To customize the horizontal bars on the chart, double-click anywhere on the bars. Right-click, click Outline, then click No Outline.
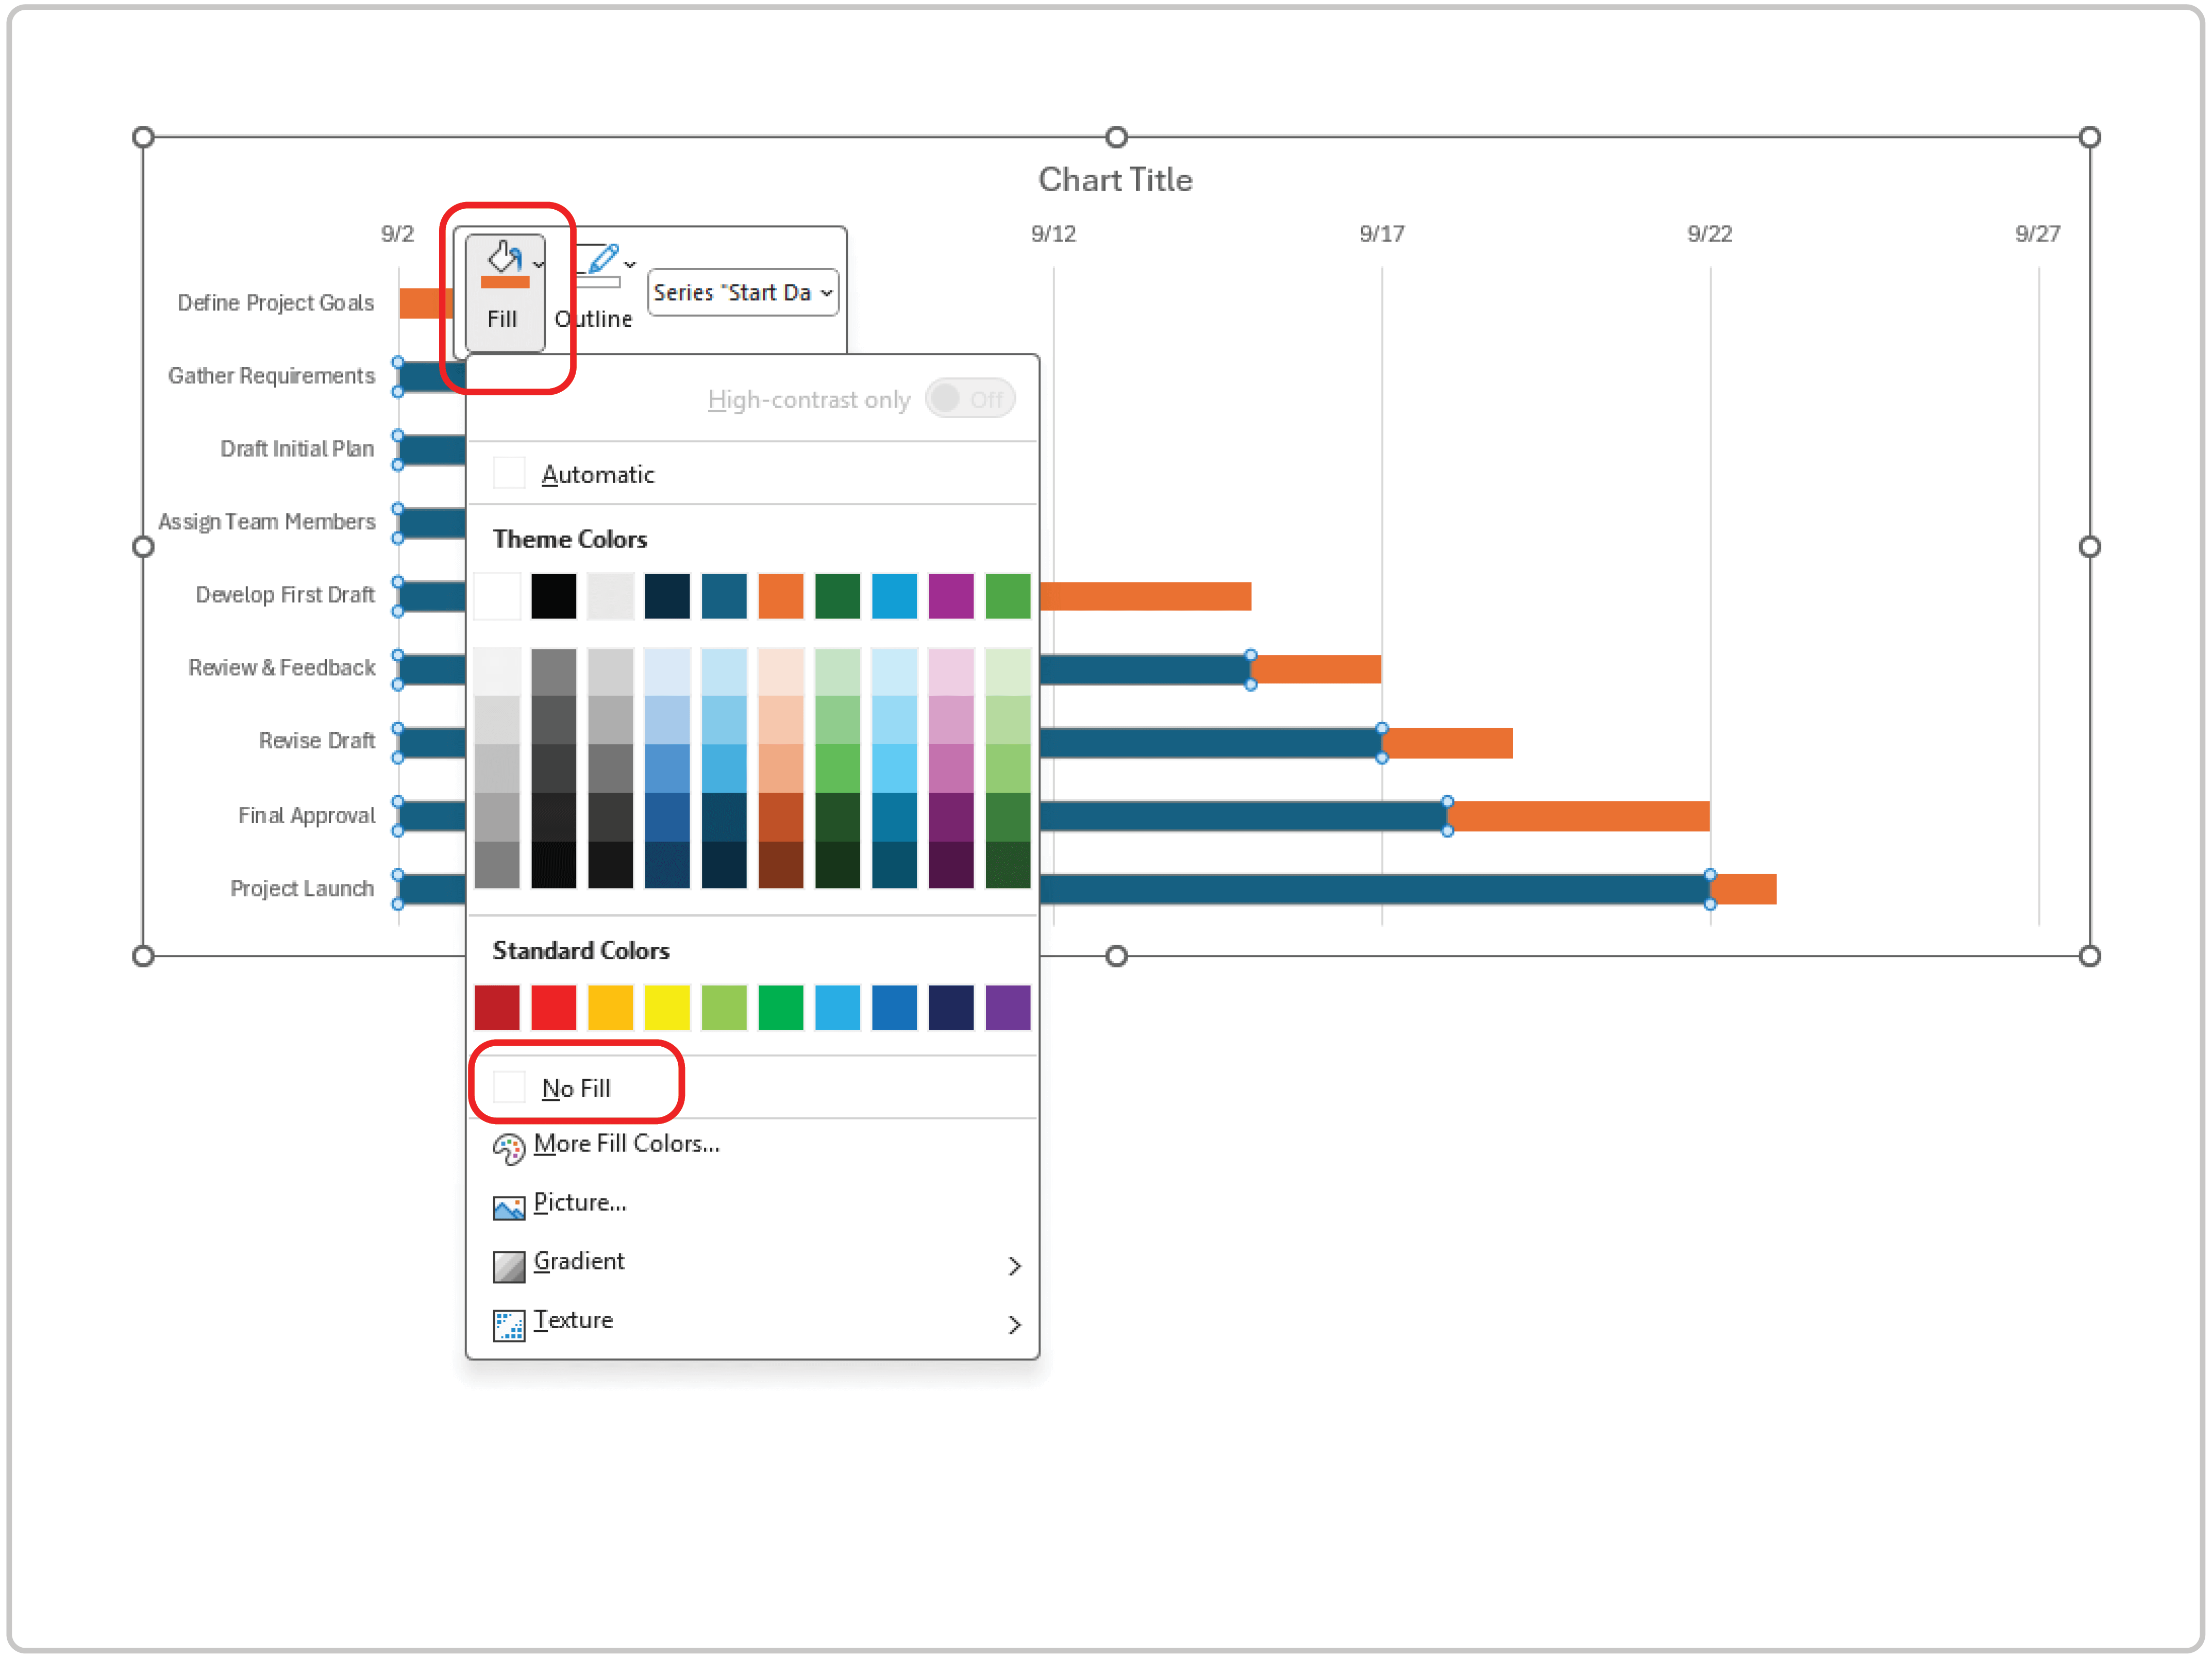
Double-click anywhere on the blue bars. Right-click, click Fill, then No Fill.
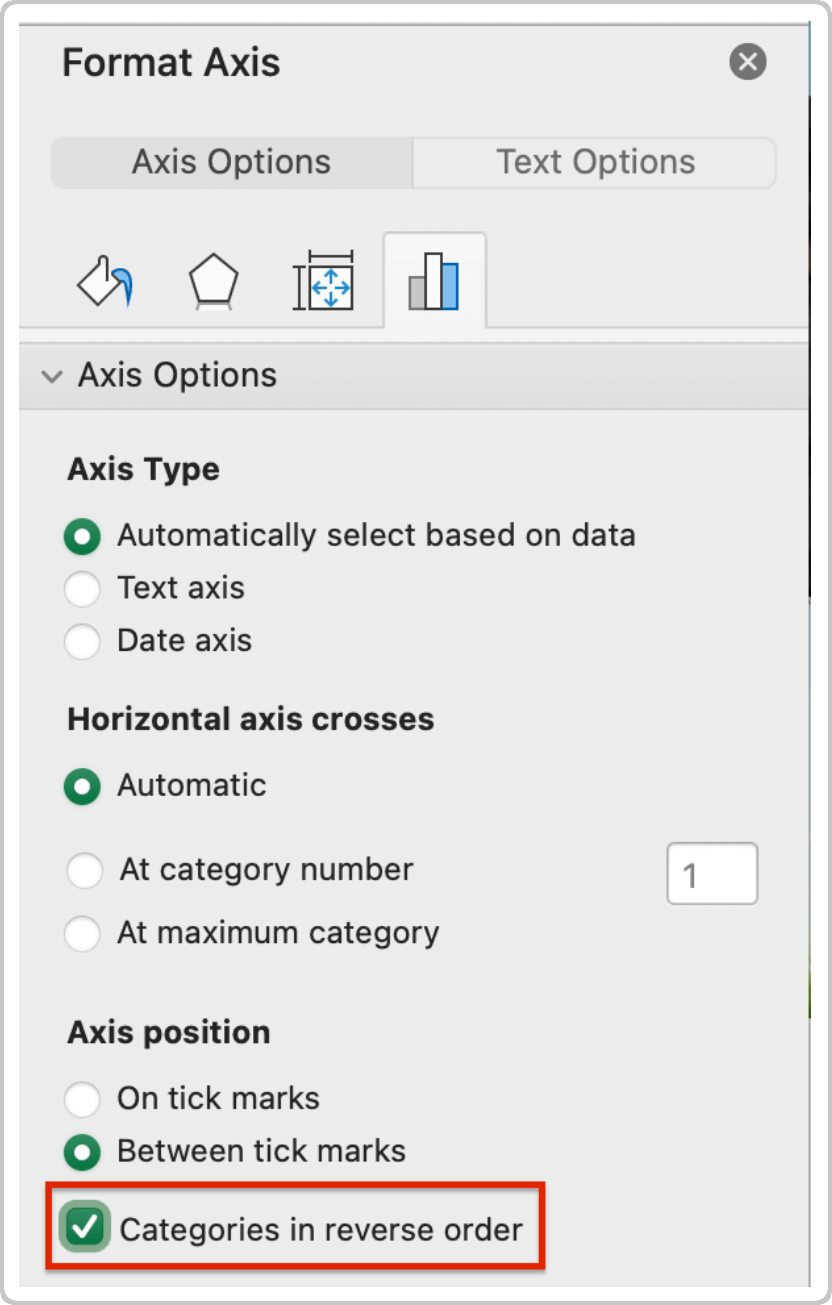
- To reverse the task list so that it starts with the first task, double-click the task list inside the chart to open the Format Axis panel. Click the Axis Options icon.
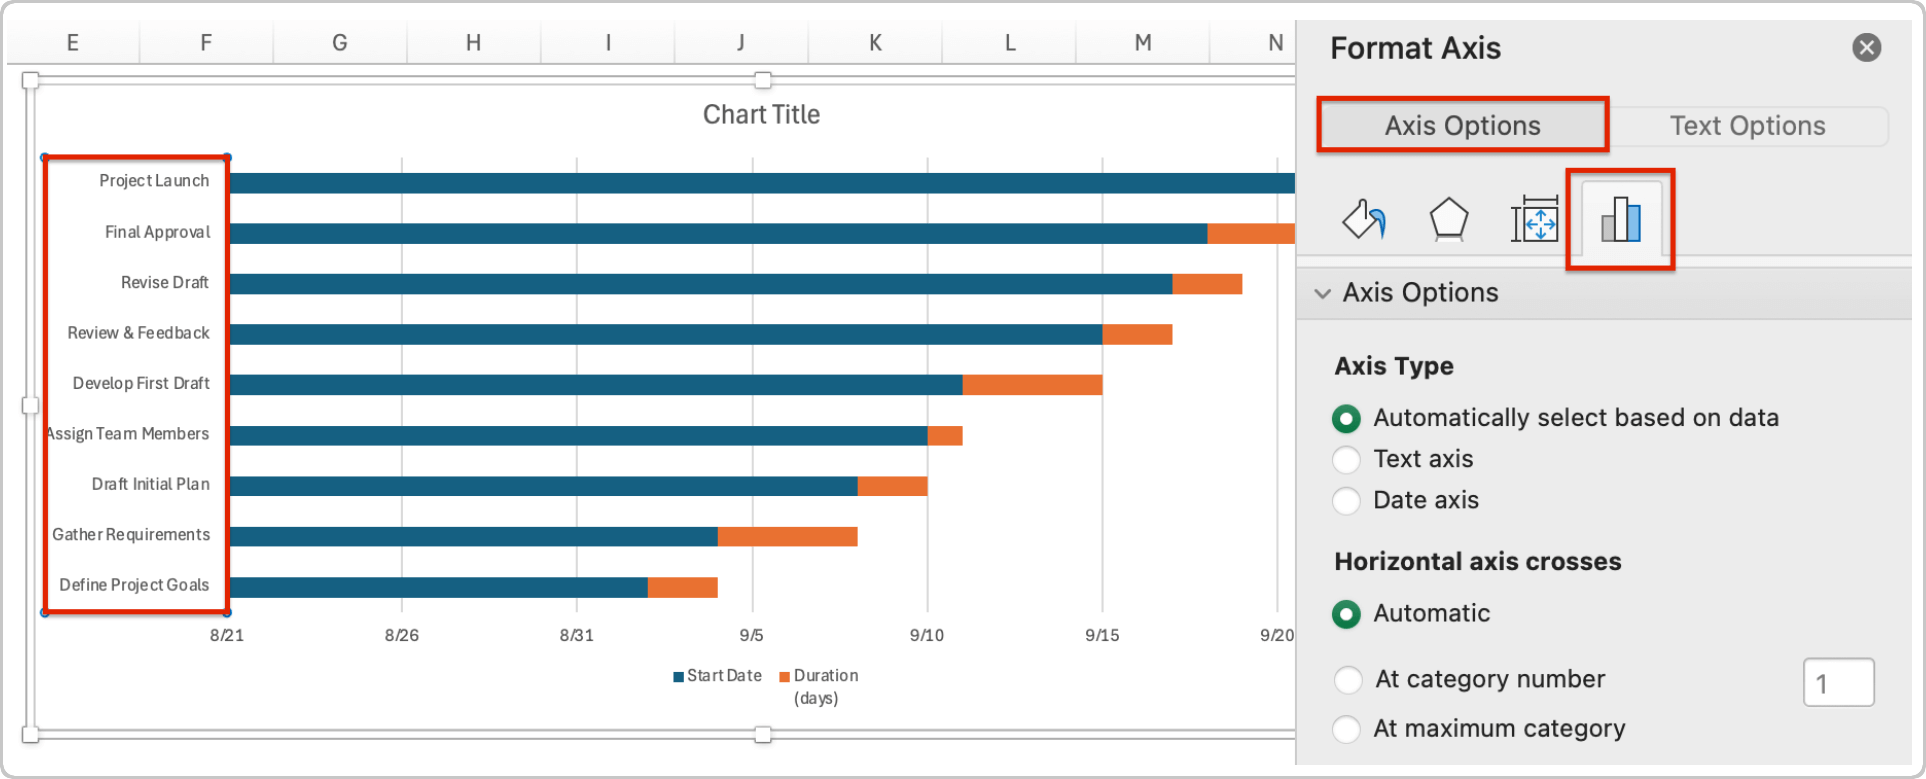
Under Axis position, select the Categories in reverse order check box.
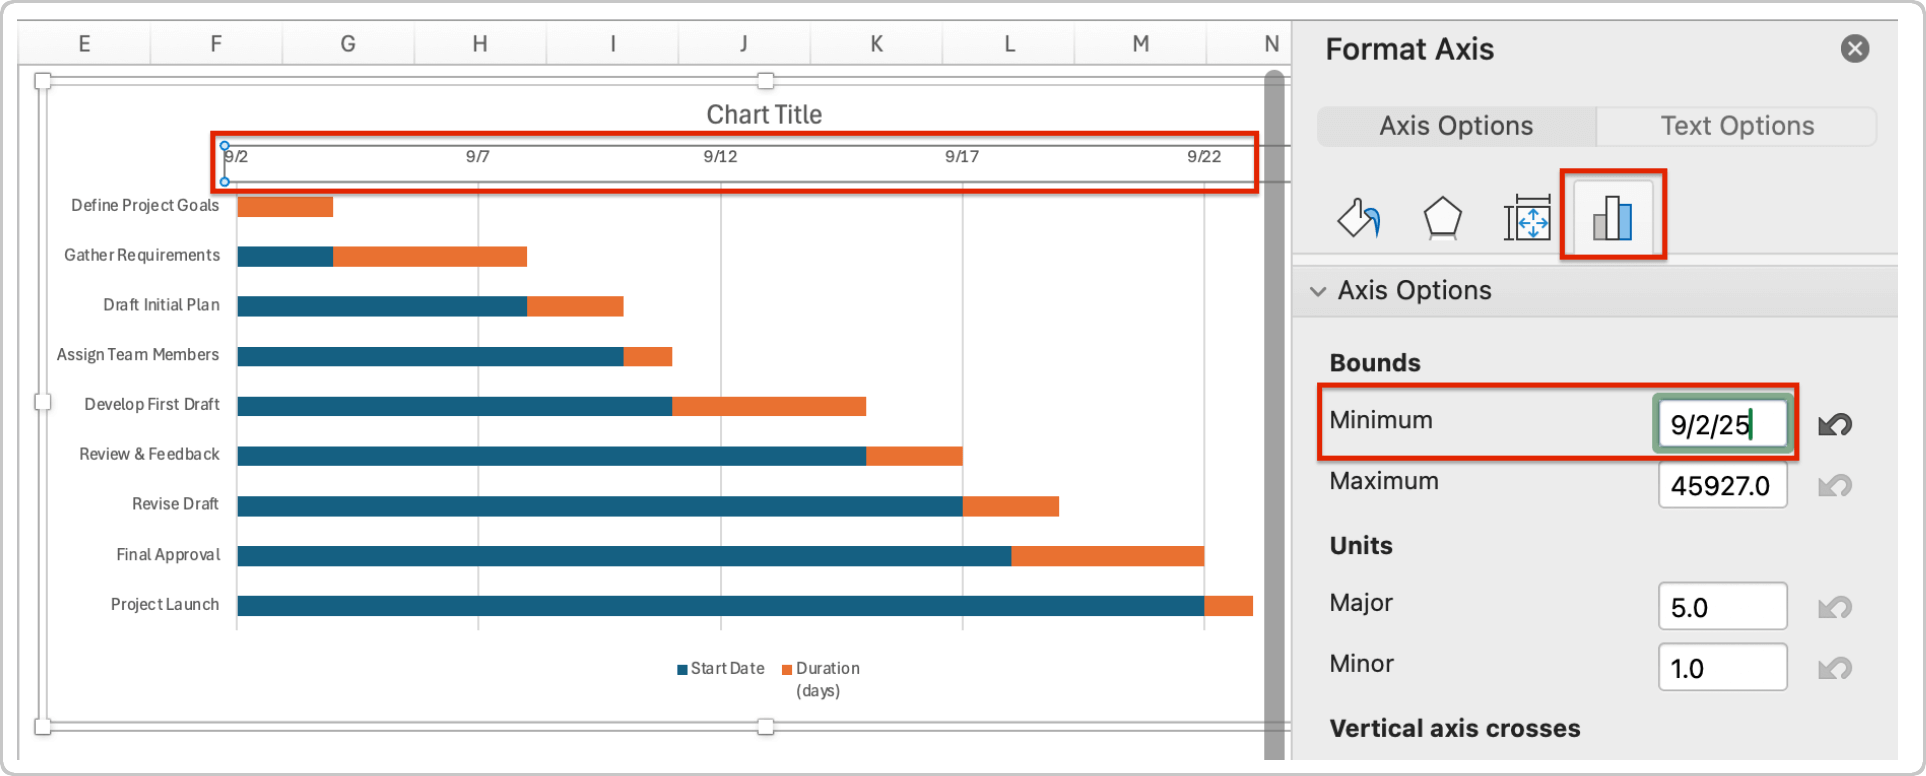
- Reposition the duration bars so that they start at the beginning of the chart. Double-click the dates to open the Format Axis panel. Click the Axis Options icon. In the Minimum field, enter the start date of the first task, then press Enter on your keyboard.
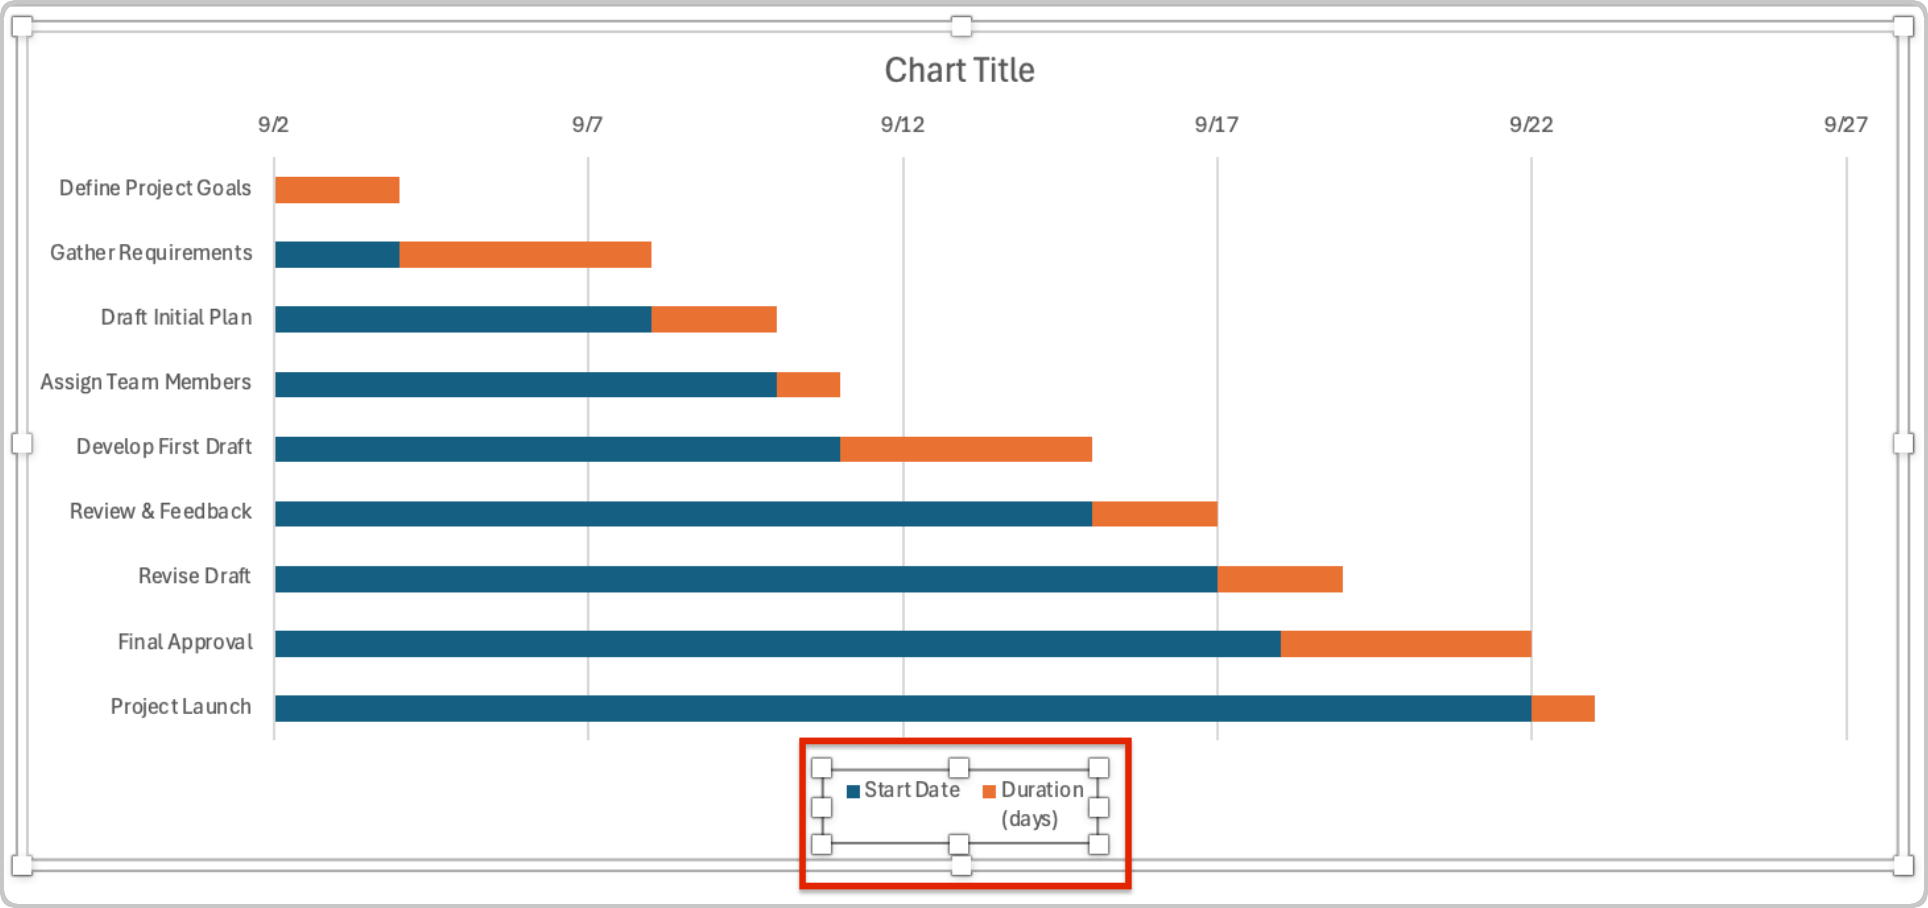
- To remove the legend from the Gantt chart, double-click the legend and press Delete on your keyboard.
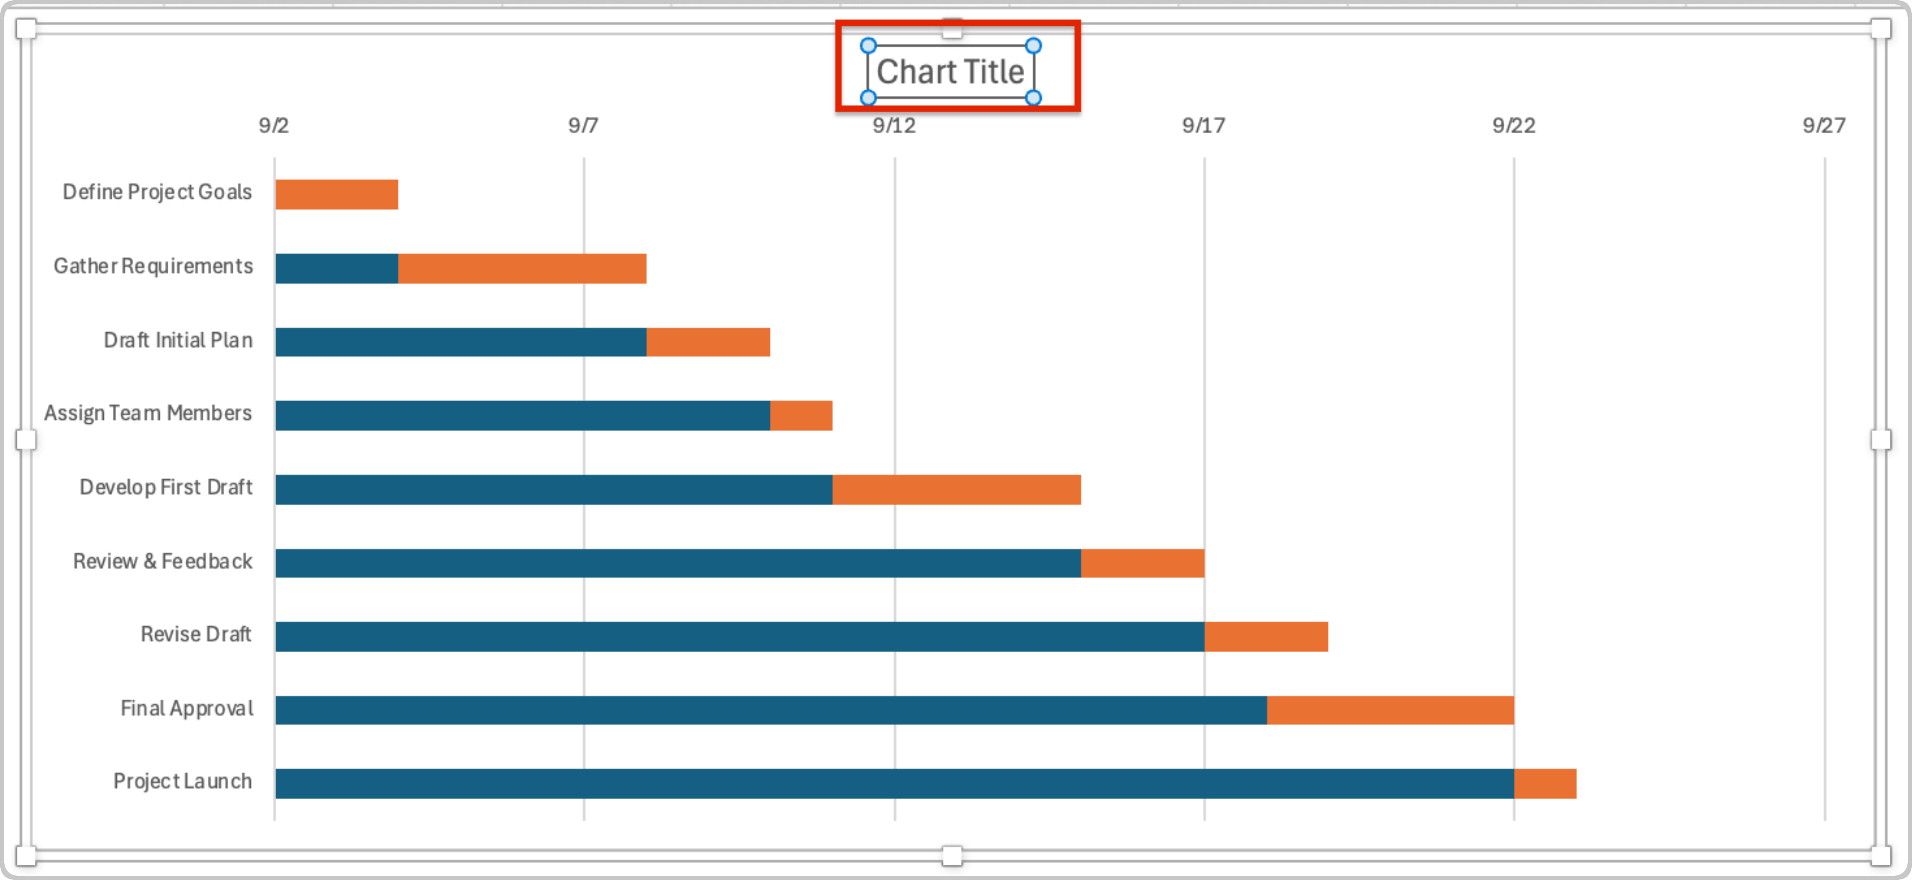
- Click on Chart Title and replace the text with your project’s title.
Download and customize a variety of monthly Gantt chart templates to easily plan and track your projects on a month-by-month timeline.
Pros and Cons of Making a Gantt Chart in Excel
Creating a Gantt chart in Excel provides basic task tracking and a visual overview of task progress. The benefits include the ability to customize data and store all project information on one screen. However, it is time-consuming to build and difficult to keep current.
A full list of the pros and cons of making a Gantt chart in Excel are below:
Pros | Cons |
|---|---|
| Customizable | Time-consuming setup |
| Flexible | Requires advanced Excel experience |
| Free | Lack of advanced project management features |
| Ability to store information in one location | Becomes cluttered for large projects |
| Cloud allows collaboration (OneDrive or SharePoint) | Static when not used in the cloud |
To simplify scheduling, tracking, and collaboration on your projects, explore the advantages of using online Gantt chart software.
Video: How to Make a Gantt Chart in Smartsheet

Improve Project Visibility With Real-Time Gantt Charts in Smartsheet
Empower your people to go above and beyond with a flexible platform designed to match the needs of your team — and adapt as those needs change.
The Smartsheet platform makes it easy to plan, capture, manage, and report on work from anywhere, helping your team be more effective and get more done. Report on key metrics and get real-time visibility into work as it happens with roll-up reports, dashboards, and automated workflows built to keep your team connected and informed.
When teams have clarity into the work getting done, there’s no telling how much more they can accomplish in the same amount of time. Try Smartsheet for free, today.
Gantt Chart Excel FAQs
Smartsheet offers free Gantt chart templates in various formats including Excel. Choose a template that fits your project needs and customize it with tasks, dates, and milestones. These templates simplify project tracking, making it easier to visualize progress, allocate resources, and share updates with stakeholders.
Yes, you can convert an Excel spreadsheet to a Gantt chart if it's formatted correctly. Create a simple data table with your project’s task names, start dates, end dates, and durations, then insert a Gantt chart to visually map your timeline.
Yes. Although Excel doesn’t offer a Gantt chart, it’s easy to build your own. Create a data table with your project tasks, their start and end dates, and durations. Next, insert a stacked bar chart to represent each task’s duration. Customize the bar chart to match your visual style.

