Gantt Charts and Work Breakdown Structures (WBS)
A work breakdown structure (WBS) is a diagram that shows what a project will achieve or build, including project scope. A Gantt chart is a visual that uses bars to illustrate the timeline of the project activities.
Summary Overview:
|
The work breakdown structure and Gantt chart both play important roles in project planning, as successful project completion relies on having a clearly defined goal and completion date. Both your objective and schedule influence project cost and labor needs among other variables, so it’s crucial to get them right.
In fields such as construction and software development, the work breakdown structure acts as a starting point for the Gantt chart. The two tools help managers create a project plan.
To further explore these tools and how they can enhance your project planning, check out the following resources:
- Guide to Work Breakdown Structures: Learn the purpose, structure, and best practices for creating a WBS, and see how it can serve as the foundation for other project planning tools, including Gantt charts.
- Downloadable Templates for WBS: Access free, customizable WBS templates for different project types. These templates include options for Smartsheet, Excel, Google Sheets, and PowerPoint.
- Guide to Gantt Charts: Learn the basics of Gantt charts, their key components, and how to use them to visualize project timelines, manage dependencies, and track progress. This guide also includes checklists for creating and applying Gantt charts.
- Best Uses of Gantt Charts in Project Management: Explore the benefits and limitations of Gantt charts. See how they can improve efficiency, aid in resource management, and provide a clear overview of project schedules — along with potential challenges such as complexity and scalability.
Difference Between WBS and Gantt Chart
Work breakdown structures show what you are making, and Gantt charts show when you are doing so. The WBS breaks down work hierarchically, from top to bottom. The Gantt chart is linear and displays time progression from left to right.
Project planners often describe work breakdown structures as noun-focused, meaning they list concrete milestones and outcomes, rather than activities. For example, when you are constructing a building, the work breakdown structure displays the component elements of the structure, such as the foundation, electrical system, and roof.
By contrast, the Gantt chart focuses on dates, shows the order of project activities, and reflects any dependencies among tasks. Dependencies are activity relationships in which the ability to start or finish one task relies on the progress or completion of another. For example, in order to paint a wall, you must first build it.
These relationships determine the critical path, which is a scheduling tool that helps you determine project duration by identifying the longest series of dependent activities and calculating how long you need to complete them.
Work Breakdown Structure (WBS) vs. Gantt Chart
| WBS | Gantt Chart | |
|---|---|---|
| Focus | Defines what the project will deliver by breaking scope into smaller components | Defines when tasks occur by mapping them along a timeline |
| Format | Hierarchical — a top-down outline of deliverables, often visualized as a tree or a nested list | Linear — a horizontal bar chart that tracks task timing from start to finish |
| Content | Deliverable-based — focuses on nouns (e.g., “roof,” “website”) rather than actions | Task-based — focuses on verbs and processes (e.g., “install,” “design”) |
| Timeline | Static — does not include dates or task durations | Dynamic — includes start and end dates, durations, and overlapping tasks |
| Dependencies | Not represented — task order and relationships are not shown | Clearly represented — shows task sequences and critical path relationships |
| Use Case | Best for defining project scope and identifying all required outputs before scheduling begins | Best for scheduling tasks, tracking progress, and managing dependencies |
For background on dependencies in Gantt charts, read our roundup of Gantt chart templates with dependencies and our roundup of critical path templates.

When comparing a Gantt chart and a work breakdown structure, Matthew Ramirez, Founder of Rephrase Media, an artificial intelligence application developer, distinguishes between the two tools by noting that a work breakdown structure is for project planning, and a Gantt chart is for project tracking.

“Unlike a Gantt chart, a work breakdown structure does not specify how or when tasks will be done. A WBS is not a schedule or a list of all activities and responsibilities. Team leaders sometimes try to include all the tasks needed for a project within the WBS. This often leads to missed tasks and project delays.”
— Brad Tousenard, CEO of SpinupWP, a company that makes server control panels
During project execution, project participants use the two resources in different ways. The work breakdown structure tends not to vary significantly over the course of a project, while the Gantt chart will update frequently based on progress. This makes sense when you consider that teams rarely decide to change what they are building midstream.
That said, it is very common for unexpected circumstances — such as discovered work, a shortage of materials, or unexpected weather — to slow down or speed up a project. These changes will typically result in daily or weekly modifications to the Gantt chart.
How to Convert a WBS into a Gantt Chart
Work breakdown structures are one of the first resources that planners create during a project. To create a Gantt chart using this and other project information, you can use project planning software or follow the step-by-step instructions below.
Step 1: Start with Your Work Breakdown Structure
Your work breakdown structure shows the project end result broken down into its components. Remember that these should be concrete products, not activities.
As an example, take the construction of a house. List the end product — the house — at the top of the diagram.
Beneath that, break down the job into the various building systems and components, including foundation, frame, roof, electrical, heating and cooling, water and sewage, and finishes. Then break down each component further (e.g., underneath “finishes,” list paint, flooring, and fixtures).
Depending on the complexity of the project, you might continue to decompose each component several more times, listing smaller milestones at each level. At the end, you will have a Gantt chart that includes milestones. The smallest element in the WBS is called a work package. For example, in a WBS hierarchy for flooring, “kitchen floor” might be one work package.
Step 2: Identify Activities for Each Work Package
For each work package, determine the activities or tasks that must happen in order to achieve the desired result. While the work breakdown structure is noun-focused, these activities are process- or verb-oriented.
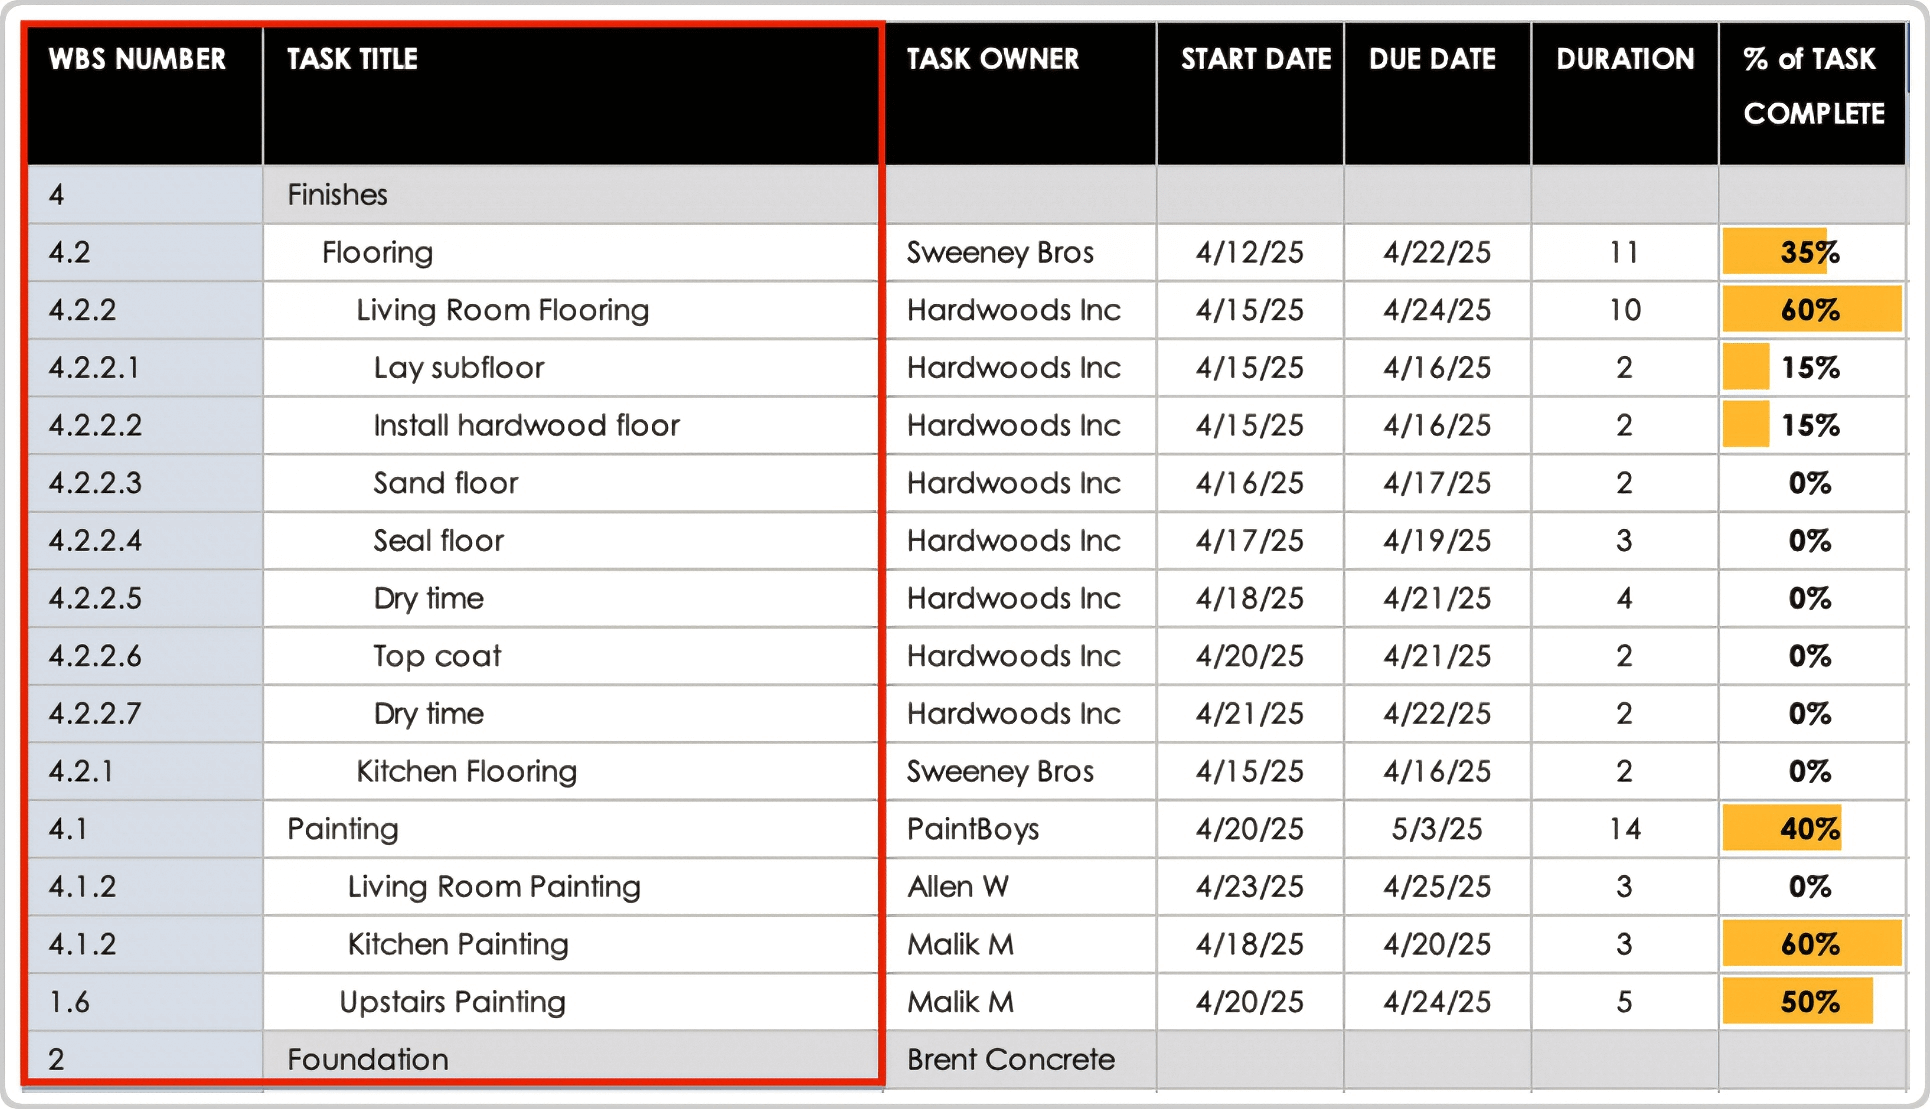
In this example, the flooring work package would break into the various rooms and their flooring type. From that, determine the activities required to complete the flooring work. For the living room, this includes laying subflooring, installing hardwood floor, sanding the hardwood, sealing the hardwood, drying, applying a topcoat, and drying the topcoat.

As Scott Hirsch, Chief Technology Officer of online recruitment platform TalentMarketplace, explains:
“The work breakdown structure can be used to break down everything into sizable tasks that you then put onto the Gantt chart to work in sprints,” or timed cycles of work, often used in software development. He says that one common mistake is not breaking down tasks before creating the Gantt chart.
In this example, list component activities for living room flooring on Gantt sheet rows.
Step 3: Set Task Order
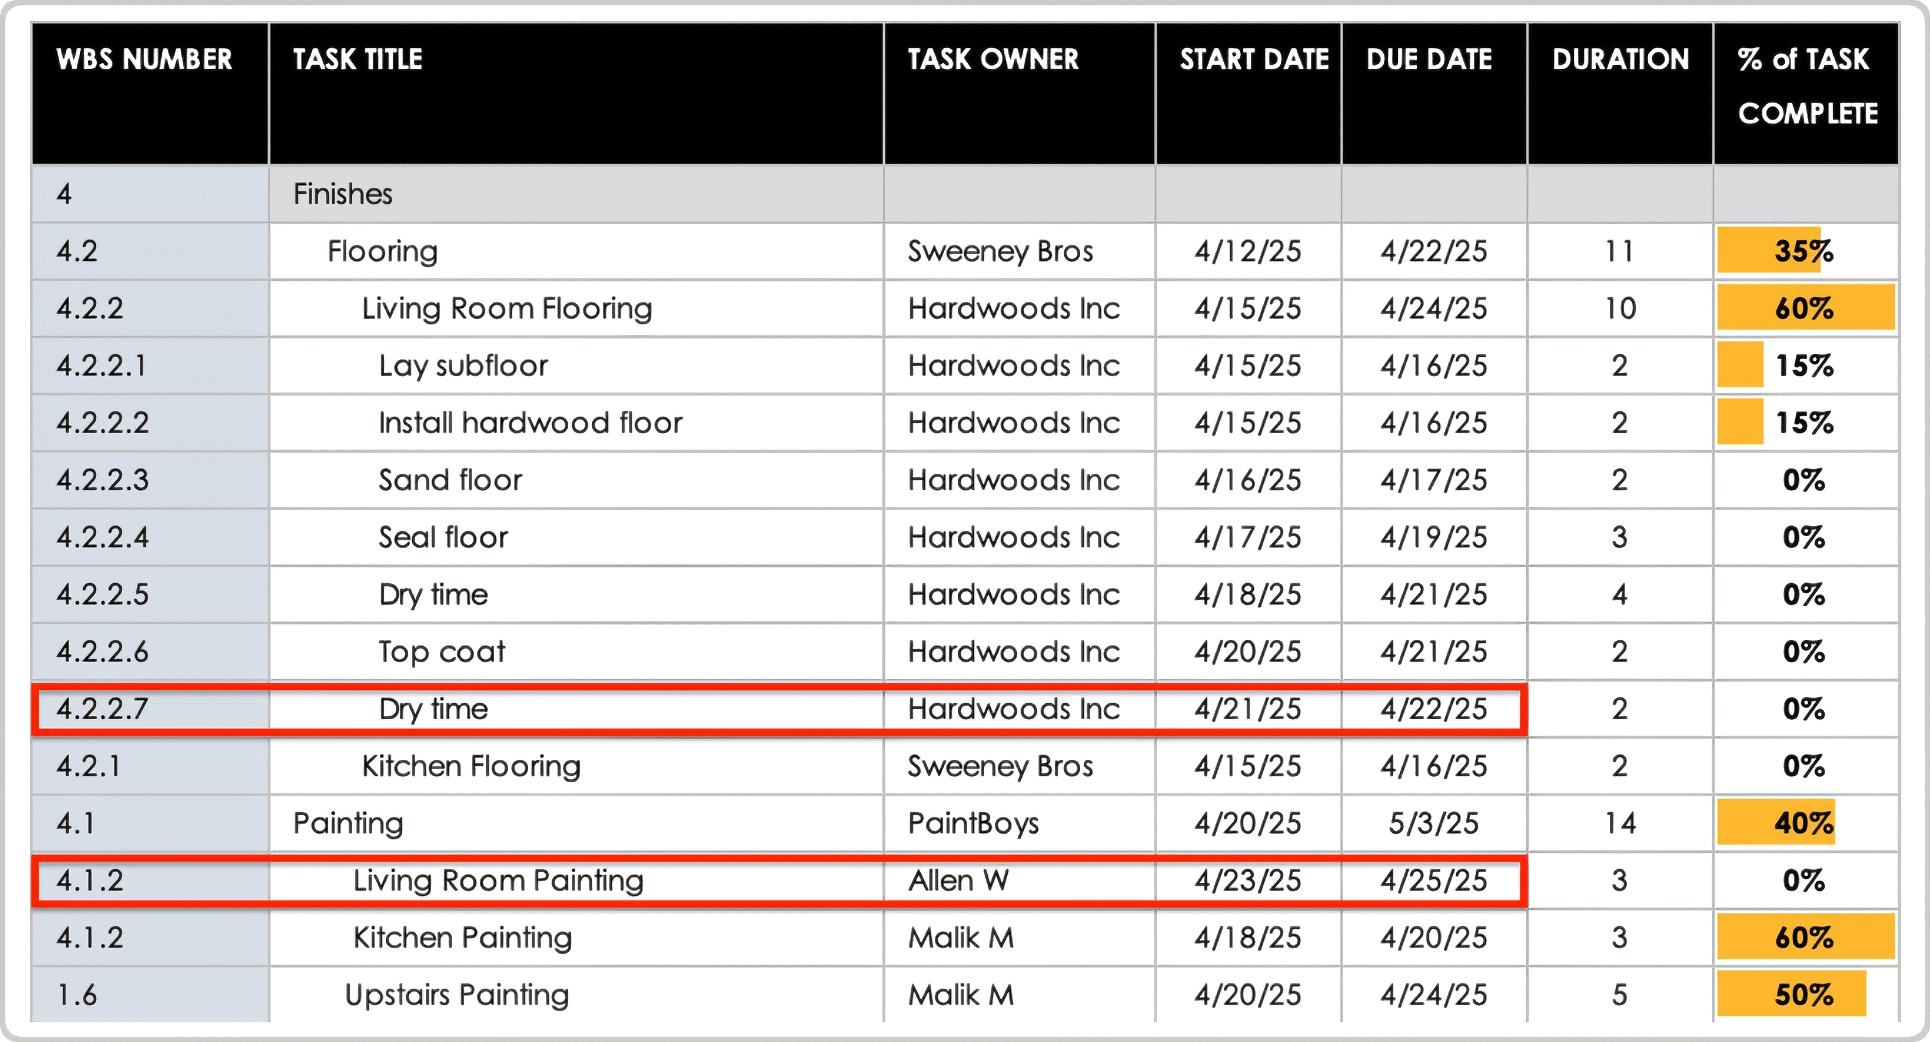
The activities in your project must occur in the right sequence — these are dependent tasks. While the order of laying subfloor before flooring is obvious, the picture becomes more complex when you add the dependency that the painters cannot enter the living room while the floor is drying. Thus, painting is dependent on the finish of the living room flooring. The scheduler needs to build in two days between installing the living room flooring and painting for the hardwood topcoat to dry.
Tousenard says, “It is important to review your task dependencies before creating a Gantt chart from your work breakdown structure. This means determining what tasks are dependent on another being completed. There are four types of dependency relationships between a predecessor task and a successor task.”
These dependency relationships are as follows:
- The predecessor must finish before the successor can start.
- The predecessor must start before the successor can start.
- The predecessor must finish before the successor can finish.
- The predecessor must start before the successor can finish.
You will represent these dependencies on the Gantt chart.
Step 4: Estimate the Duration for Each Task
In another part of the project planning process, you will identify all the resources you need to complete the work, including personnel, materials, and equipment. These can factor into dependencies as well, such as when the person laying the flooring in the living room is also installing the floor in the kitchen. That means those two tasks cannot proceed simultaneously unless you add another worker.
Alternatively, you might be able to speed up the project by bringing in a second excavator when you are doing site preparation. These considerations and decisions are part of the process of translating your work breakdown structure into a Gantt chart.
After making these resource plans, estimate how long each activity will take. The time between the start and end is called the duration. You can use various estimating techniques, such as the program evaluation and review technique (PERT). For example, a project manager might estimate nine working days to install the living room floor, including both active work and drying time.
Step 5: Build the Gantt Chart
Now, you can move on to building the Gantt chart. You can use software to simplify this process, but a spreadsheet will work too. Alternatively, you can learn how to build a Gantt chart in Microsoft Word, or find pre-built, free Gantt chart templates in Microsoft Word or Microsoft PowerPoint.
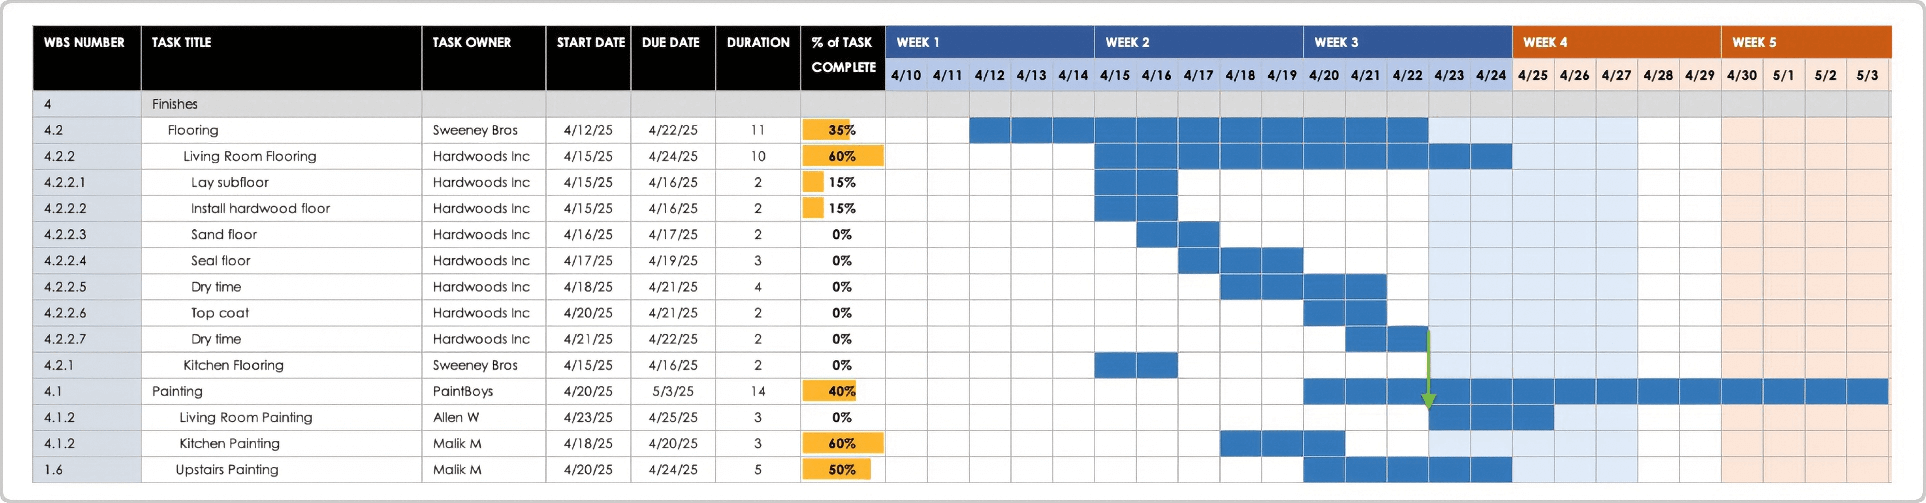
Enter each task on its own row. Assign one column for each day in the project lifespan. (For long-term projects, you may decide to use weeks or months.) Starting with the first task, shade in the cells across the row for each day you expect that activity will take place.
If you draft the Gantt chart manually, reflect the WBS hierarchy in your row arrangement to make it easier to view the project overview. To do this, label a header row with the name of the work package. (In the house example, one header row would be called finishes.) Underneath that, insert and indent child rows for the next level of breakdown: paint, flooring, and fixtures.
Indent or color-code the rows beneath each child row for component activities, such as laying the living room flooring. You can continue adding and indenting rows to break down the tasks more, but too much detail makes the chart hard to grasp.
One advantage of project planning software is the ability to roll up the hierarchies and view the information in different ways. For example, you would be able to see summary views of the finishing activities or flooring activities. The column shading, which shows duration, pulls in the durations of the child tasks and reflects the start and end of all summarized tasks.
As you build up the Gantt chart, the areas of shading move to the right. This change illustrates that when you finish a task, the project progresses to the next activity and time elapses. Shading picks up in another row in the columns for the dates of the subsequent task. Any tasks that occur simultaneously will display as parallel shaded cells on the chart.
If you have tasks that have few to no dependencies, such as building a fence, you can schedule them whenever it makes sense. For the fence, this would be after site preparation, when the ground has been leveled and oversized machinery no longer needs to enter and exit the property. Tasks without dependencies do not add to the critical path.
You can also use Gantt chart software or a Gantt chart template in Smartsheet to build a chart.
Step 6: Add Dependencies
Represent dependencies with arrows between the task rows. Doing so ensures that those potential schedule complications are clear.

As Gregory Yong, Chief of UX for Convincely software, says, “Practice deploying a Gantt model and work breakdown structure that clearly visualize what's called connecting tasks, which is usually where these dependencies stall. If you don’t, these issues linger, but no one tackles them because they aren't visualized or communicated on the project's guiding chart.”
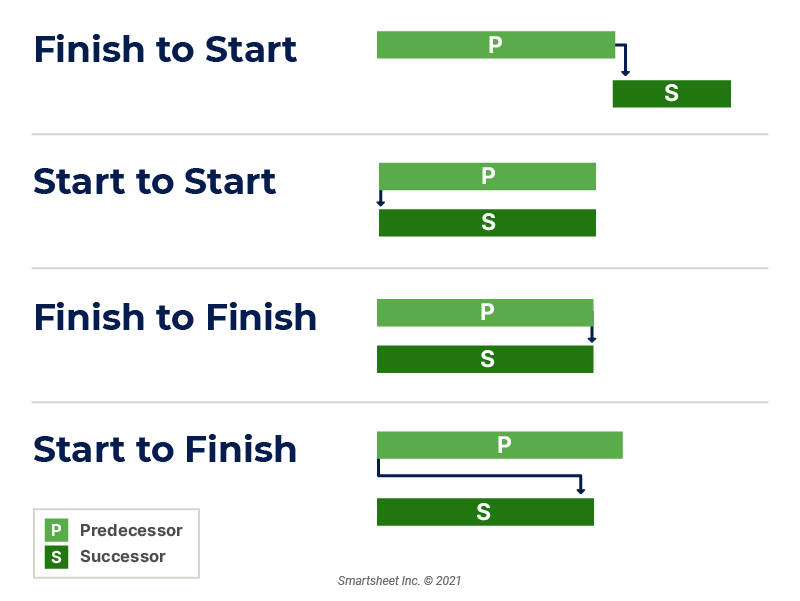
Here are the four dependency relationships between tasks in Gantt charts:
- Finish to Start: When predecessor tasks must finish before the successor can start, draw an arrow from the end of the predecessor bar to the start of the successor bar.
- Start to Start: When a predecessor must start before the successor can start, draw an arrow between the starts of both task bars.
- Finish to Finish: When predecessor tasks must complete before successor tasks can end, draw an arrow from the end of the predecessor bar to the end of the successor bar.
- Start to Finish: When the predecessor must begin before the successor can end, draw an arrow between the start of the predecessor bar and the end of the successor bar.
Once you’ve entered all the tasks, you’ll see the project’s critical path and duration. This is the amount of time between the start of the first task and the completion of the last task.
Step 7: Consider Buffers for Activities
Experienced planners know to expect the unexpected. Surprises can include key staff sickness or delayed supplies. These incidents increase the likelihood of project delays.
Planners can build in buffers to allow for these unpredictable events. You can add this extra time to existing activities or include placeholders to account for the time but don’t represent actual work. You can color-code these buffers to make them visible.
In general, the client will want the project to be completed as soon as possible, since longer durations increase cost and delay the payoff. This adds pressure to minimize buffers; right-sizing buffers requires balancing pragmatism and efficiency.
Example Template of Work Breakdown Structure Converted to a Gantt Chart
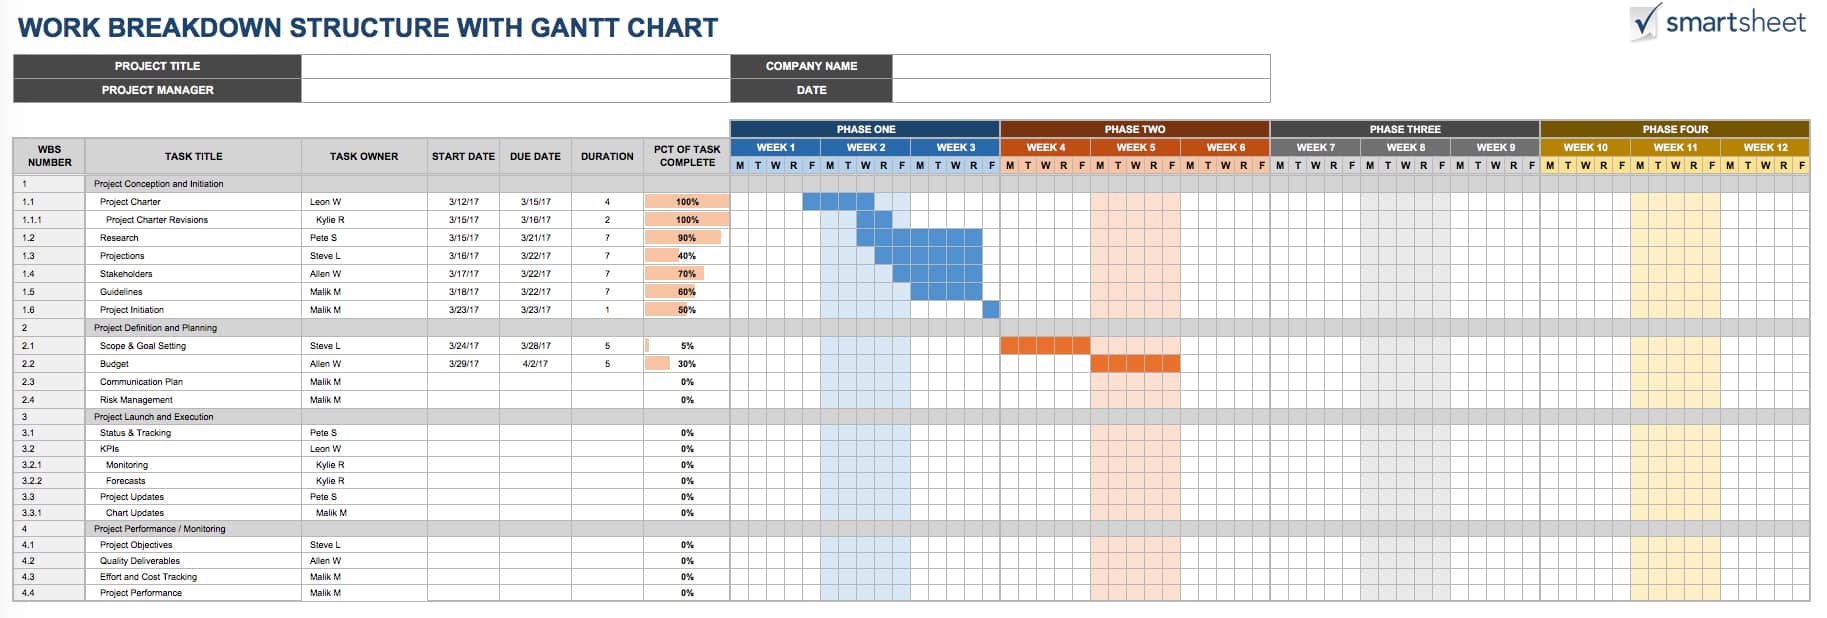
Download Blank and Sample Versions of the WBS-to-Gantt-Chart Template for Excel
When to Use This Template: Use this template when you need to convert a WBS into a Gantt-style timeline. It’s especially helpful for organizing activities, estimating durations, and mapping dependencies so you can see how tasks fit together.
Notable Template Features: This template includes a WBS hierarchy, rows for activities, and columns for duration. It also provides space for notes on the tasks within each work package. To see how information connects to form a timeline, navigate to the example tab.
Check out these project management charts for more useful documents and information.
How to Convert a Gantt Chart to a Work Breakdown Structure
Although some project planning software might convert a Gantt chart to a WBS, this isn't typically recommended. A proper WBS should focus on deliverables, not tasks. For example, list project outcomes such as final drafts in the WBS, and leave activities such as writing in the Gantt chart.
Applications that seek to perform this function do not list concrete results, and instead list activities in the work breakdown structure. Remember, each level of the work breakdown structure should show what is being built or accomplished, not the activity.
Thus, a work breakdown structure for a content marketing campaign should list blog content at the top of the hierarchy as the intended project result. Then, categorize the deliverables into content calendar, first drafts, edited drafts, imagery, and posted content. The related Gantt chart would assign rows for activities: brainstorming, scheduling, writing, editing, graphic design, and uploading. While outcome and process are related, they are not the same.
While you might create a Gantt chart that shows the work breakdown structure in a different tab (as in the above example), professionals say it’s hard to imagine a circumstance in which you want to convert a Gantt chart to a work breakdown structure. This would only have value if you did not know the end or component results. But this is unlikely because teams generally do not embark on projects without goals.
You can find templates for tracking multiple projects with Gantt charts, including budget and dependencies, in our template roundup for Gantt charts for multiple projects.
How to Make Sure Your Work Breakdown Structure and Gantt Chart Are Accurate
Your WBS and Gantt charts are useful only when they are accurate. Accuracy is hard to achieve early on, when you have less information. To maximize accuracy, continually add new information to your plans as the project progresses.
Experts advise that open communication, flexibility, and frequent reviews aid accuracy. Here are some tips:
- Communicate: Hirsch from TalentMarketplace says that staying in contact with other project stakeholders and gathering their input is vital. “Communication with project experts is key. As a project manager, you understand every component of the project, but you may not understand the details of every component. Speaking to your employees and providing them with the resources they need to record their tasks is essential,” he says.
- Stay Flexible: Albert Ho is the Founder of Healthcare Heroes and a project manager at William Osler Health System in Brampton, Ontario. He notes, “A project manager will never have all of the information needed to understand dependencies and determine durations at the beginning of a project. As new information is revealed, the project manager must support the project team.” He cites an example of unexpectedly needing to incorporate telehealth appointments into a project: “This was a net-new request that required eight weeks to obtain a quote, design a solution, implement, test, train, and deploy.” Stakeholders had to be flexible to adapt the project to the changed scope.
- Review Your Work Often: Yong encourages weekly project team meetings for participants to review the WBS and Gantt chart. “It's the clearest and quickest way to go over the team's progress, clarify any stalling dependencies, and add new micro tasks,” he notes. Ramirez of Rephrase says the project manager should review the work breakdown structure and Gantt chart at the end of every day to ensure that they have assigned the tasks properly. Additionally, the project manager should look at the timeline and Gantt chart at the beginning of each week to ensure that the tasks are being completed on time. “Otherwise, the project manager will need to update the timelines if work is simply delayed. If the work was not scoped well, then the work breakdown may need to change in order to accurately reflect the new scope of the project,” he adds.
Drive Project Success With Smartsheet for Project Management
From simple task management and project planning to complex resource and portfolio management, Smartsheet helps you improve collaboration and increase work velocity -- empowering you to get more done.
The Smartsheet platform makes it easy to plan, capture, manage, and report on work from anywhere, helping your team be more effective and get more done. Report on key metrics and get real-time visibility into work as it happens with roll-up reports, dashboards, and automated workflows built to keep your team connected and informed.
When teams have clarity into the work getting done, there’s no telling how much more they can accomplish in the same amount of time. Try Smartsheet for free, today.

FAQ: WBS and Gantt Charts
Yes, it’s possible to make a Gantt chart without first doing a WBS, but it’s not efficient or advisable. The WBS is typically your first step in creating a project schedule, and skipping it can lead to missing tasks and dependencies, as well as scope issues.
Purely Agile teams don’t use Gantt charts or traditional WBS, which are closely associated with Waterfall. Agile planning uses backlogs and iterative sprints. However, some teams in hybrid environments use Gantt charts to visualize timelines or dependencies alongside Agile sprints.
For most small teams, a Gantt chart is a better choice than a WBS. It’s easier to build, helps track deadlines, and shows task timing clearly. A WBS adds value for complex projects, but many small teams can plan effectively without creating one. Just be careful not to miss any deliverables.
Yes, WBS and Gantt charts are useful for any project. Nontechnical teams such as event planners or marketing teams use WBS to break down deliverables and Gantt timelines to schedule work. These tools make it easier to see the big picture while keeping track of smaller tasks.