Article
Gantt Chart vs. Project Timeline: Key Differences Explained
Learn when to use Gantt charts, when to use project timelines, their key differences, and how to use them together in project management. Also find expert tips, a downloadable cheat sheet, and a decision tree.
What Is a Project Timeline?
A project timeline is a linear visual map of a project with all the tasks, phases, and deadlines laid out from start to finish. Visualizing all tasks in chronological order gives you a bird’s-eye view of the entire project.
How Gantt Charts Expand on Timelines
While timelines show the overall sequence of tasks, Gantt charts expand on them by showing task relationships and dependencies, illustrating which tasks must be complete before the next can start. This provides a more detailed view of the timeline.
For example, a project timeline might show that a building’s stairs will be constructed during a certain phase of the project, but a Gantt chart would show the dependencies: The foundation must be complete, the supporting structures have to be built, the materials need to be delivered to the job site, and then construction can begin on the stairs. Read this Gantt chart guide to learn more.
“While timelines are a great way to see how your project(s) will progress over time, Gantt charts provide a visual waterfall view to show where tasks overlap, what tasks are in the critical path, what tasks are dependent on each other, and how everything is affected if something needs to be adjusted.”
— Monique Odom-Stearn, Architecture Solutions Manager at Comcast
Gantt Chart vs. Timeline Feature Comparison
Project timelines are best used to provide the project with a roadmap, while Gantt charts provide a more detailed view of the project timeline, showing task dependencies. Gantt charts can be edited and updated daily to reflect the tasks’ status; they can automatically move tasks as they are updated.
| Timeline | Gantt Chart | |
|---|---|---|
| View | The timeline provides an overall, bird’s-eye view of tasks, deadlines, and project phases with dates. It shows a picture of the project from start to finish. | The Gantt chart shows tasks, deadlines, and project phases, but it also provides a more detailed view of daily tasks. It shows how these tasks are sequenced and connected through dependencies. |
| Frequency of Updates | As a general project roadmap, the timeline is typically updated less frequently. | In a Gantt chart, project tasks and dependencies can be moved and updated in real time. |
| Capacity Planning | When capacity planning, use a timeline to map out general milestones and deadlines for a broad audience, such as stakeholders and senior leadership. | Use a Gantt chart for capacity planning that involves more detailed resource allocation and dependencies. |
| Resource Management | Use a timeline when doing resource management for simpler projects, brainstorming, and projects without dependencies. | Use a Gantt chart when doing resource management for complex projects with multiple resource allocation dependencies to better track progress. |
| Risk Management | When carrying out risk management, use a timeline for drafting and ideating your plan, as well as identifying major risks. | When carrying out risk management, use a Gantt chart for more detailed analyses and risk projections. |
Download the Gantt Chart vs. Timeline Feature Comparison Cheat Sheet for Adobe PDF
When to Use a Gantt Chart Over a Timeline
A Gantt chart is more practical than a timeline when you want to have a detailed roadmap of daily and weekly tasks, rather than just a high-level overview of milestones. Use it when you need to edit task deadlines in real time as the project evolves.
For example, if your window frame supplies for a building project don’t come in on time, you have to change the deadline for that phase of the project. In this case, a Gantt chart is useful because it automatically shifts the deadline for the next phase of the project: putting in the window panes.
Gantt charts are best used as the backbone for large projects. “Gantt charts are the classic tool for managing projects with a linear, sequential flow, which is very common in large-scale telecom infrastructure projects.”
— Ipshita Mukherjee, Senior Technical Project Manager at Verizon
According to Mukherjee, Gantt charts are good for setting baselines. “Setting a baseline in your Gantt chart, you can easily compare your planned schedule with the actual progress. This is invaluable for reporting to senior leadership and identifying where projects are deviating from the initial timeline and budget,” she says.
Mukherjee says Gantt charts are also useful for resource management: “In a large company, a single technician or team might be assigned to multiple projects,” she says. “Use the Gantt chart to visualize resource allocation and identify potential overallocation or underutilization, ensuring your workforce is being used efficiently.”
Explore more: Gantt Chart Templates
When to Use a Timeline Over a Gantt Chart
You would use a timeline over a Gantt chart when you want to show the broad strokes of a project, including high-level phases and objectives. For example, you want to present your project idea to a board of investors or are introducing the plan at project kickoff.
Mukherjee suggests using the Timeline view as a high-level roadmap. “The Timeline view is a powerful visualization for providing a high-level overview of projects and portfolios, perfect for communicating with executives and stakeholders,” she says.
She also suggests using it to visualize multiple projects, highlight key milestones, and pull important information for stakeholders. “Use the grouping and filtering features to customize the view for specific audiences,” she says. “For example, you can group projects by business unit, product line, or geographical region to show how projects are progressing in a specific area. This provides a tailored and relevant overview for different stakeholders.”
Explore more: Project Timeline Templates
Use this timeline or Gantt chart decision tree for Adobe PDF to help you decide when to use a Gantt chart or timeline for your project.
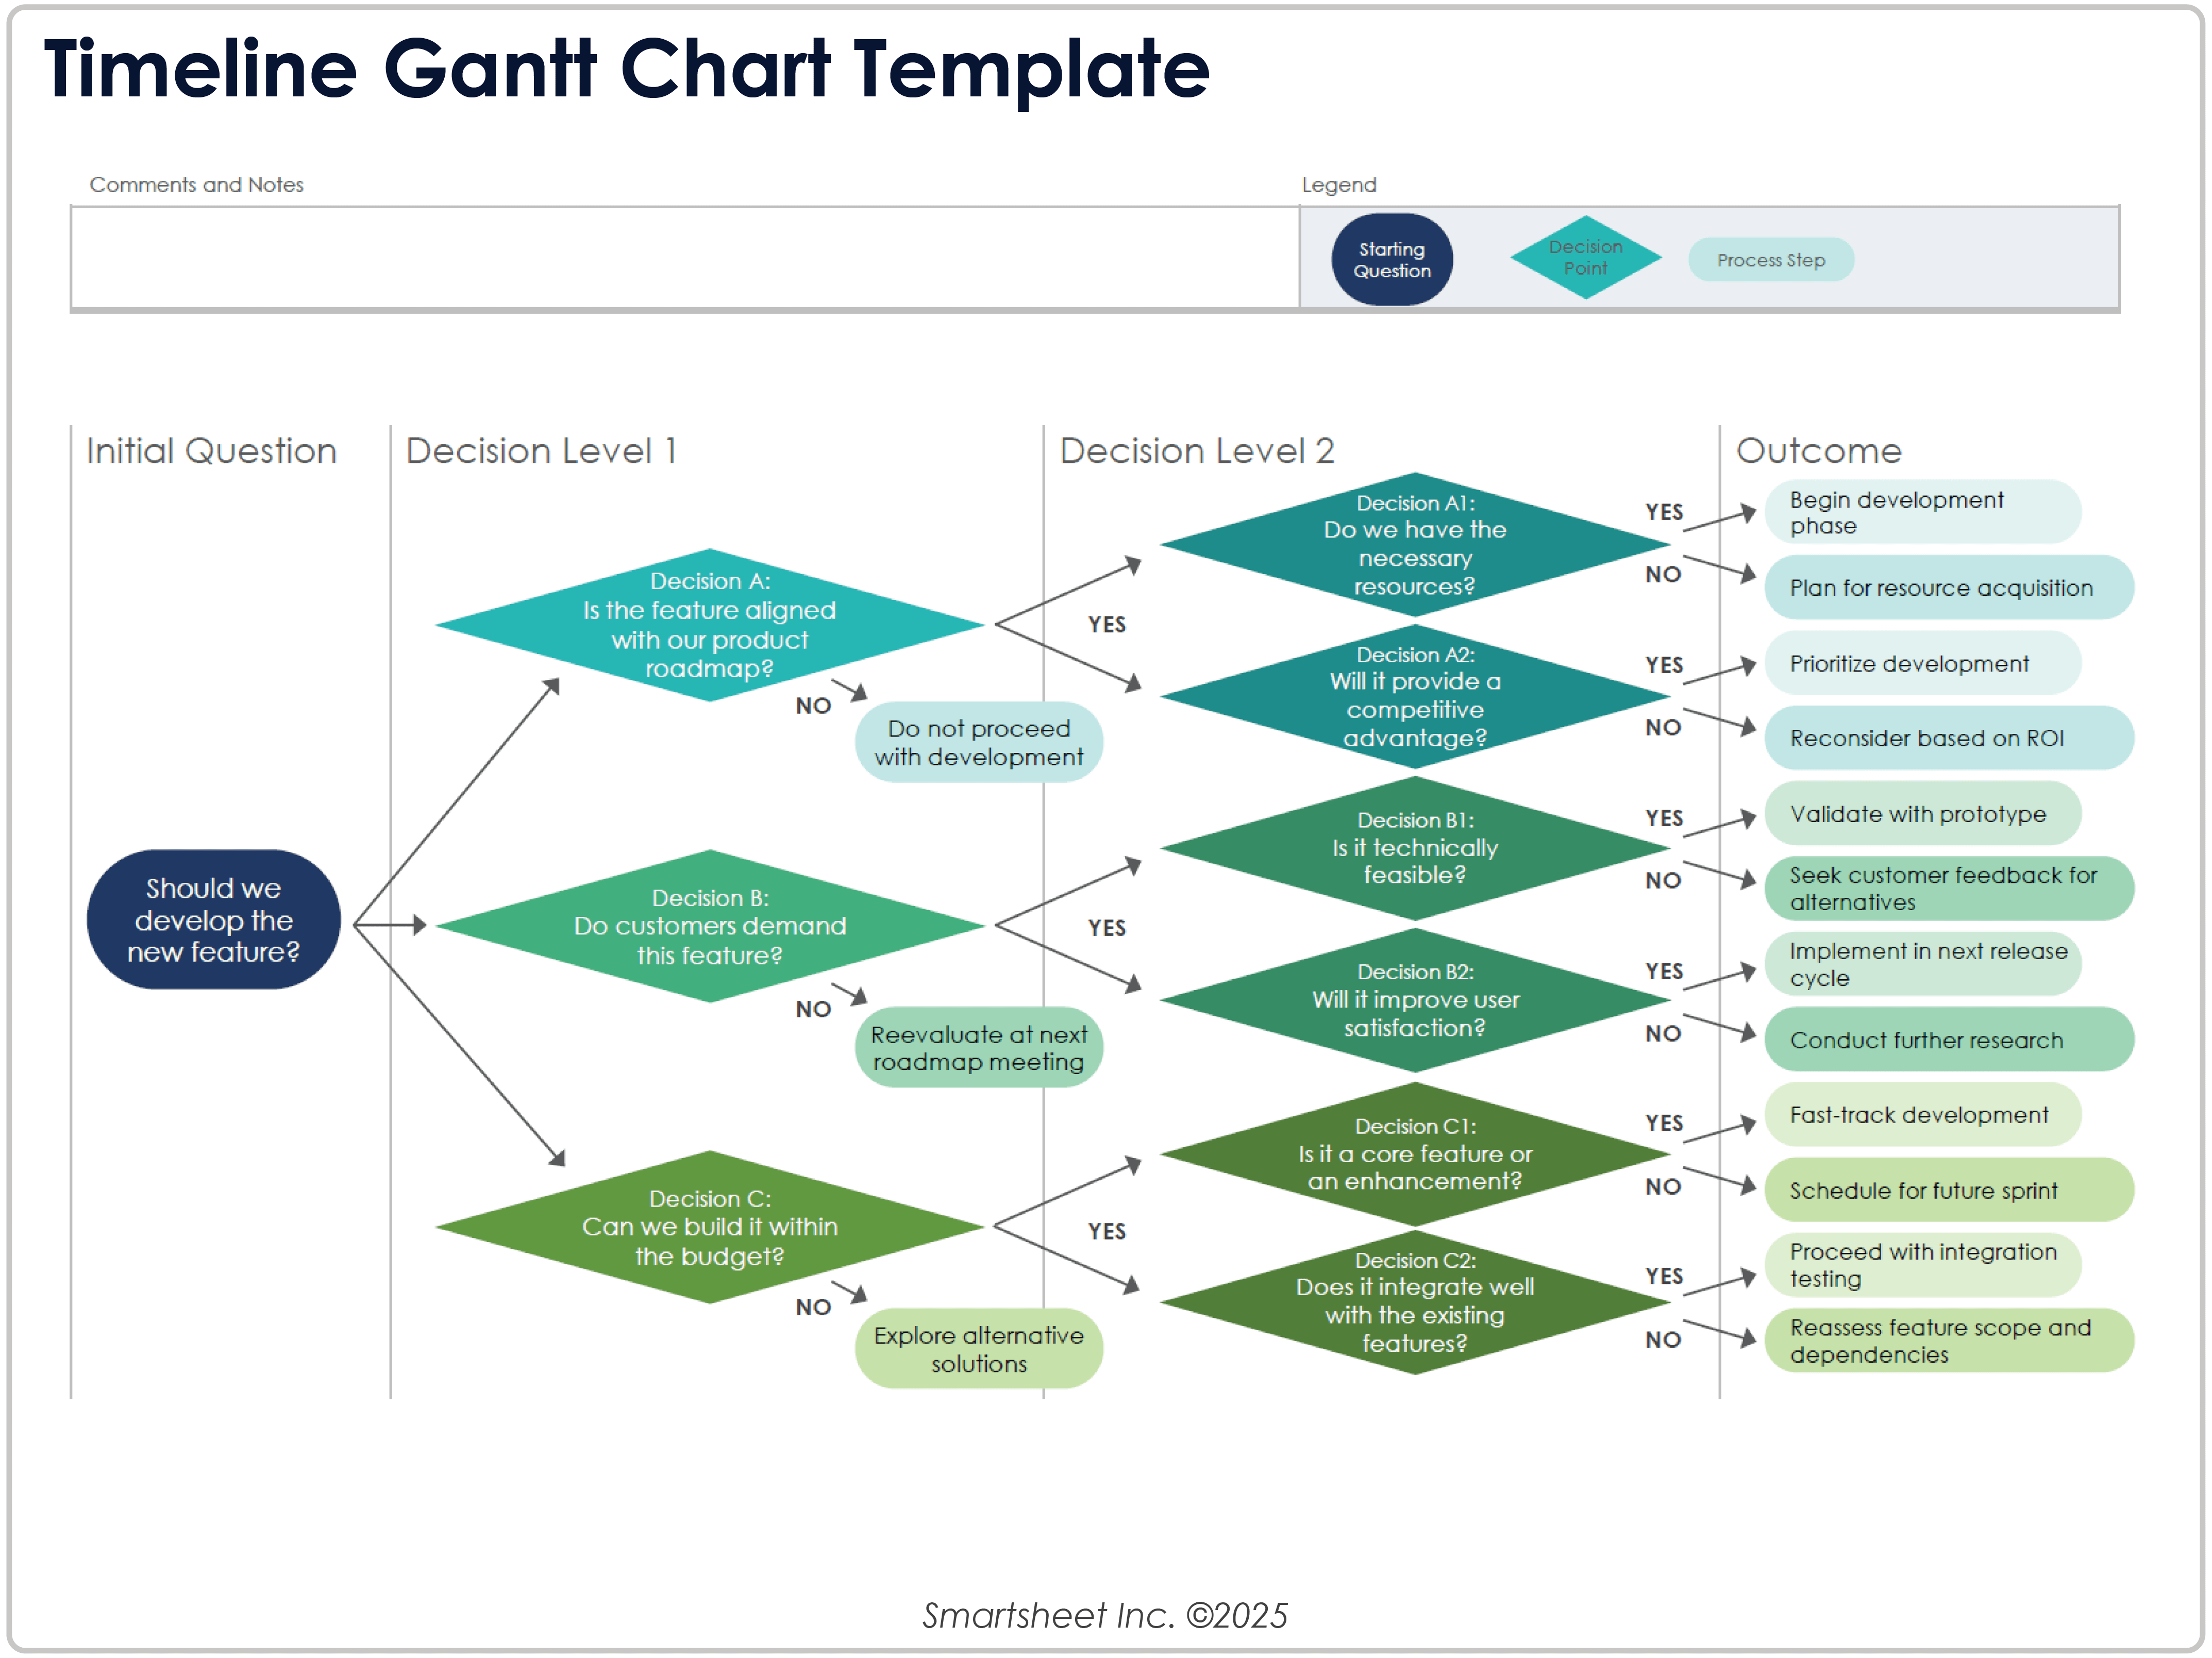
Download the Timeline or Gantt Chart Decision Tree for Adobe PDF
Using a Hybrid Approach
You can use a timeline and a Gantt chart together for a hybrid approach. The timeline helps you view the big picture, which is more useful when communicating with higher-level stakeholders. The Gantt chart helps you communicate within your teams and across teams, editing and moving deadlines as necessary.
For example, in a construction project, building a house can be mapped on a timeline into different phases of flooring, electric wiring, and plumbing. The Gantt chart would organize the specific resource dependencies and deadlines that need to be met at each phase before the next phase can start.
For a software development project, use a timeline to separate the project into phases such as development, testing, and product launch. Use the Gantt chart to divide those phases into smaller tasks and human resource allocation dependencies.
| With Smartsheet software, you can toggle between both Timeline view and Gantt view. Learn how to create a Gantt chart in Smartsheet and get started with this Gantt chart software. |
FAQs Gantt Charts vs. Timelines
Are Gantt charts and timelines the same thing?
Gantt charts and timelines are similar but not the same. A Gantt chart is a more detailed form of a timeline that places tasks as dependent on one another’s deadlines. A timeline is a basic linear layout of the tasks and deadlines.
Can you convert a project timeline into a Gantt chart?
Yes, you can convert a project timeline into a Gantt chart. First, input the information from your timeline into a software that creates Gantt charts. Then add all the information that a Gantt chart requires, such as durations and dependencies.
To switch from a Smartsheet Timeline view to a Gantt view, click the drop-down menu next to View in the toolbar and select the Gantt view. Learn more about choosing the best sheet view for your data.
Which is better for small teams?
For small teams, Gantt charts are better than timelines. Each team member needs to know every daily task required for the project, as well as any real-time updates. Gantt charts provide this information and can be shifted based on project progress.
The Smartsheet AI-powered platform revolutionizes how you manage projects, portfolios, and processes, empowering organizations to innovate, collaborate, and achieve results at scale with enterprise-grade security.


