Multi-Project Tracking Template
Download a Multi-Project Tracking Template for
Excel
| Google Sheets
When to Use This Template: You can use this template when you need to manage several projects at once. The template enables you to track tasks, owners, deadlines, and budgets across different workstreams while keeping an overall view of program progress.
Notable Template Features: This template captures project details such as task descriptions, owners, deliverables, costs, and hours, and you can use it to set priorities for each task. You can update the status and percent complete as work moves forward. This Gantt chart displays your project schedules based on your chosen start and end dates, giving you a clear visual of timelines and progress.
For more options, explore our full collection of Gantt chart templates for Excel to find formats that fit any project size or style.
Multiple Project Gantt Chart With Dependencies
Download a Multiple Project Gantt Chart With Dependencies
Excel
| Google Sheets
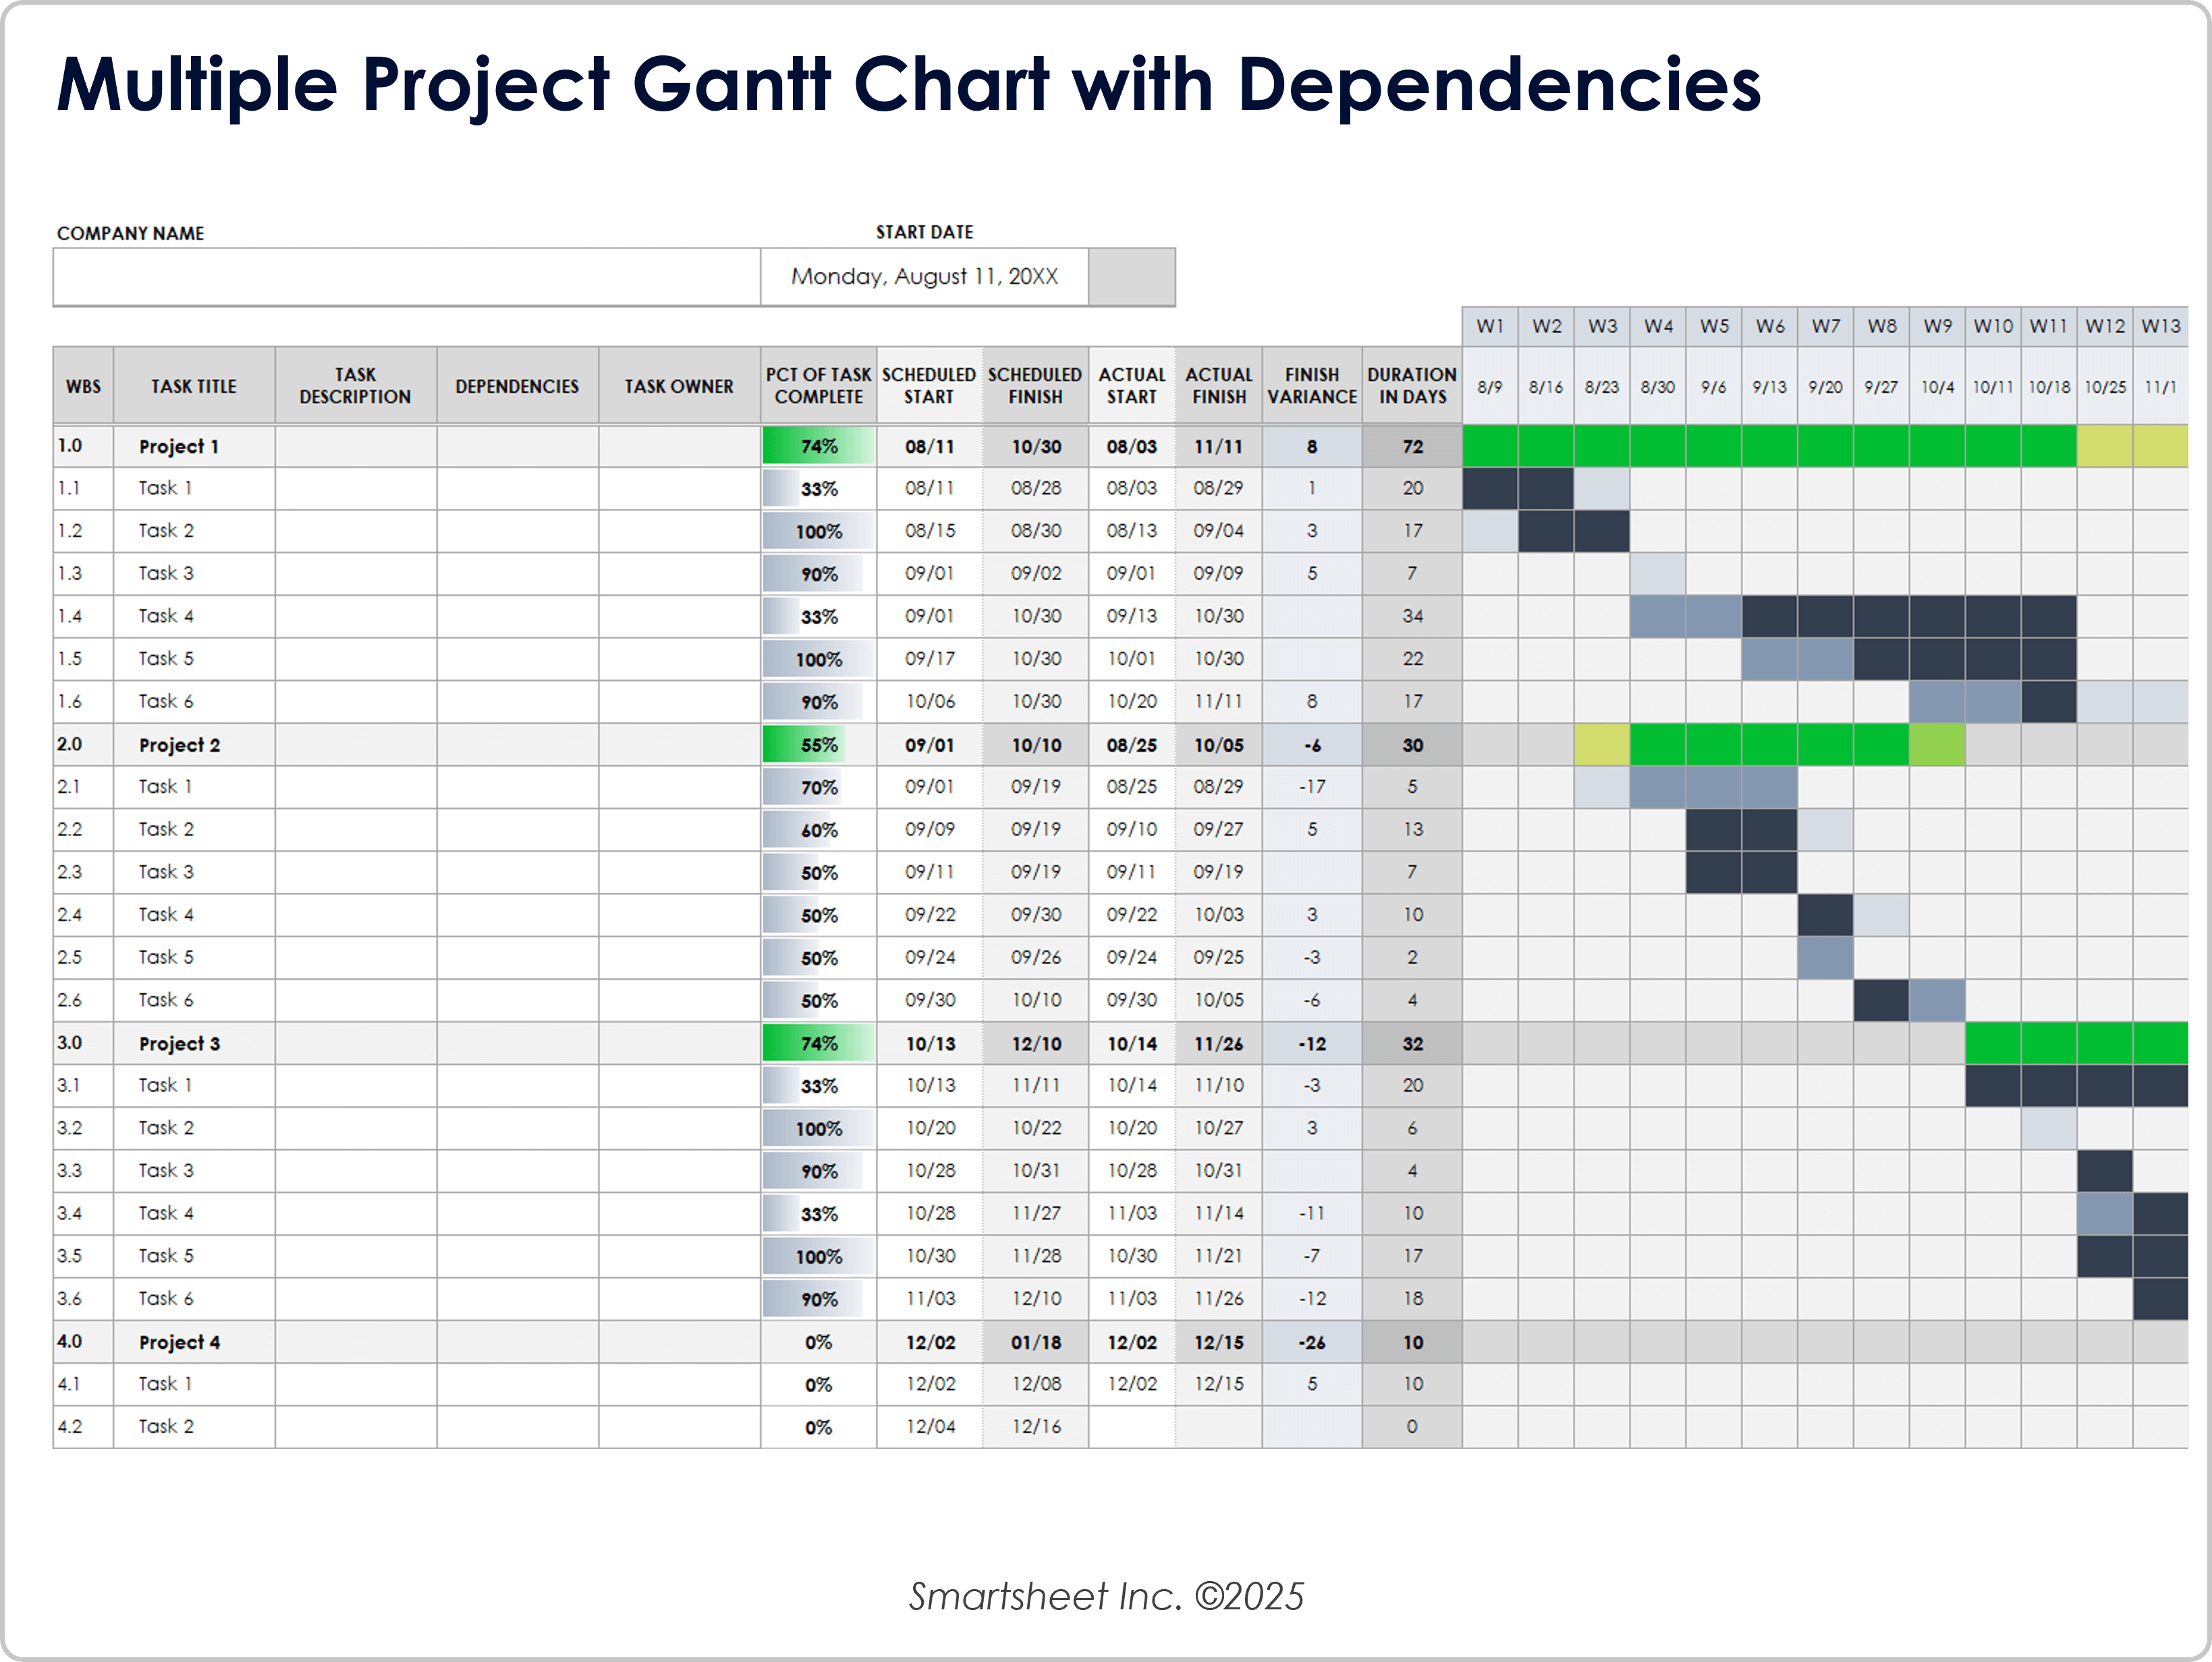
When to Use This Template: This template is ideal for tracking multiple projects with complex schedules, clear task dependencies, and a visual timeline. It helps you monitor progress closely when tasks are linked.
Notable Template Features: The template creates a Gantt chart automatically from your project data, showing the duration of each task, along with owners, dependencies, and completion percentage. A built-in work breakdown structure helps you organize tasks for each project. The first tab includes sample data to show how it works, and the second tab is ready for your own project information.
If you need more options, check out our full set of Gantt chart templates with dependencies for detailed scheduling and task management.
Multiple Project Budget Gantt Chart Template
Download a Multiple Project Budget Tracking Template for
Excel
| Google Sheets
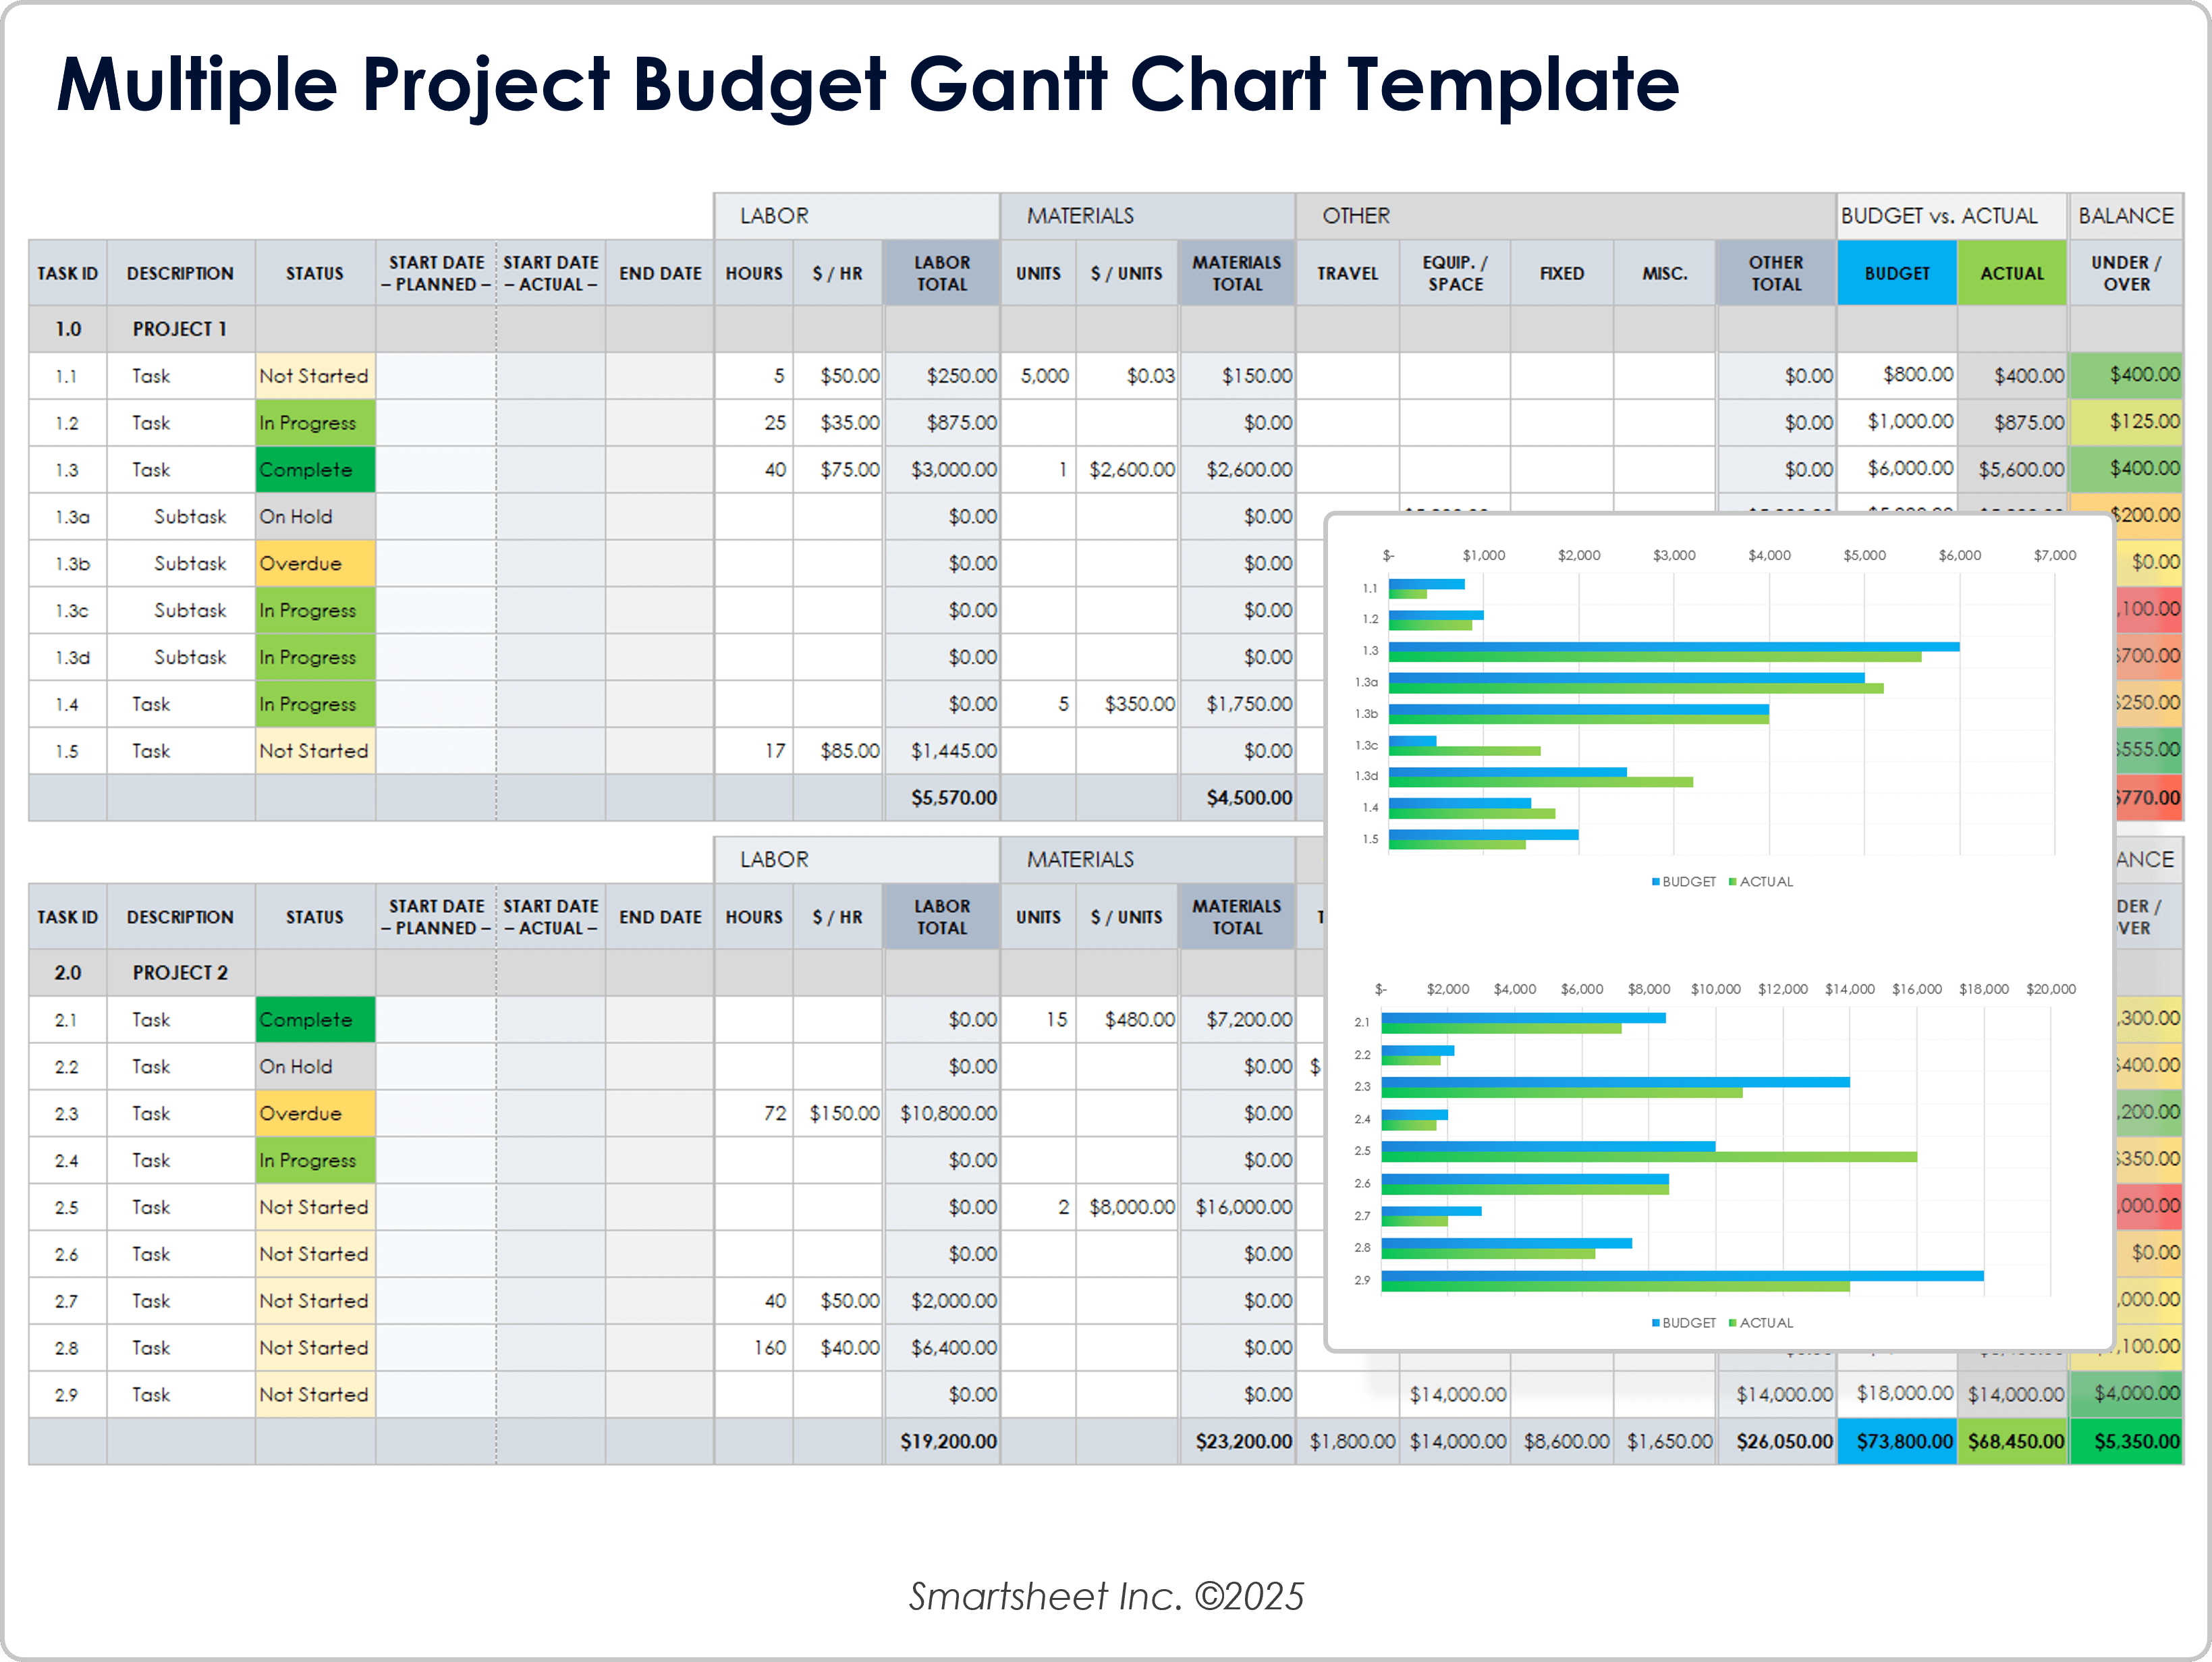
When to Use This Template: When you need to keep a close eye on expenses, timelines, and task progress simultaneously, this template is your top choice. It helps you track schedules and budgets for multiple projects.
Notable Template Features: This template combines task tracking with detailed budget management, showing start and end dates, current task status, and itemized expenses for each project. It also displays estimated and actual costs directly on the Gantt chart, making it easy to compare spending against projections as work moves forward.
Learn more about how to use and customize these charts in our complete Gantt chart guide.
Monthly Multi-Project Gantt Schedule Template
Download Monthly Multi-Project Gantt Schedule Template
Excel
| Google Sheets
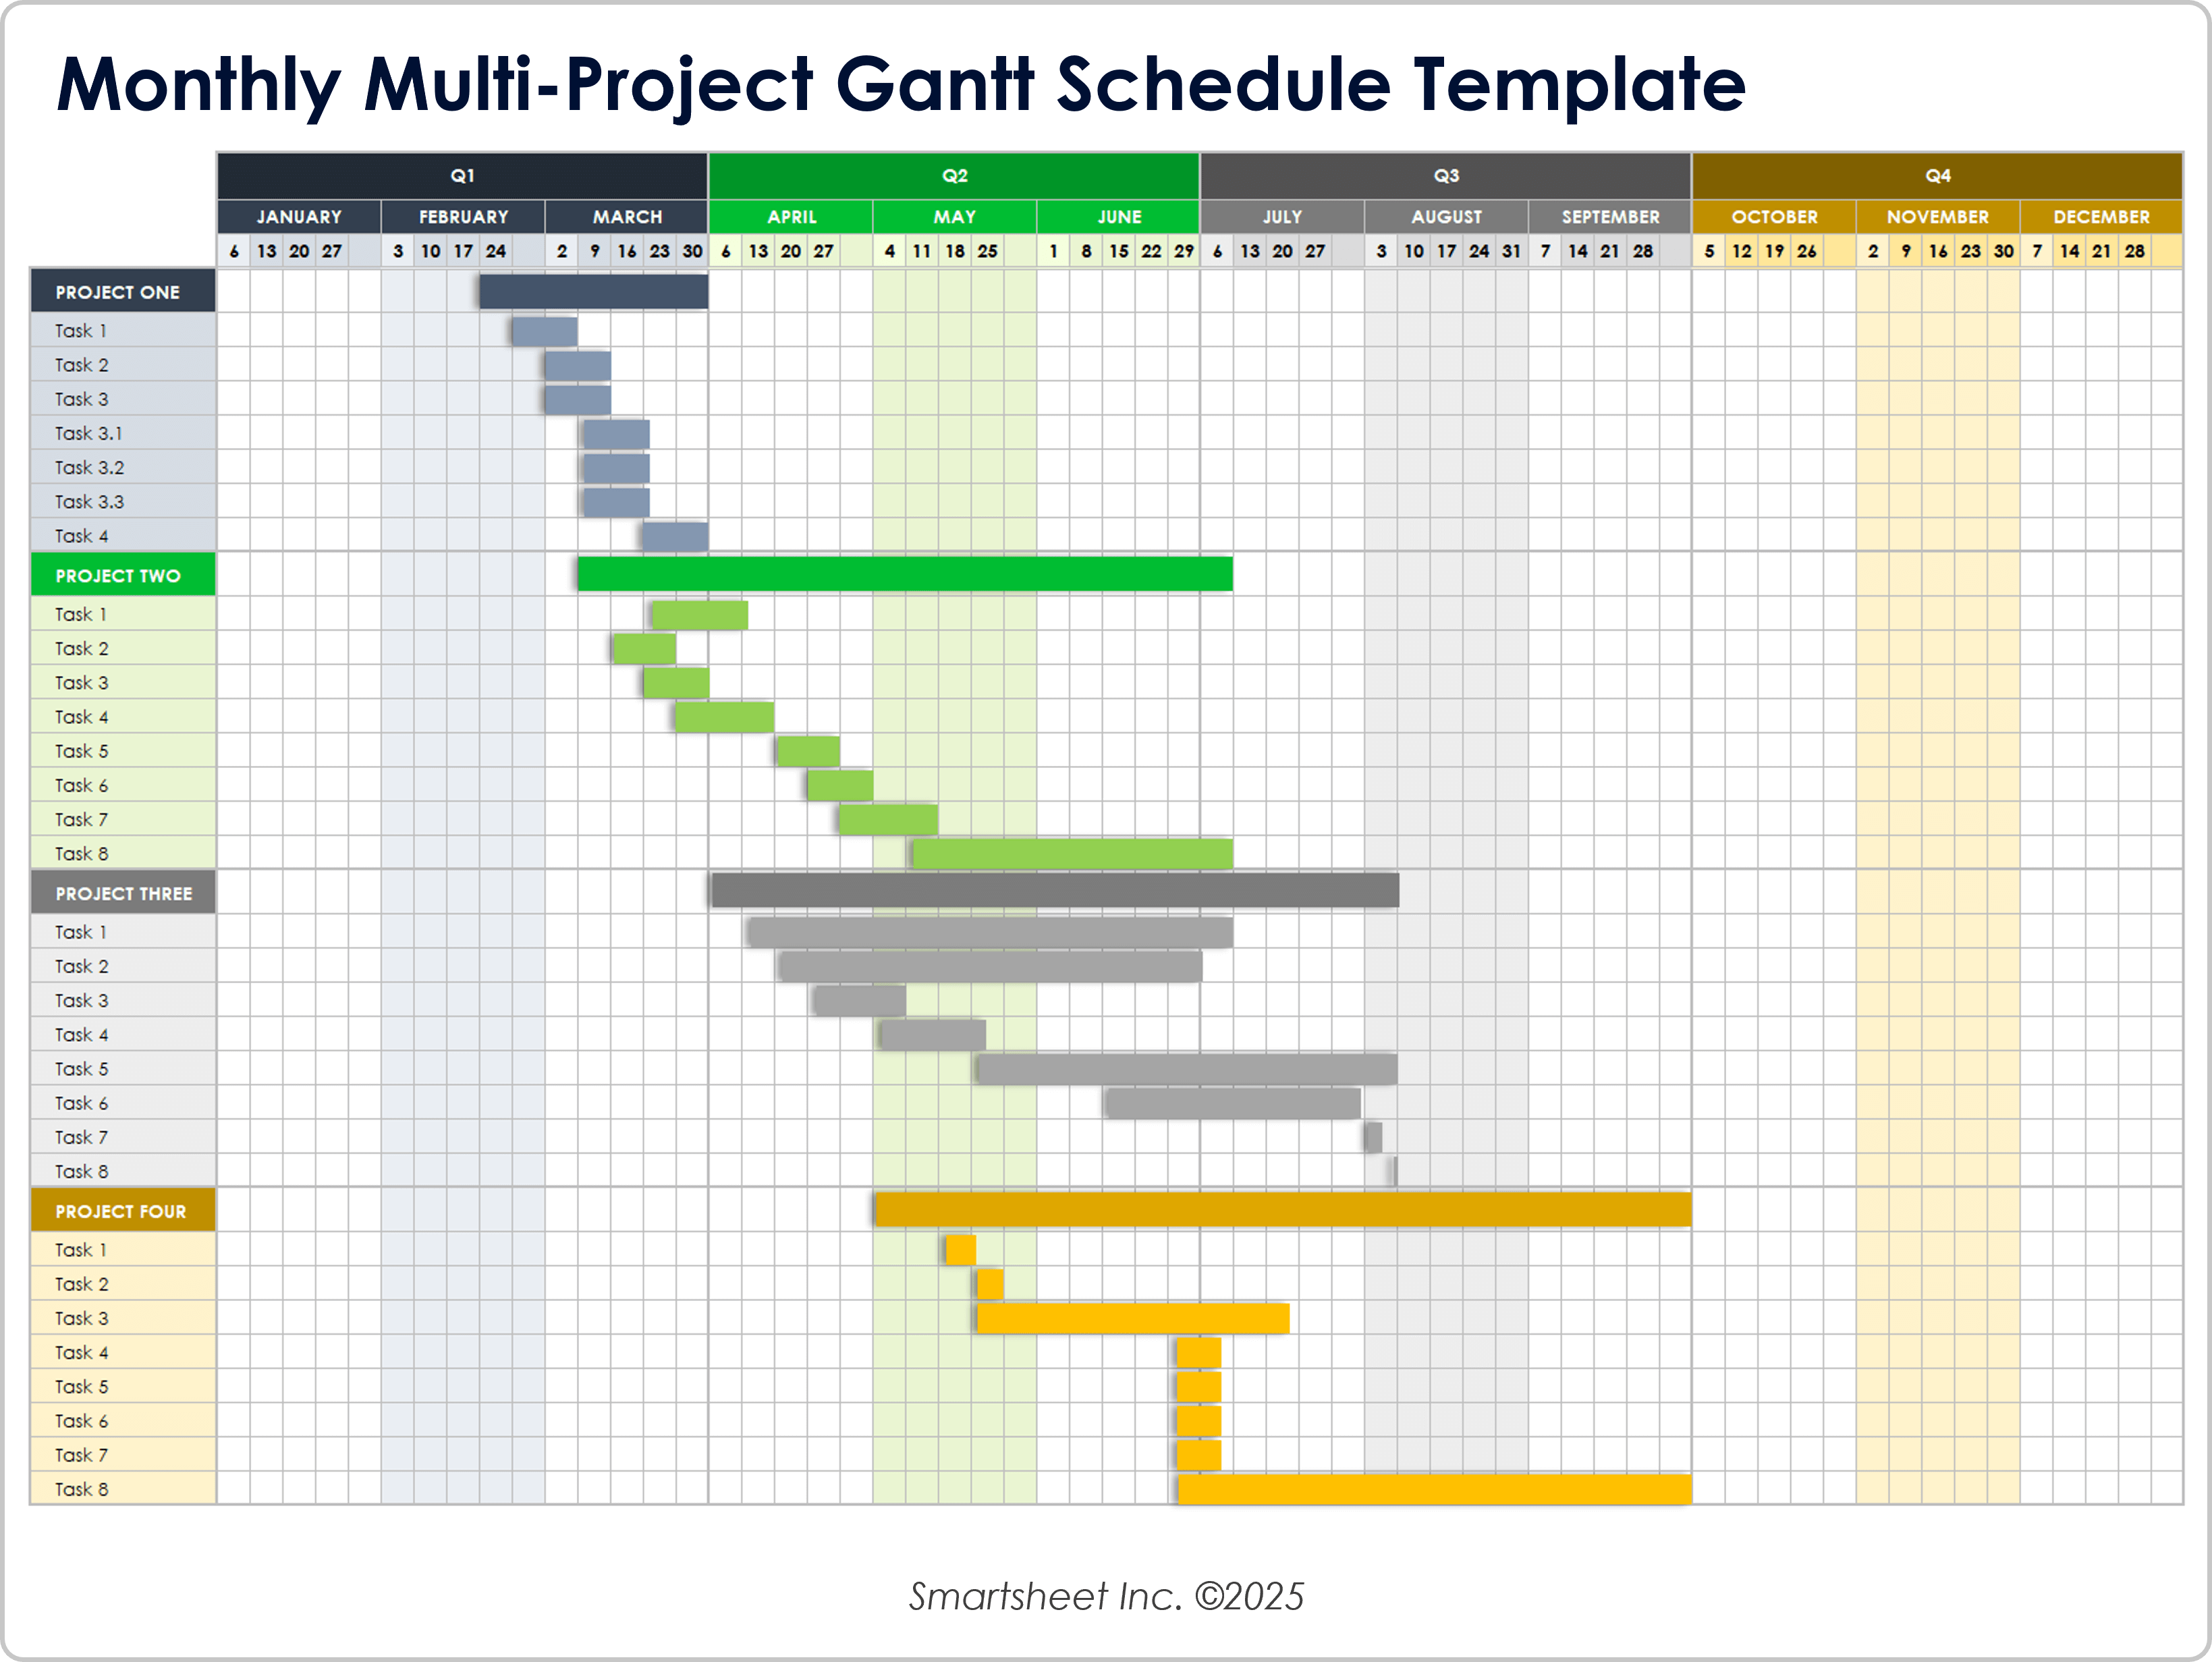
When to Use This Template: Use this template to plan and monitor monthly schedules across multiple projects when you want a clear visual of timelines without overly complex tracking features.
Notable Template Features: This template uses color-coded bars to distinguish between projects, making it easy to see timelines at a glance. You can enter activities for each project and quickly build out the Gantt chart, giving you both a detailed task breakdown and an overview of all project schedules in one place.
See these Gantt chart templates for more options.
Multiple Project Dashboard Template
Download a Multiple Project Dashboard Template
Excel
|
PowerPoint
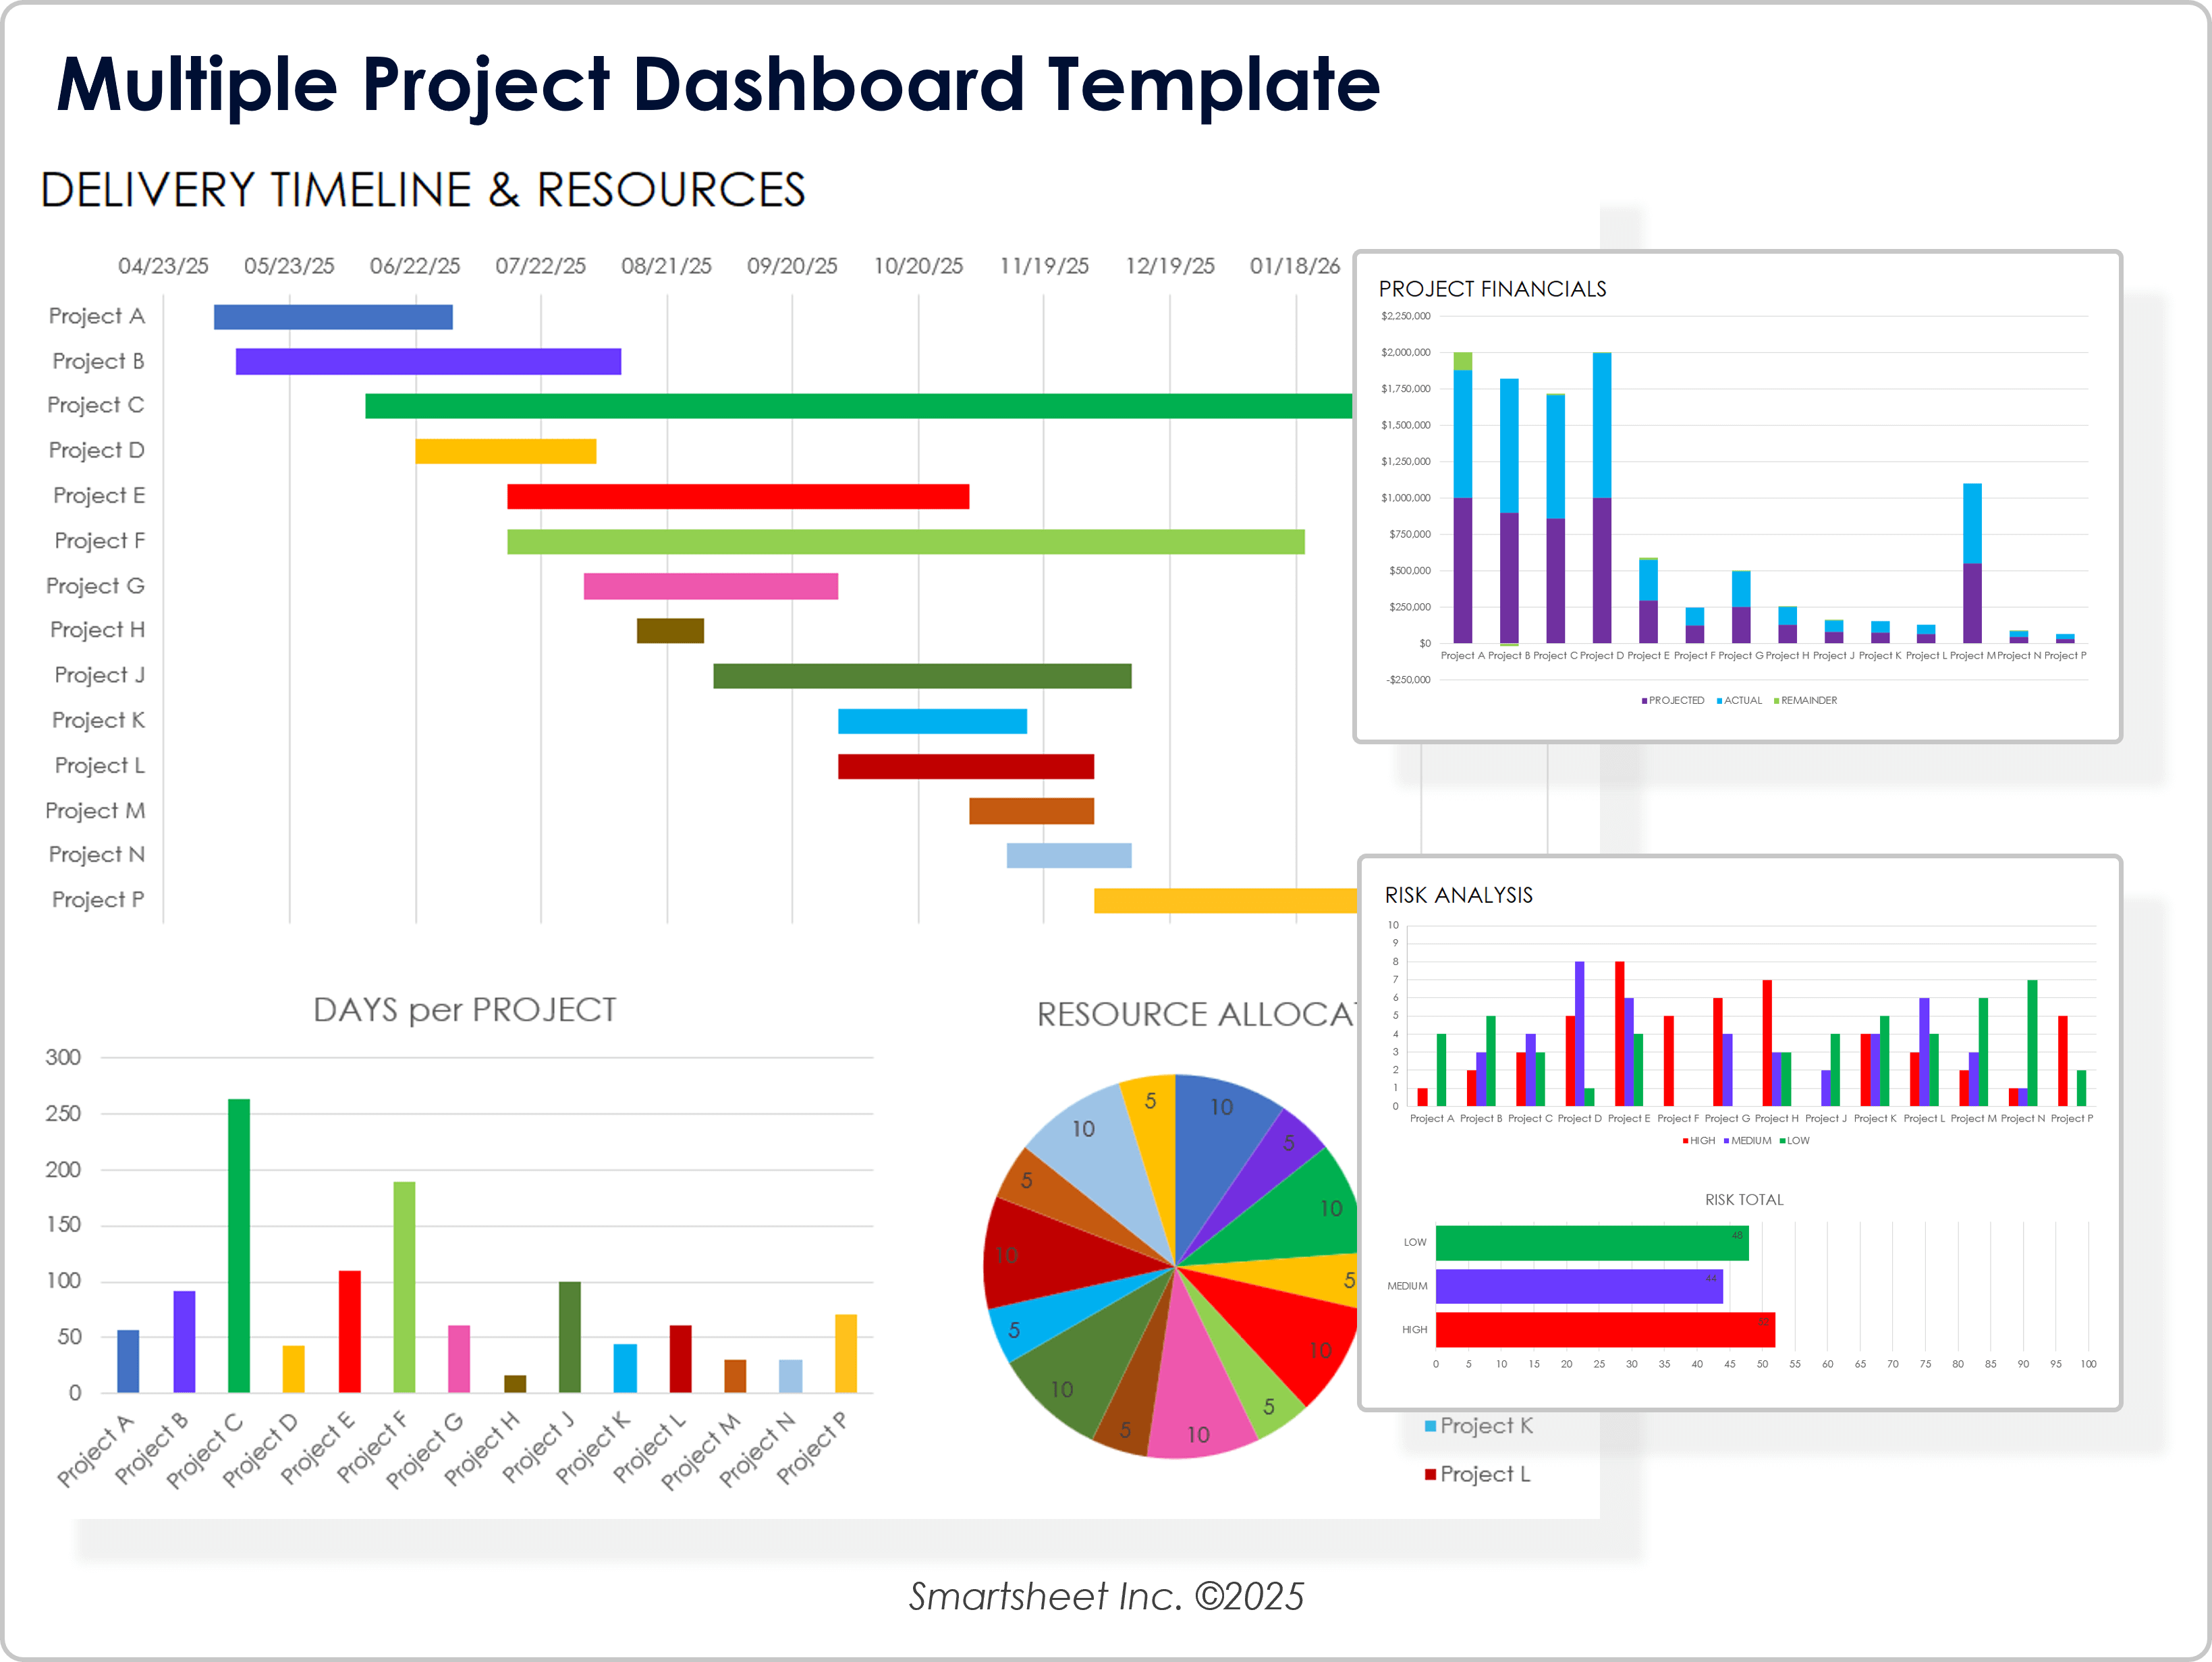
When to Use This Template: Use this template to get a high-level view of several projects at once. You can track timelines alongside financials, risks, and open issues in a single, visual format.
Notable Template Features: The template combines a Gantt chart for project schedules with bar charts that display key metrics, such as budget status, risk levels, and unresolved issues. It’s designed to give you a quick, at-a-glance summary of important data so that you can monitor progress and address challenges across multiple projects efficiently.
You can also explore our full collection of Google Sheets Gantt chart templates for flexible, shareable project tracking options.
Using a Gantt Chart to Track Multiple Projects
A Gantt chart helps manage multiple projects by providing a clear visual of tasks, dependencies, and milestones. You can use a Gantt chart to track risks, allocate resources, and monitor progress more easily. This visual approach makes it easier to coordinate work and prevent delays across all projects.
Using a Gantt chart template is a simple and flexible way to organize project information. Learn how to create a project tracker in Excel for tips on customizing and getting the most out of an Excel Gantt chart template. To find out more, get tips on how to customize and best utilize an Excel Gantt chart template.
Make Better Decisions Faster With Gantt Charts in Smartsheet
Empower your people to go above and beyond with a flexible platform designed to match the needs of your team — and adapt as those needs change.
The Smartsheet platform makes it easy to plan, capture, manage, and report on work from anywhere, helping your team be more effective and get more done. Report on key metrics and get real-time visibility into work as it happens with roll-up reports, dashboards, and automated workflows built to keep your team connected and informed.
When teams have clarity into the work getting done, there’s no telling how much more they can accomplish in the same amount of time. Try Smartsheet for free, today.
Gantt Chart for Multiple Projects FAQ
Yes, a single Gantt chart can show timelines for multiple projects. Use color coding or grouping to organize tasks. This lets you track progress, deadlines, and dependencies in one place. It improves coordination and visibility across workstreams. The Gantt charts on this page are great tools for managing multiple projects.
No, Gantt charts remain a popular project management tool. They clearly display timelines, tasks, and dependencies. Modern software makes them easier to update and share. While other methods are available, Gantt charts are still effective for planning and tracking work visually.
No, Gantt charts are simple to make. List tasks, add start and end dates, and map them on a timeline. Updates are simple once you set the structure. You can manage even complex projects with a clear, well-organized chart.
For step-by-step instructions, see our guide on how to create a Gantt chart in Excel

