Event Planning Gantt Chart Template
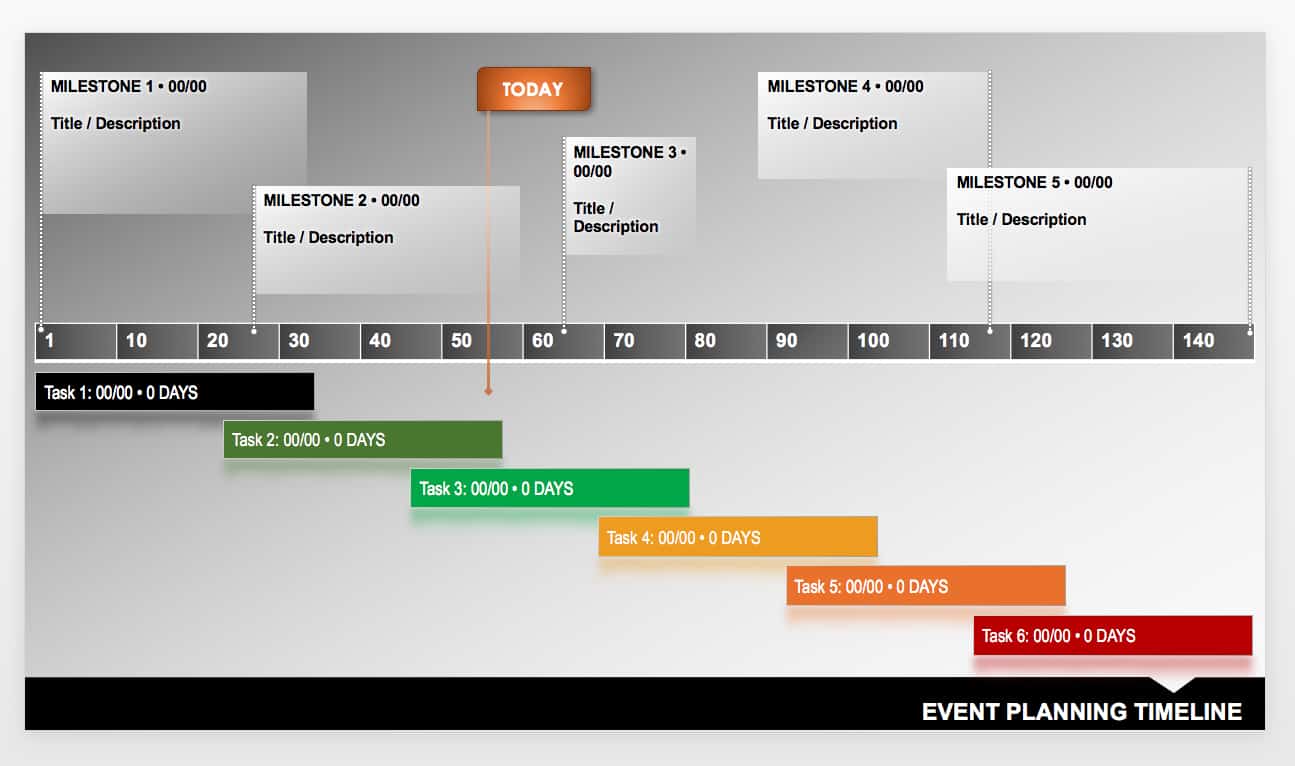
Keep your event planning on track with this PowerPoint template. This template allows you to view a breakdown of planning activities (based on the start date and number of days assigned to each task), clearly marks milestones, and provides room for descriptions and dates. The template also provides a simple, easy-to-read layout that shows important details along with a quick overview of your event planning timeline.
Project Management Gantt Chart Template
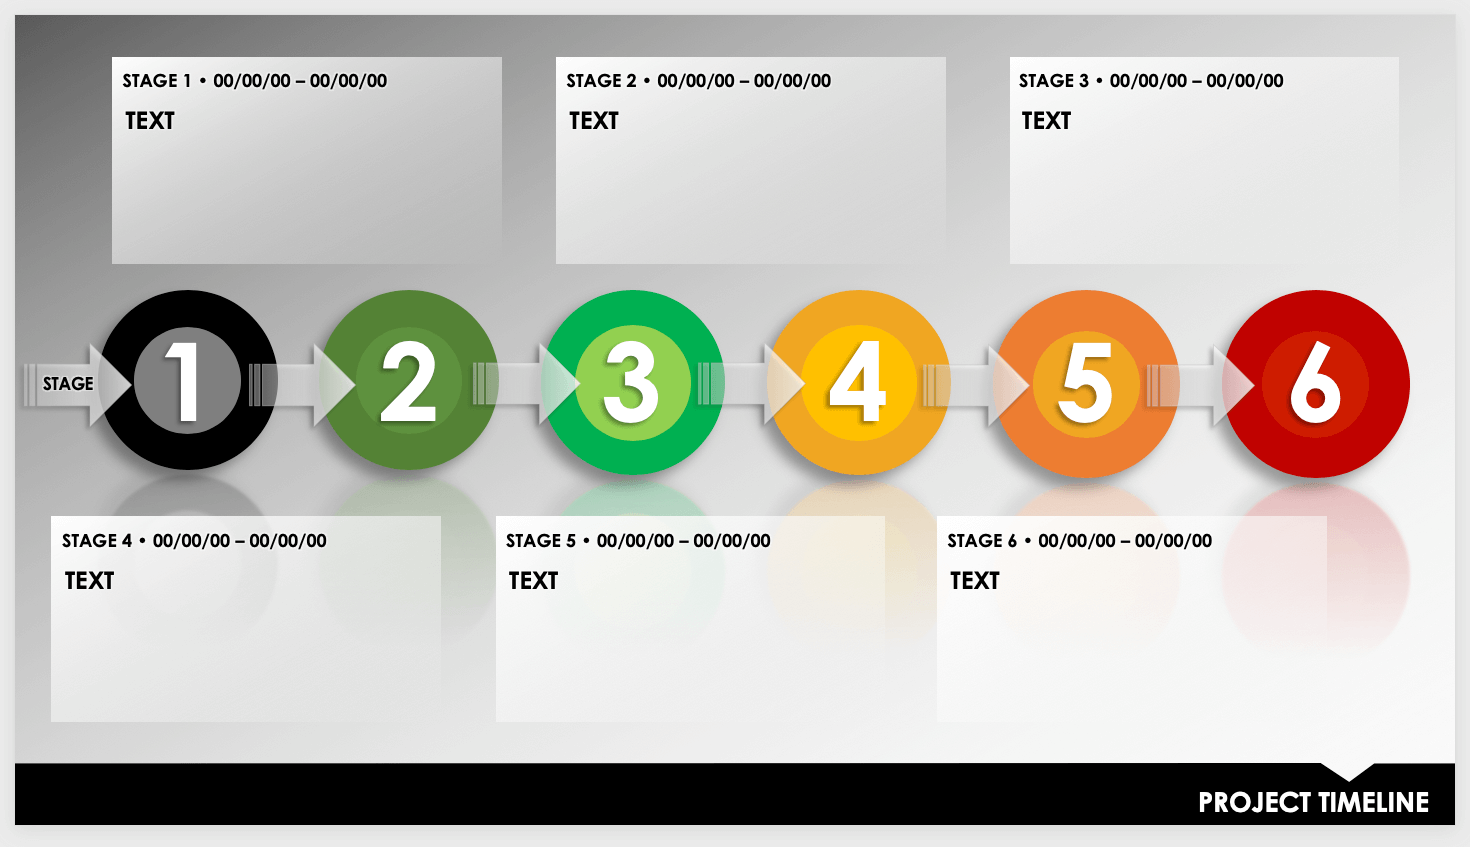
This template includes two slides: one for organizing data in a spreadsheet format, and one for viewing the project schedule on a Gantt chart. The spreadsheet includes task descriptions, owners, status, and dates. The Gantt chart shows the duration of each task, along with markers for milestones, risks, and tasks that are ahead of schedule.
For other project management Gantt chart options, view the free Gantt chart templates in Excel.
Download Project Timeline Template
Multiple Project Dashboard Template
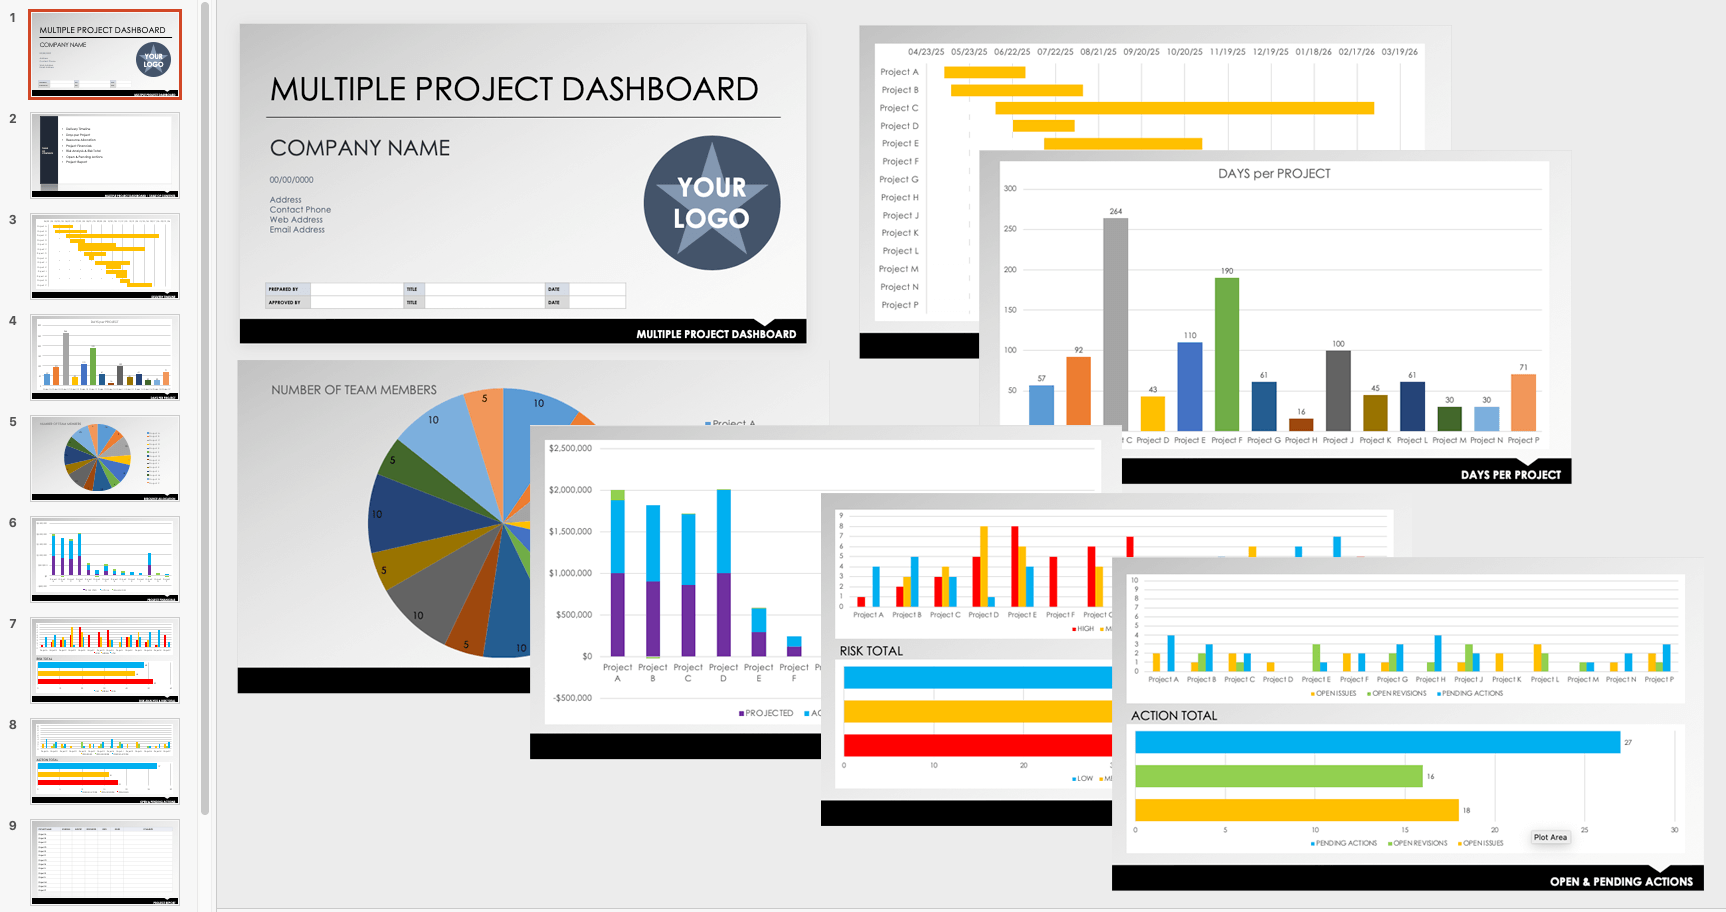
Manage multiple projects with this comprehensive PowerPoint template. The template provides a visual representation of the timeline, duration, allotted team members, financials, and risks for each project. Each slide in the template displays information for up to 14 projects. This dashboard functions as both a management template and a useful communication tool for sharing data with stakeholders.
PowerPoint Gantt Chart with Dependencies
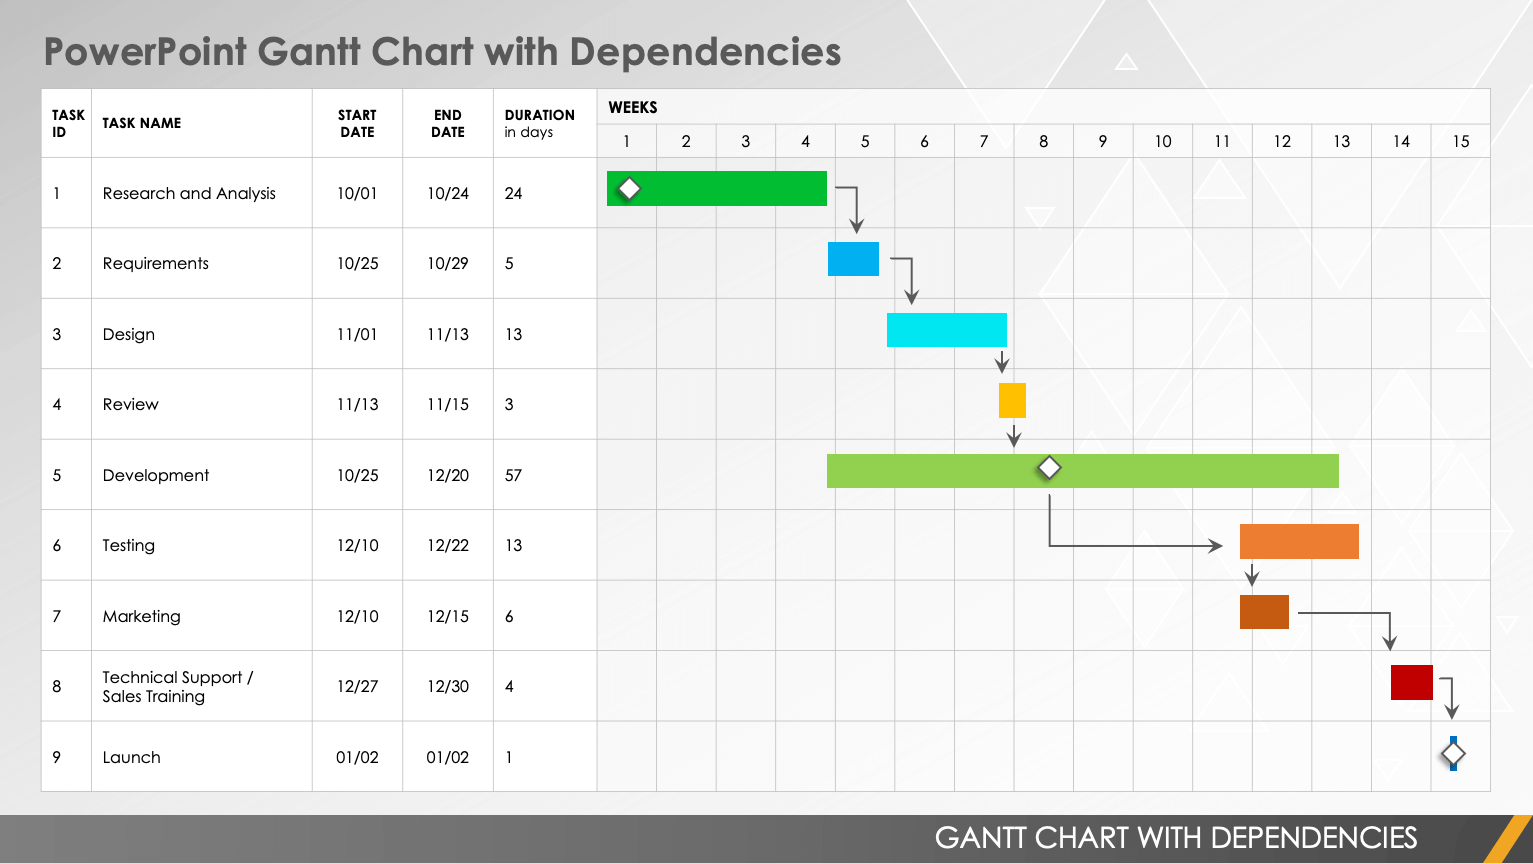
This Gantt chart template includes connecting arrows to illustrate dependencies between tasks. List each project task on the left-hand side, along with the duration and specific start and end dates. On the Gantt chart, track the progress of each task by using different colors or shading to indicate which activities you have completed or partially finished.
Simple Gantt Chart Template
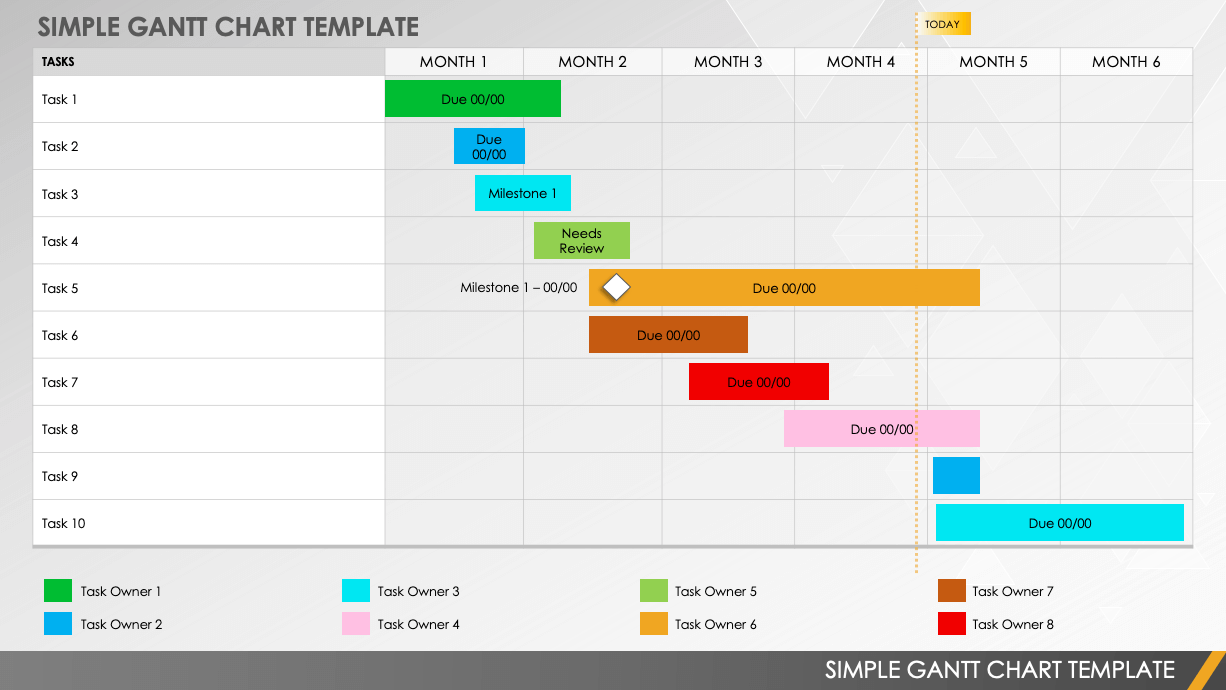
You can use this simple bar chart to easily create a visual schedule, whether you’re planning a weekly calendar, setting monthly goals, or managing a project timeline. This template incorporates minimal text and provides a simple layout to create a streamlined Gantt chart. Use the colors on the chart to represent task owners, priority, progress, or other information. Customize the template by changing the monthly timeline to days, weeks, or years.
Download Simple Gantt Chart Template
Software Development Timeline Template
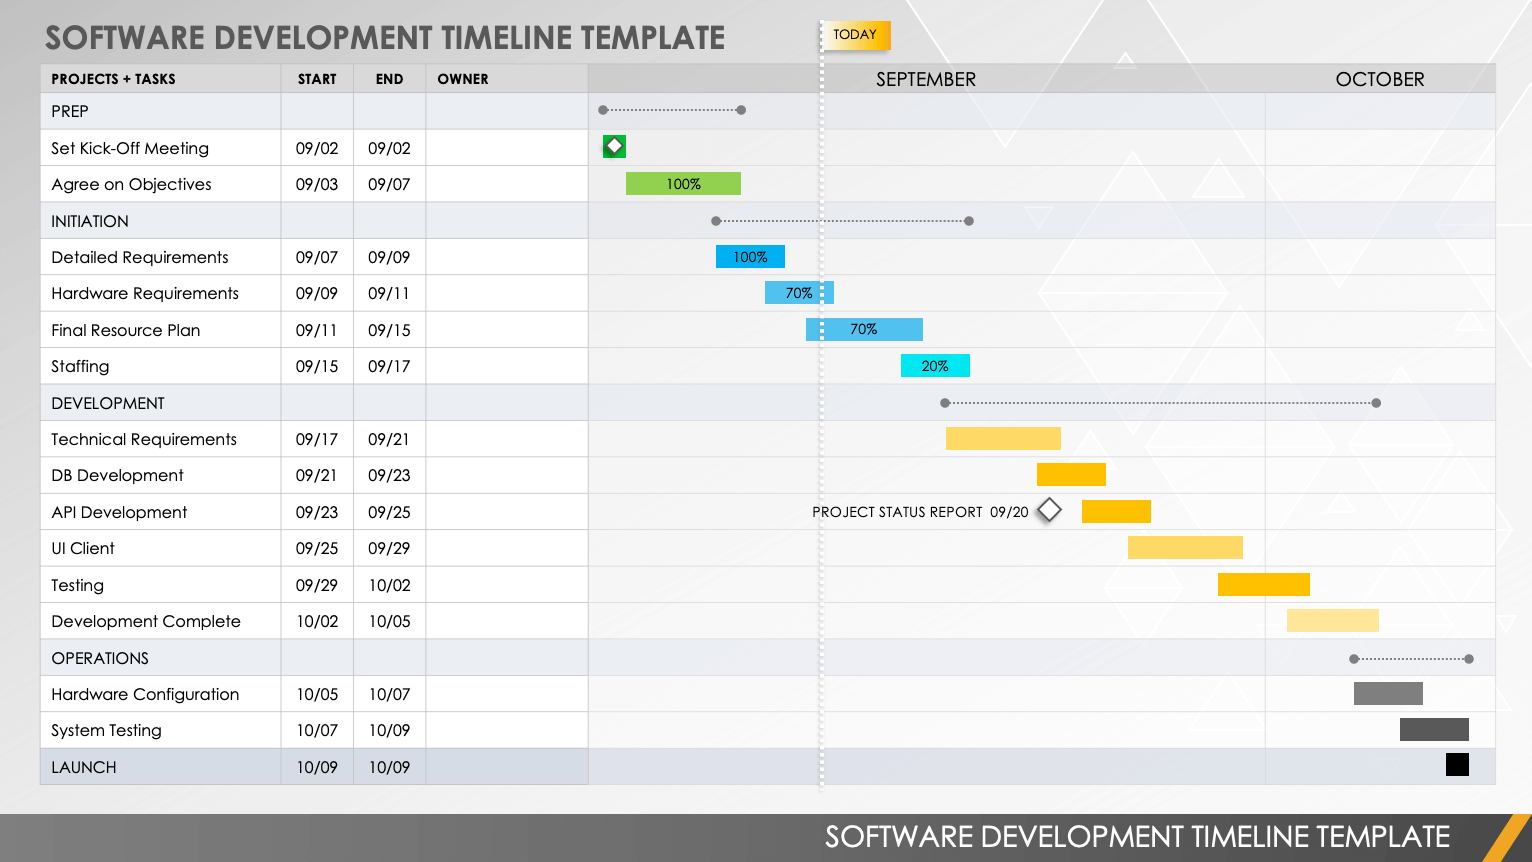
This template provides an example of a software development timeline, including project phases and tasks. The Gantt chart uses different colors to distinguish between project phases, and each bar shows the percent complete for a given task. The chart provides a monthly timeline for planning over the course of a year. In order to use the template for other types of projects or to show multiple projects on a single Gantt chart, add your own content.
Download Software Development Timeline Template
Hourly Timeline Gantt Chart Template
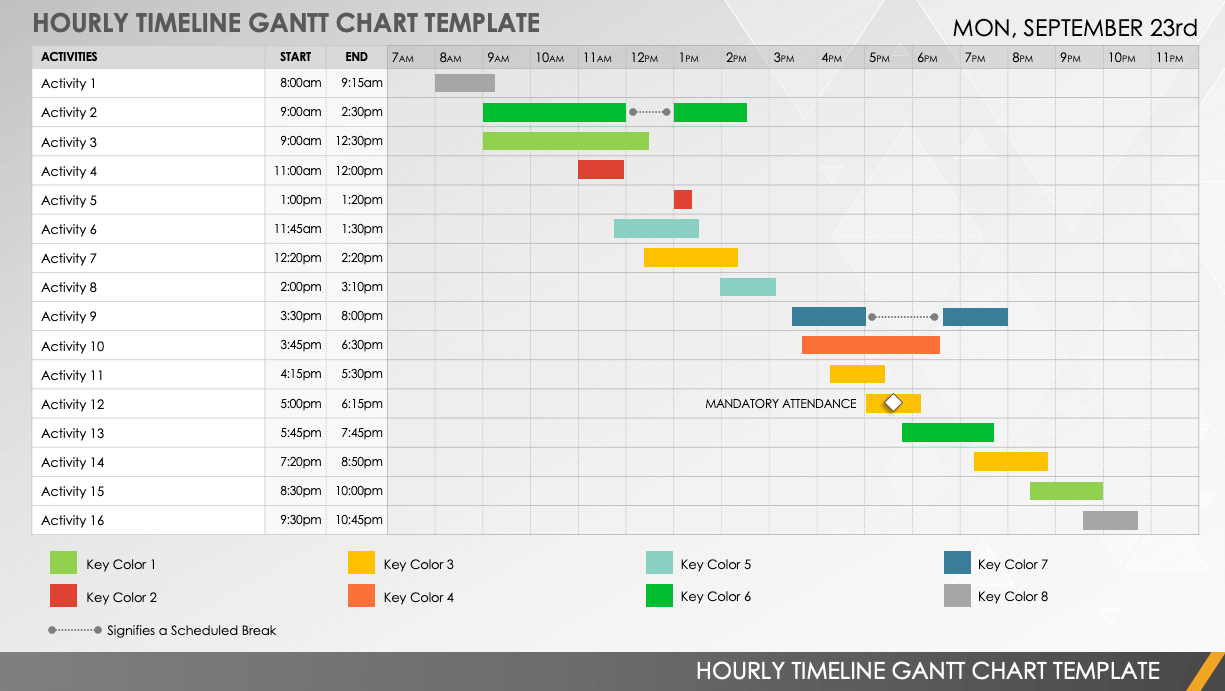
Track activities throughout a given day, whether you’re executing an hourly project schedule or creating a personal daily calendar. For project timelines, the template uses a color-coded key to show assigned owners for each task. List activities on the left-hand side, and then add bars to the
Gantt chart to show the hours scheduled for each task. This template serves as an excellent tool for managing time, communicating with task owners, and ensuring that projects stay on schedule.
3-Year Plan Gantt Chart Template
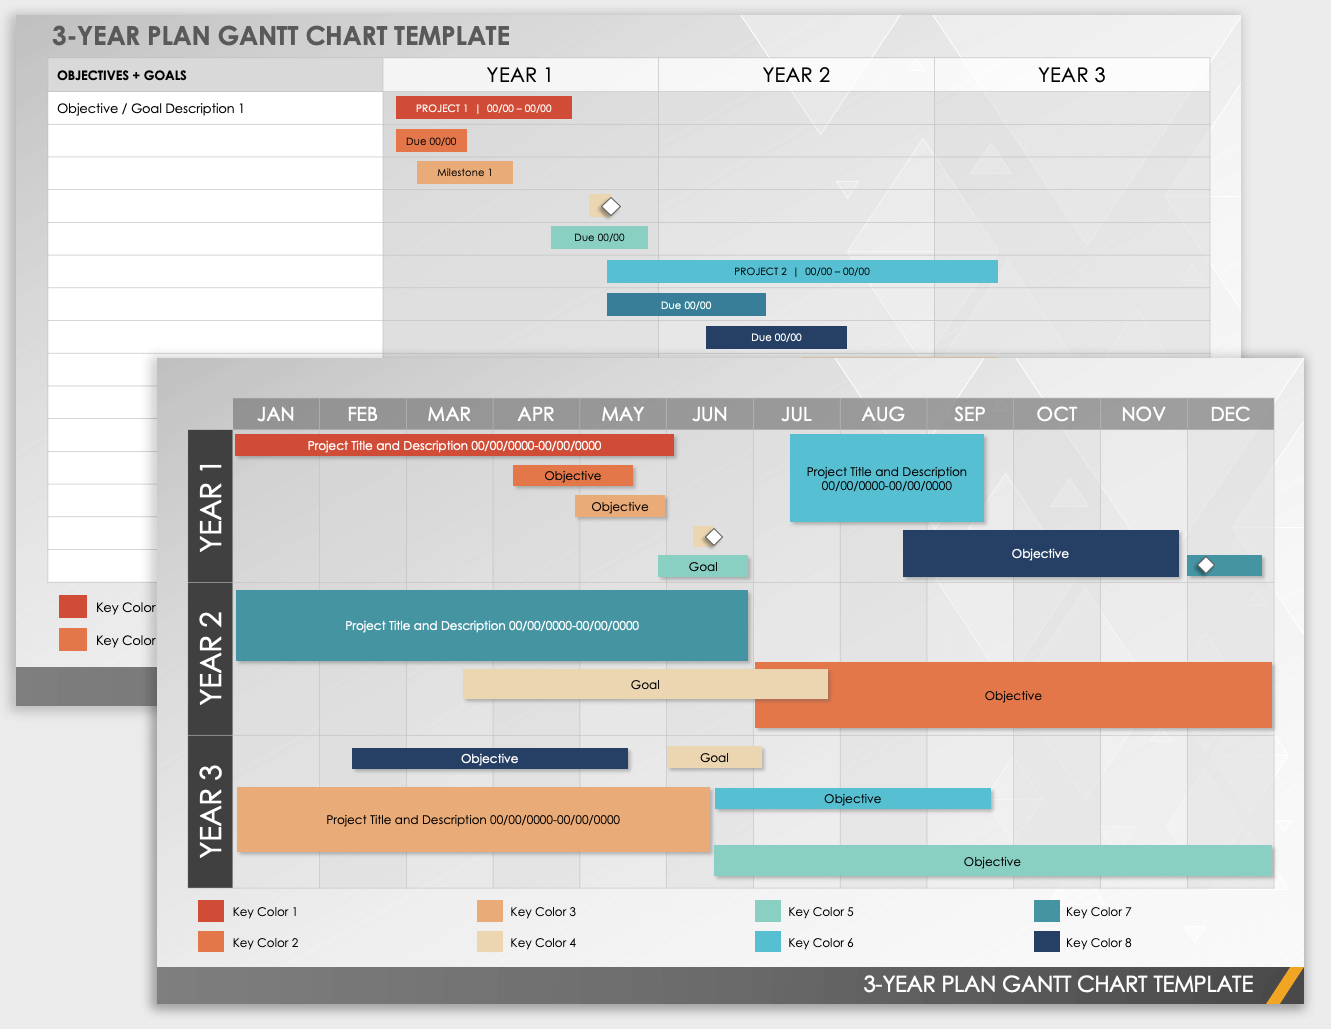
This three-year Gantt chart template includes two layout options: one displays years at the top of the chart, and the other displays them on the left-hand side. Use the template to support business planning, prioritize annual goals, or create a long-term project plan. If you need a different time frame, modify the template to show a three-month schedule or other timeline.
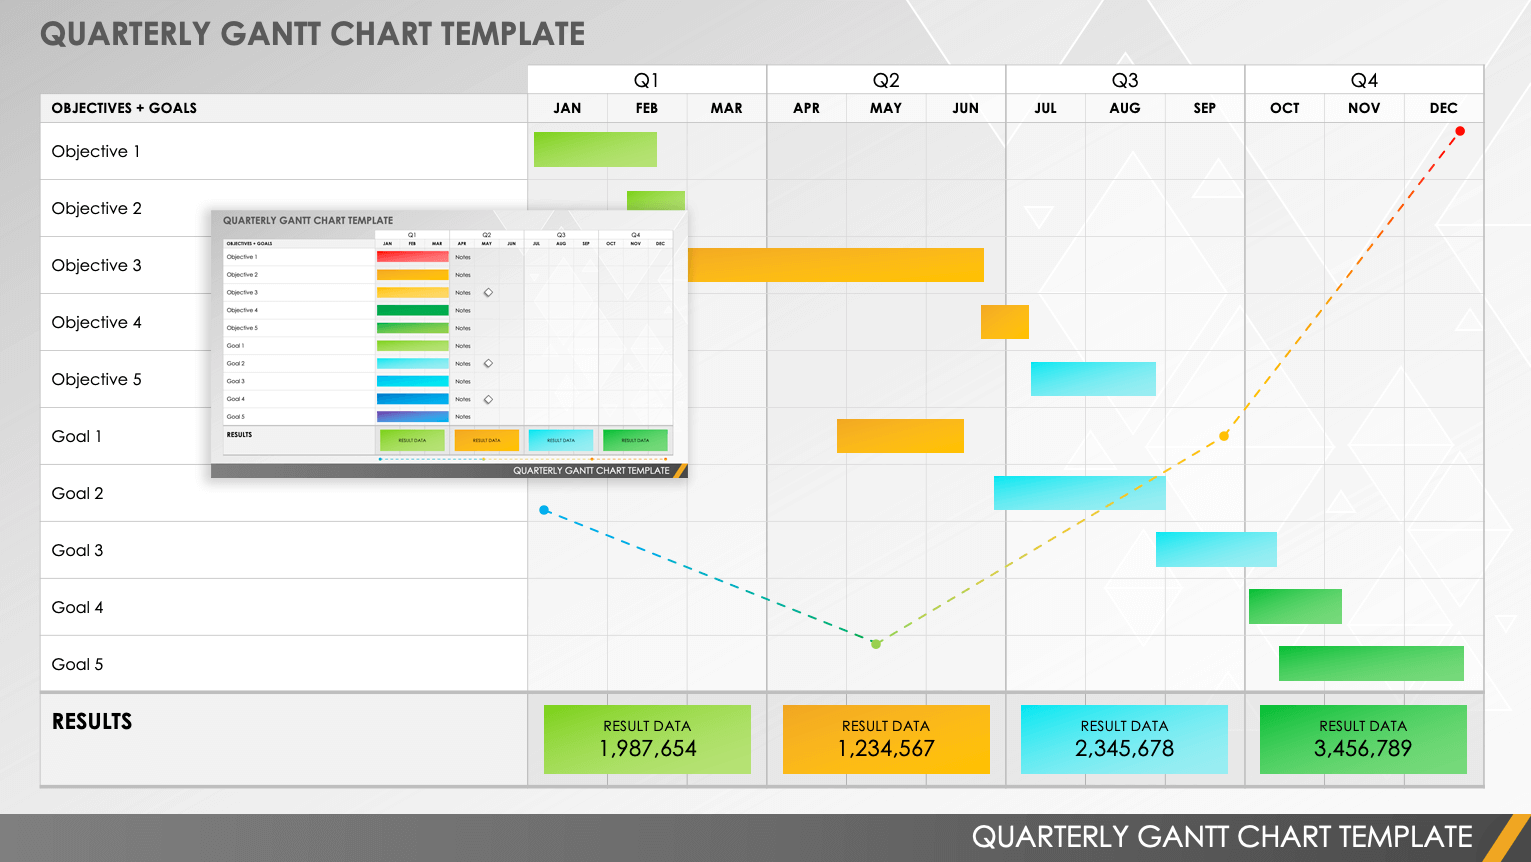
Quarterly Gantt Chart Template
Create annual and quarterly plans with this Gantt chart template. The chart separates the months of the year into four quarters and provides sections for listing goals and end results. This template allows you to make an action plan to reach high-level objectives, develop a project timeline with quarterly milestones, or schedule financial goals with quantifiable results. Keep track of monthly, quarterly, and yearly progress.
Download Quarterly Gantt Chart Template
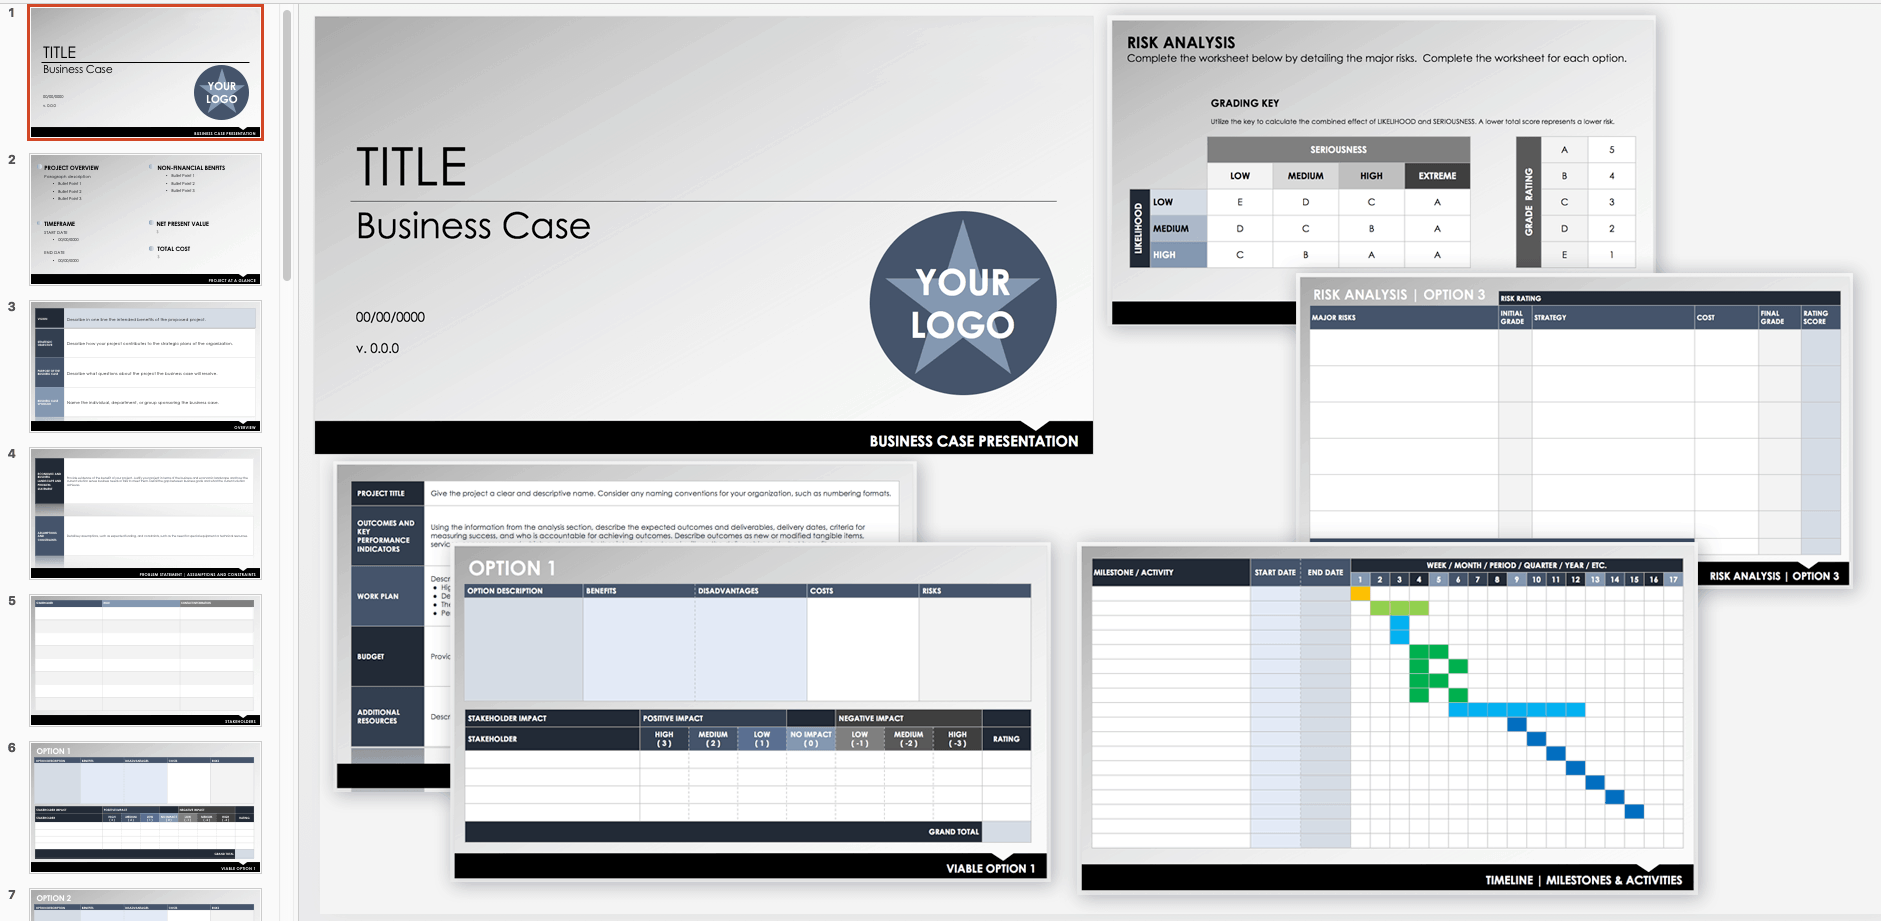
Business Case Presentation Template
This thorough business case presentation template includes a Gantt chart to illustrate your project timeline and milestones. Create a presentation that covers all of the important details of your project, including strategic objectives, stakeholders, risk analysis, budget, and scheduling. You can edit all of the slides in this PowerPoint template to create a customized presentation.
Improve Project Visibility with Real-Time Gantt Charts in Smartsheet
From simple task management and project planning to complex resource and portfolio management, Smartsheet helps you improve collaboration and increase work velocity -- empowering you to get more done.
The Smartsheet platform makes it easy to plan, capture, manage, and report on work from anywhere, helping your team be more effective and get more done. Report on key metrics and get real-time visibility into work as it happens with roll-up reports, dashboards, and automated workflows built to keep your team connected and informed.
When teams have clarity into the work getting done, there’s no telling how much more they can accomplish in the same amount of time. Try Smartsheet for free, today.
