What Is Resource Forecasting?
Resource forecasting — trying to predict the materials, time, equipment, and people required for a project and when — is a complex process. It requires balancing project timelines, skill requirements, team capacity, and shifting priorities. You’ll need more than gut instinct and static spreadsheets.
Accurate resource forecasting is probably the most critical skill a project manager can master. If you don’t have the right people in the right roles at the right time, your project risks delays, overruns, and burnout. But when you can anticipate resource demand with confidence and precision, you unlock the ability to plan strategically, deliver on time, and scale your project pipeline effectively. Whether you’re managing one project or an entire portfolio, confident forecasting allows you to staff effectively, avoid burnout, and make decisions ahead of resource shortages that could derail delivery.
Throughout this article, you’ll find actionable tips that you can use for resource forecasting, whether you’re planning with spreadsheets or leveraging purpose-built tools. If you’re already using Resource Management by Smartsheet, a tool that helps teams allocate, balance, and forecast resources across teams, you’ll also find the in-product suggestions labeled Try this in Resource Management helpful. These callouts show how the platform streamlines each step, giving you real-time visibility and agility as your project pipeline evolves.
Improve your resource management in Smartsheet with this tool that helps you plan, schedule, track, and optimize assignments across projects.
Learn more in this guide to resource management, including expert tips and helpful resources.
Understanding Your Project Pipeline
Before you can forecast resources with confidence, you need to understand the scope of your upcoming work. Start with a comprehensive list of projects that are in progress, approved, and proposed. For each project, estimate the expected timeline, size, complexity, and deliverables required.
Many forecasting mistakes occur because teams underestimate future demand or don’t have visibility into what’s coming next. The key to proactive planning is mapping your full project pipeline over short- and long-term time horizons. Try to anticipate which phases will require the most resources and when those resources will be needed. Use color-coded tags or project stages to help you distinguish between confirmed and potential work.
If your organization uses a PMO or centralized intake process, leverage those intake forms or project request systems to ensure nothing slips through the cracks. Otherwise, set up a lightweight system, such as a shared project intake spreadsheet or Kanban board, that helps teams surface upcoming work early.
You can use a project pipeline tracker template to standardize your company’s project pipeline management process.
Categorizing and Profiling Resource Types
Define and document the types of resources you’ll need to do the work. Use a spreadsheet or a centralized database to gain an understanding of how many people you have and their capacity, skills, constraints, and associated costs.
Start by creating a list of types of resources: full-time employees, part-time employees, contractors, freelancers, and shared internal resources. For each individual or role, note key attributes: job title or role, skills, primary language, availability, cost/rates, and location or time zone as applicable.
If you don’t have a centralized database of resources, start small. A spreadsheet with these fields can become a single source of truth, especially for smaller teams or organizations that don’t currently use specialized resource management tools. Be sure to update it regularly and align it with HR or staffing records.
The goal is to shift from reactive, last-minute staffing decisions (“Who’s available right now?”) to a more proactive approach factoring in roles and capabilities (“What skills do we need, and when will we need them?”). This shift allows teams to anticipate demand, reduce fire drills, and make smarter staffing decisions at scale.
Try this in Resource Management: Your centralized resource tool is the People tab. You can profile people with custom fields, set their working hours, mark roles as billable or non-billable, and update availability. This real-time visibility is crucial for accurately balancing demand with capacity.
Analyzing Historical Planned vs. Actual Variances
Forecasting future needs becomes a lot easier when you understand your past. Historical resource data offers insight into how much time and effort different types of projects took, how resources were used, and where previous forecasts might have fallen short.
Start by identifying completed projects that are similar in size, scope, or complexity to those in your current pipeline. Look at metrics such as these:
- Actual hours worked by people in a particular role or team
- Tasks or phases that took more or less time than estimated
- Roles that were consistently over- or underutilized
Even if you don’t have time tracking software, you can often find useful data in status reports, sprint logs, or project schedules. Project postmortems or retrospectives might also contain notes about resourcing challenges such as recurring bottlenecks or scope creep.
Once you identify trends, apply them to your current forecasts. For example, if your last three digital campaigns underestimated design time by 30 percent, build that adjustment into your next forecast. This kind of continuous refinement helps eliminate guesswork over time.
Try this in Resource Management: Use reports to analyze actuals by person, role, or project. By filtering by time frame or department, you can more easily spot trends and insights that inform smarter resourcing decisions for the future.
One of the box reports available in Resource Management is the Time and Fees Report, which shows project progress and compares your actual time and fees to forecasted time and fees.

Whether you’re using a spreadsheet or a dedicated resource management tool, the principle remains the same: The more you learn from the past, the more confident your forecasts will be.
Choosing a Forecasting Model
There’s no one-size-fits-all approach to forecasting resource needs because not all projects or teams are built the same. You can forecast needs by task or deliverable, big-picture resource constraints, or resource availability. The right model depends on your project’s level of detail, predictability, and required visibility.
Here are three commonly used forecasting models to consider:
Bottom-Up Forecasting Model: The bottom-up approach starts at the task level. You’re estimating the time required for each task, phase, or deliverable, then rolling those estimates up by role or person. And don’t forget to add time for project management, quality analysis, stakeholder reviews, and administrative tasks — these are often underrepresented in bottom-up estimates.
Use this forecasting model when you have a detailed work breakdown structure (WBS) or want precise insight into hours needed per skill set, or when your project is fixed-scope or time-sensitive.
Top-Down Forecasting Model: This high-level approach starts with the overall budget, timeline, or resource constraint, then distributes resources proportionally across the timeline or milestones. You can use this for early pipeline planning, then switch to bottom-up forecasting once the project is approved and scoped.
This forecasting model is best for when you’re planning early-stage or high-level portfolios, or working with fixed budgets or limited headcount. You can also use this model when your scope is still fluid but you need directional estimates.
Capacity Planning Model: Instead of starting with demand, this model starts with supply. You’re reviewing team availability and comparing it to upcoming project loads to identify over- or undercapacity. Be sure to account for nonproject work such as meetings, training, and PTO — people rarely spend 100 percent of their work hours on tasks. Capacity planning functions best when team members work on multiple projects at once, when you want to optimize overall team utilization, or when you’re trying to balance demand with actual staffing limits. For more on how to strategically divide time and effort across projects, check out our guide to allocating resources across multiple projects.
This guide to capacity planning includes expert tips and tools that can help you make smart decisions and meet demand effectively.
Regardless of which model you start with, the most effective teams revisit their approach regularly and blend aspects of each model to match project maturity and organizational needs.
Inputting and Refining Forecasts
Once you’ve selected your forecasting model, it’s time to build out your resource plan, and keep it flexible. List your project timelines, roles and placeholders, and periods of over- or underutilization and capacity. Forecasting is an ongoing process of making informed decisions, stress-testing those decisions, and refining your plan as new data becomes available.
If you’re using a spreadsheet or basic project management tool, start by taking these steps:
- Listing Every Project Timeline: This gives you a clear view of what is scheduled for when and how long.
- Mapping Out Required Roles: Identify the roles in your project and their expected utilization by week or month so you know how much time each is expected to contribute during each phase of the project.
- Assigning Placeholders Where Needed: If specific people aren’t decided or known yet, assign generic labels or placeholders for each role to forecast their demand.
- Flagging Over- or Under-Capacity: By tracking availability of resources in real time, you can adjust or distribute where needed. Use conditional formatting or simple formulas to highlight problem areas, such as overallocated roles or understaffed projects. Even with a manual process, this gives you a visual option to track whether your team can handle the projected workload or if you’ll need to hire, delay, or reallocate work.
- Review Regularly: Once your forecasts are in place, make it a habit to review and refine them weekly or biweekly. Project timelines shift, people take time off, and scope evolves — treat your forecast as a living plan, not a rigid schedule.
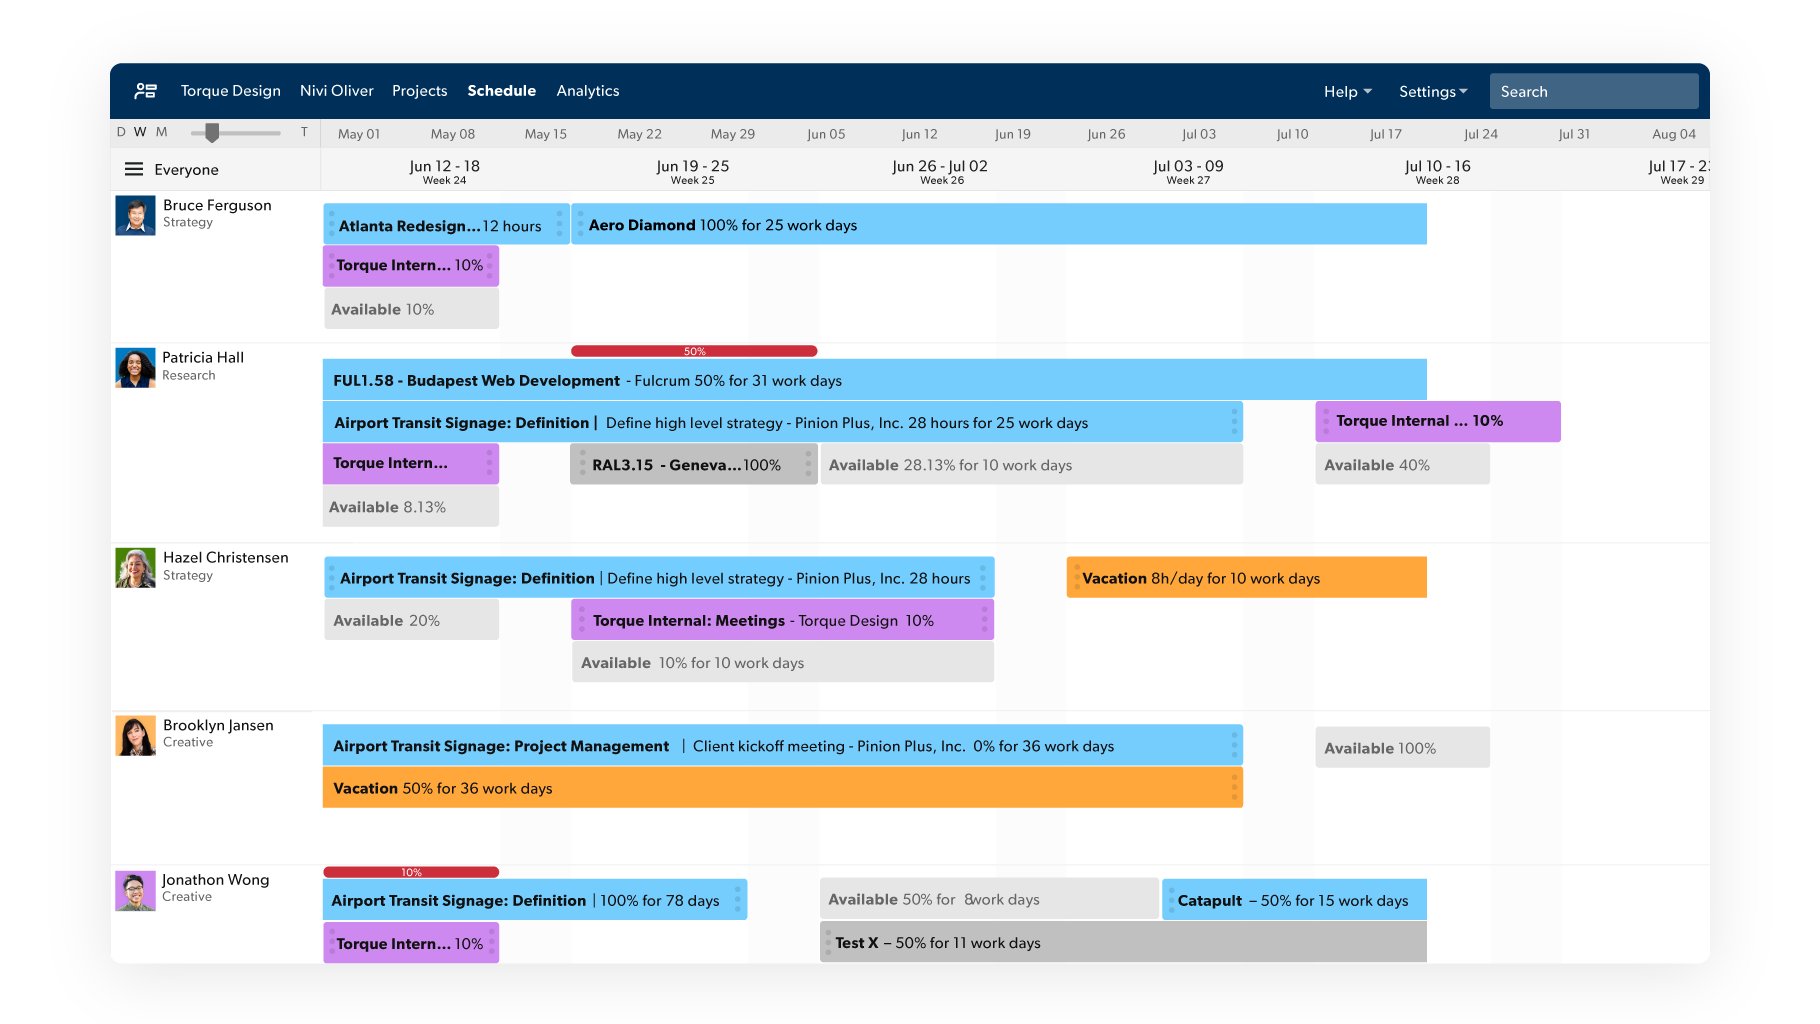
Try this in Resource Management: Use placeholders in the Schedule View to represent future roles you’ll need. This helps your team see upcoming demand clearly, so you can plan ahead, adjust workloads, and staff proactively, even before you’re able to assign a specific person to the work.
Project and resource managers can use Schedule View to gain real-time visibility into team capacity, assignments, and availability across projects.
Learn how to master resource scheduling with this deep dive.
Monitoring Capacity and Demand in Real Time
Monitoring capacity and demand means making sure that you coordinate your team’s forecasted hours with available hours or resources. Use a tool to compare these two data points so that you are aware of over- or underutilization. This enables you to maintain visibility as conditions shift.
Monitoring your team’s real-time capacity alongside projected demand helps you make confident, timely decisions about workload, people, and priorities. To start, get a clear view of two basic data points:
- Capacity: This is the number of hours your team members actually have available. (Keep in mind that teams typically work at 70-80 percent of full capacity.)
- Demand: This is the number of hours forecasted for upcoming project work, by role or individual.
If you’re working in spreadsheets or a manual system, create a table that lists each team member’s available hours per week or month, summarize forecasts by role or person in your project plan, and highlight over- and undercapacity using conditional formatting.
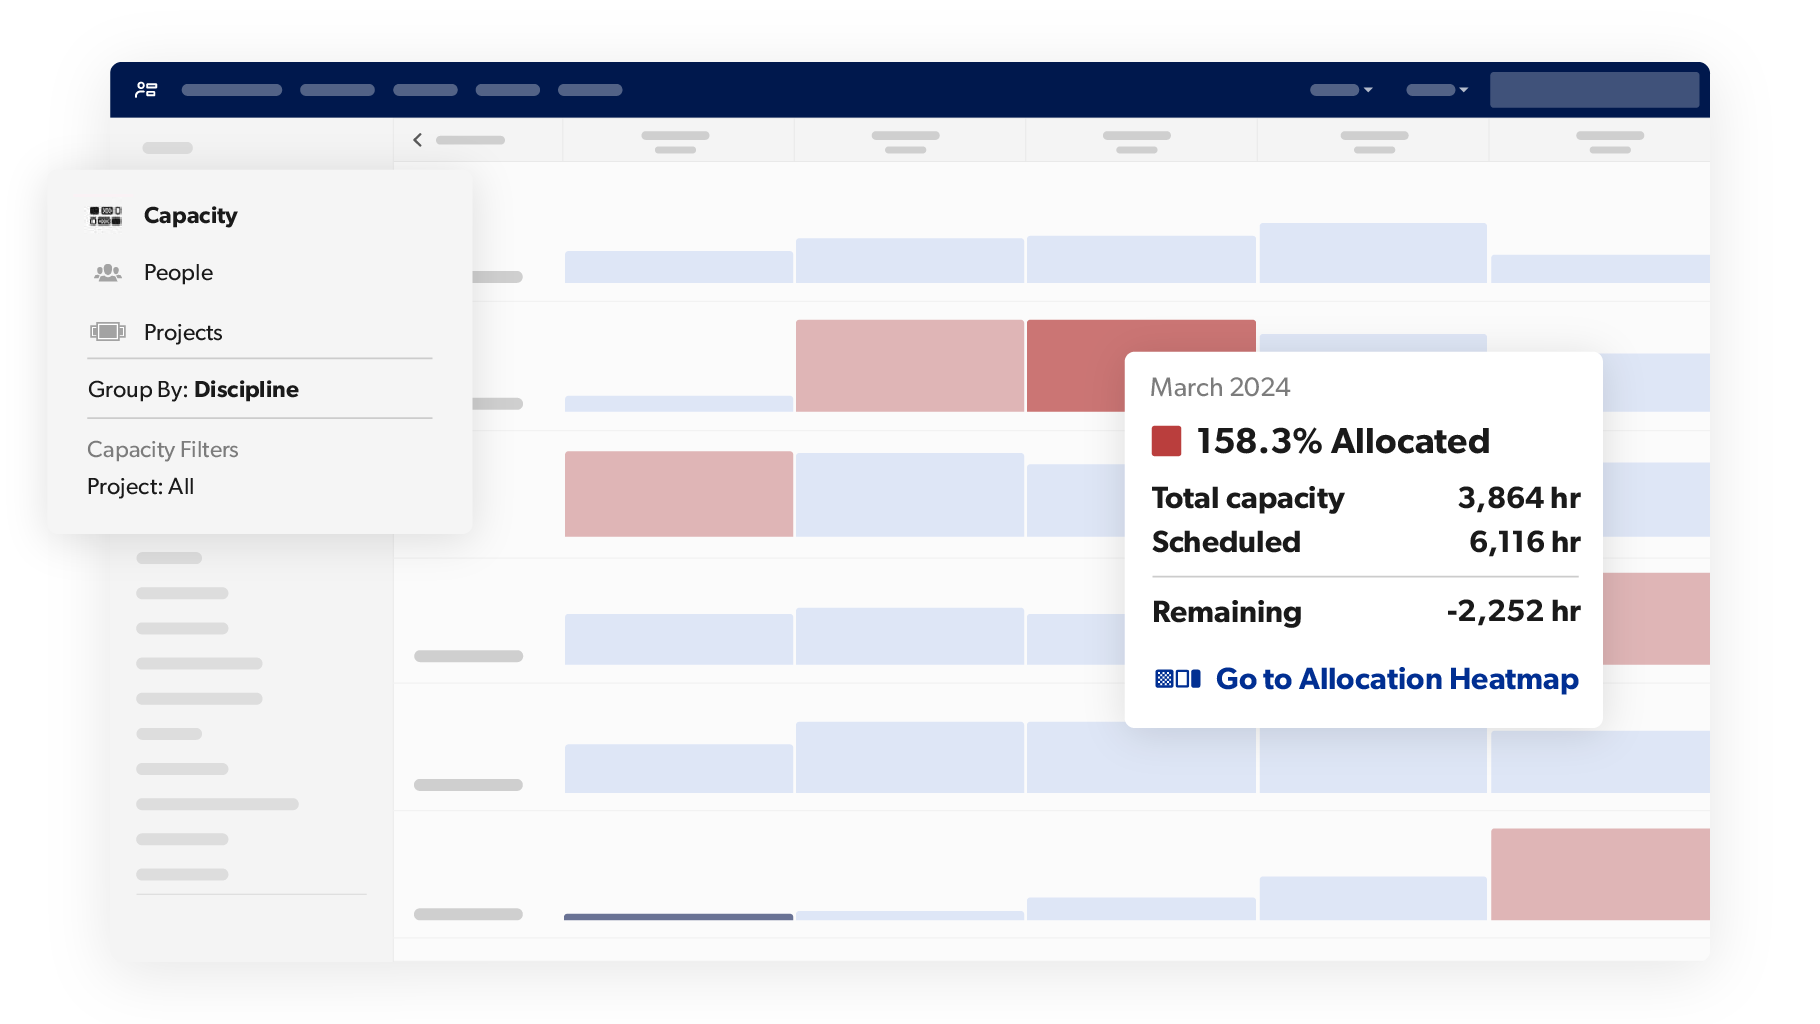
Try this in Resource Management: Creating this table using the Schedule and Capacity Views in Resource Management is easier and more dynamic than using a manual system. Because the data updates automatically, you can anticipate potential issues and adjust proactively.
Use Resource Management to view real-time availability across teams and filter by project, department, role, or time frame; identify over- or underutilized roles at a glance using Heatmaps; and see the impact of tentative vs. confirmed bookings to make better planning decisions.
With Capacity View, you can more easily spot resource constraints and adjust workloads before they impact delivery.
By continuously monitoring capacity and demand side by side, you’ll make smarter resourcing decisions and ensure your forecasts remain grounded in reality, not best-case assumptions.
Making Resource Forecasts Accessible
Creating a strong forecast is only part of the equation. Sharing it effectively is what builds trust and drives action. This means making your forecast clear: highlighting key takeaways, offering visibility, and providing context and customizability.
To do this well, your forecasts need to be visual, contextual, and flexible. Include charts, highlight major findings, and build in filters for time periods, departments, or any other categories that stakeholders might want to explore or prioritize. Visibility and transparency inform stakeholders and build confidence. When leadership sees that your forecasts are data-driven, scenario-based, and responsive to change, they’re more likely to approve new hires, reprioritize work, or greenlight strategic investments.
Whether you’re requesting additional headcount, proposing a reprioritization of your project pipeline, or preparing for an executive review, communicating your resource forecasts clearly and confidently helps stakeholders make informed decisions faster.
If you’re working manually, use Excel or Google Sheets capacity planning templates to create stacked bar charts showing capacity vs. demand by role. Apply conditional formatting and include narrative summaries to guide understanding. Be careful not to overwhelm stakeholders with too much detail. Focus on the roles or projects that need action, and summarize what decisions are needed.
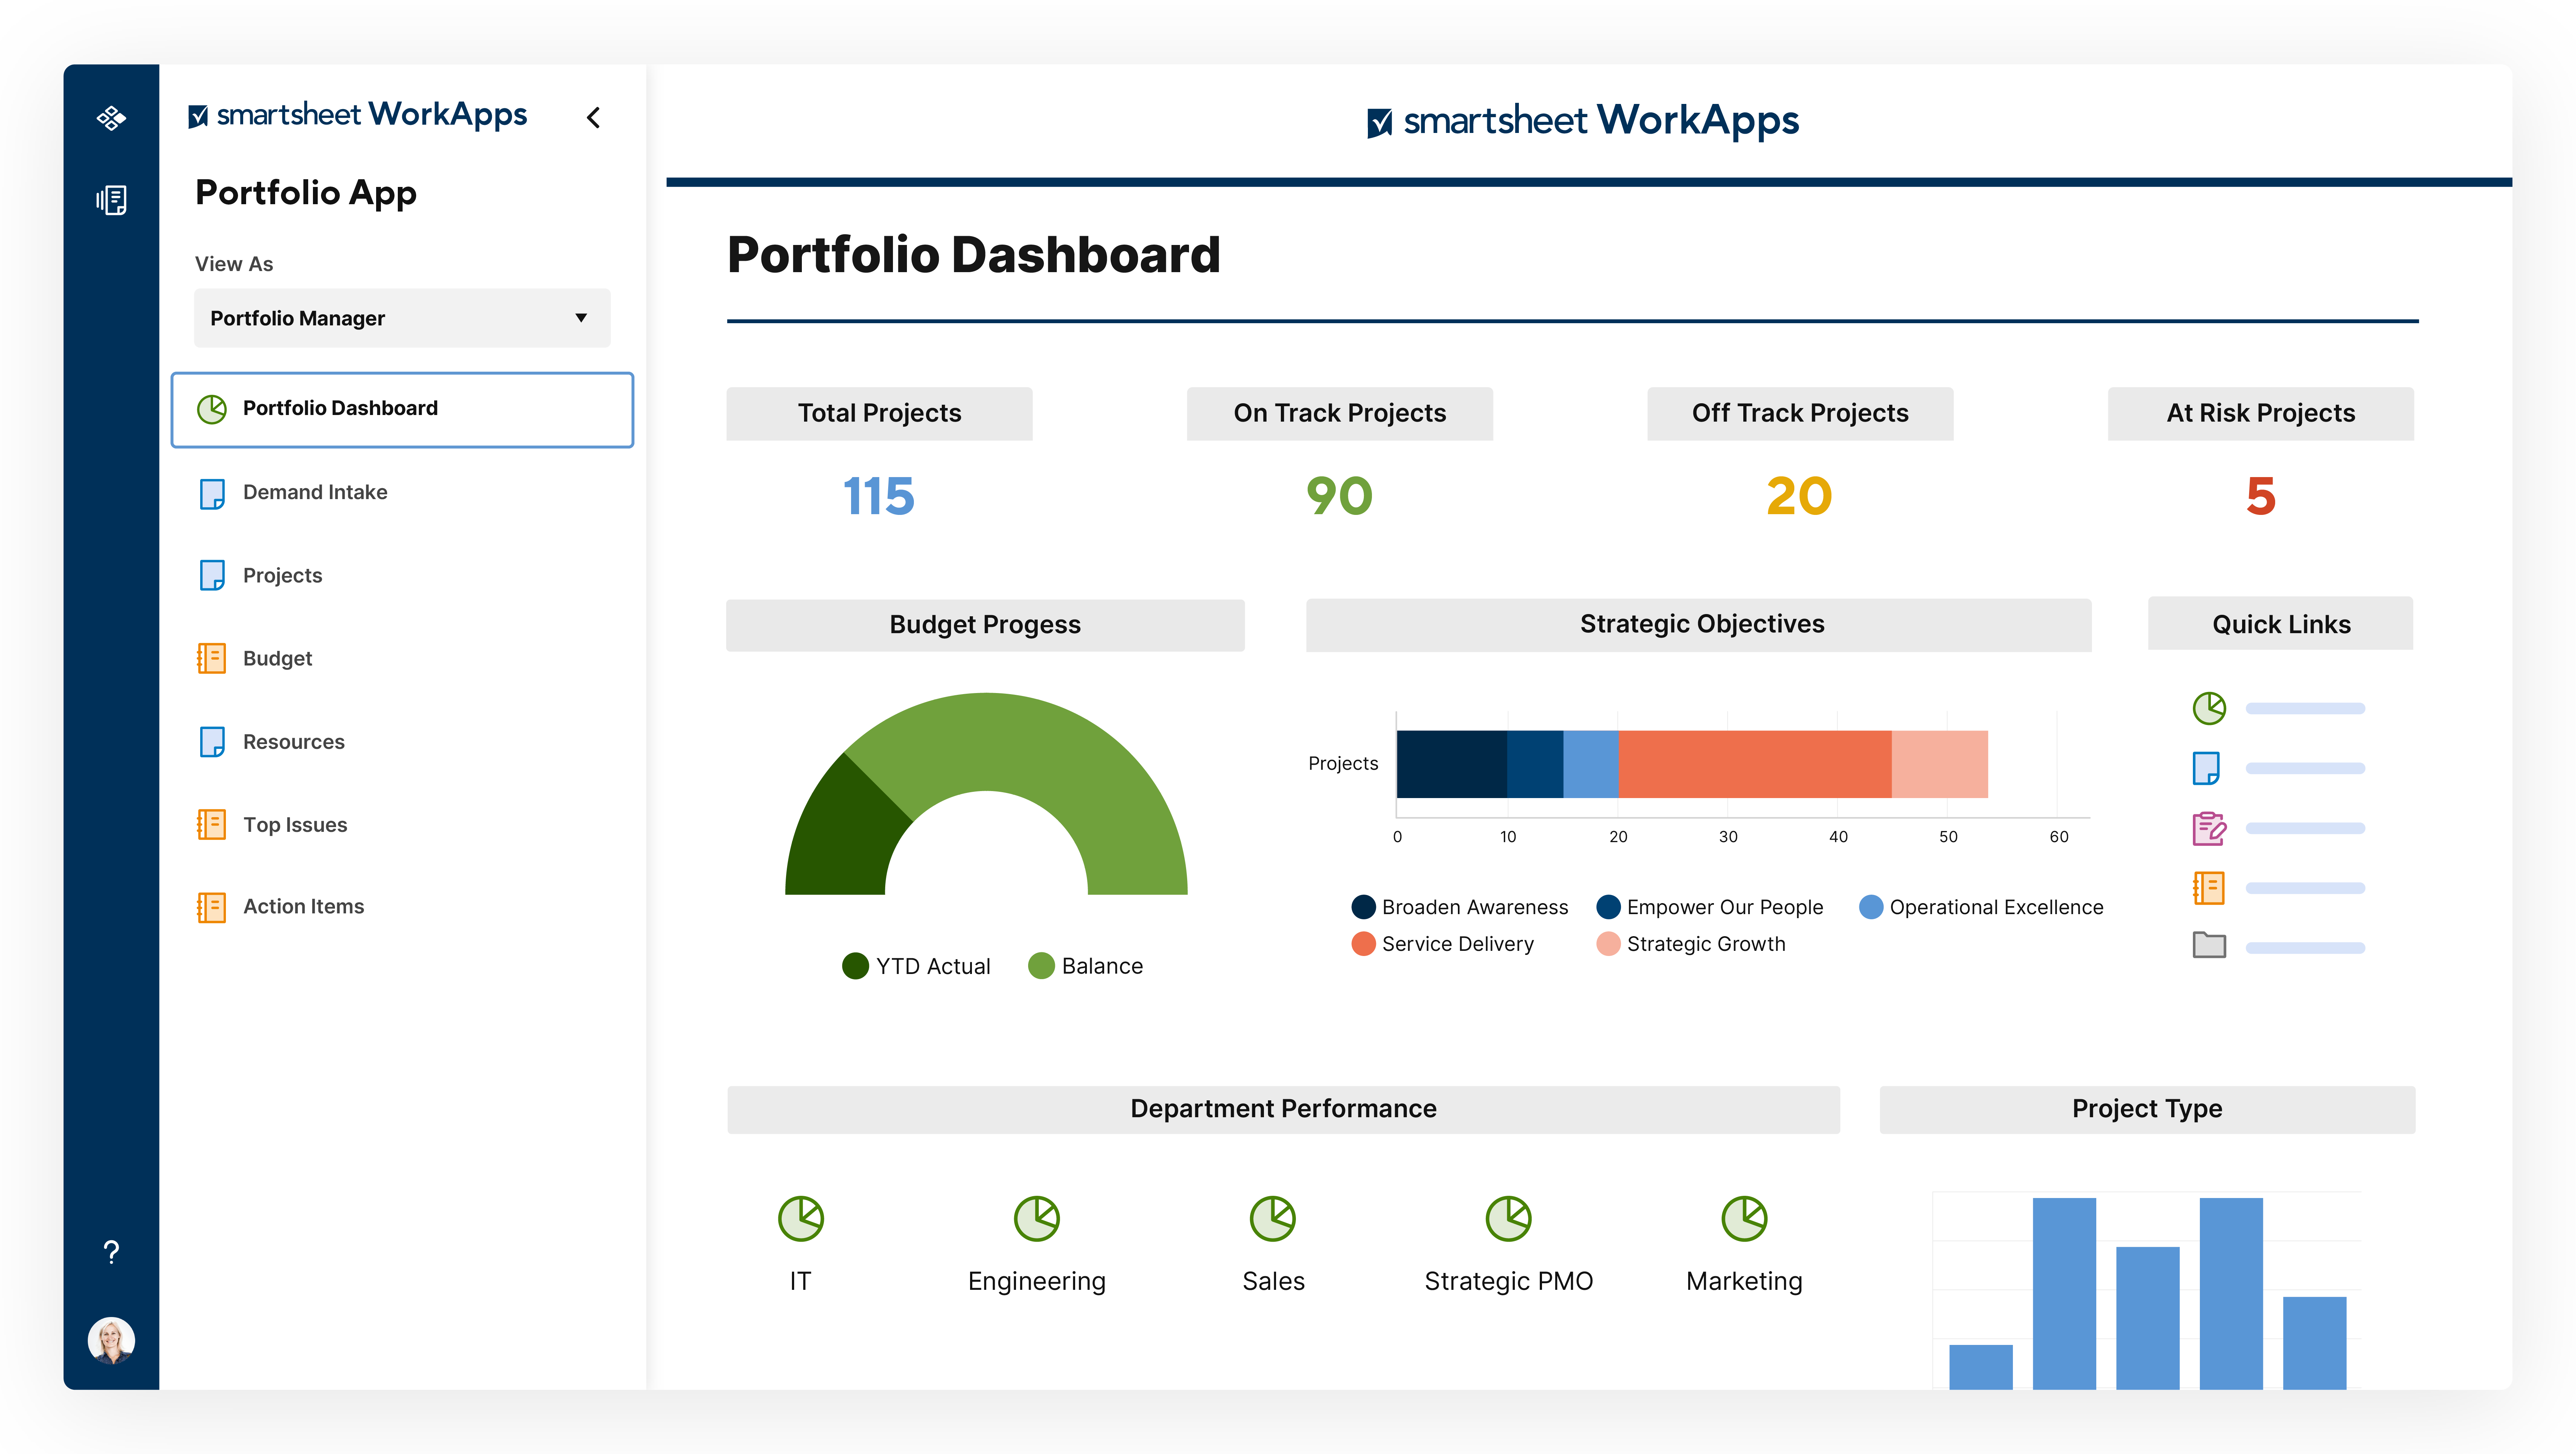
Try this in Resource Management: Export or embed visualizations such as Heatmaps, Capacity View, and utilization reports into your dashboards and presentations. You can also build dynamic reports that allow leadership to filter by team, time frame, or project category.
Smartsheet dashboards help teams make informed decisions across large-scale initiatives by providing real-time visibility into portfolio health, budget allocation, strategic alignment, and department performance.
By proactively sharing your forecasts with stakeholders, you turn resource planning into a collaborative, future-focused conversation, instead of a last-minute scramble.
This introduction to resource allocation covers expert tips and best practices to help you get started.
Integrating With Other Tools
To forecast resource needs with confidence, you need access to timely, accurate data, which means your tools have to talk to each other. When resource management is siloed from project plans, hiring decisions, and budgets, it can’t reach its fullest potential.
Try this in Resource Management: Enable Resource Management on the Smartsheet platform to sync in real time between project timelines and resource schedules, keeping delivery teams and leadership aligned.
Additional integrations, such as Jira and Salesforce, ensure that your forecasts take both actuals and demand into account as they evolve. You can also use the Control Center to automate project provisioning and resource allocation at scale.
When all your tools are connected, you gain full visibility across the project lifecycle. You can forecast earlier, adjust faster, and plan smarter.
Improve Resource Management Efforts With Smartsheet
Resource Management by Smartsheet is a powerful resource management software that helps to effectively manage the who, the what, and the when behind projects.
With Resource Management by Smartsheet, you can more easily build the best team for a project, keep project schedules and budgets on track, and confidently forecast business needs.
When teams have clarity into the work getting done and by whom, there’s no telling how much more they can accomplish in the same amount of time. Watch a free demo to learn more about Resource Management by Smartsheet.