How to Create an Inventory Dashboard in Excel
You can create an inventory dashboard in Excel using a pre-built template. Download the template, create a column chart to show stock per item, a pivot table to show stock and reorder levels, and a customizable pivot chart from the pivot table. Then copy this data onto a separate inventory dashboard worksheet.
Learn more about building dashboards in Excel.

Download the
inventory stock control templatefor Excel.
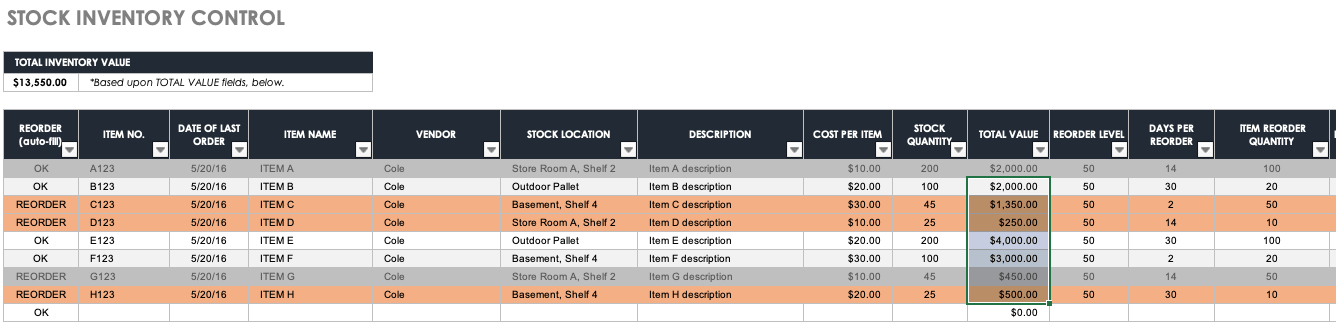
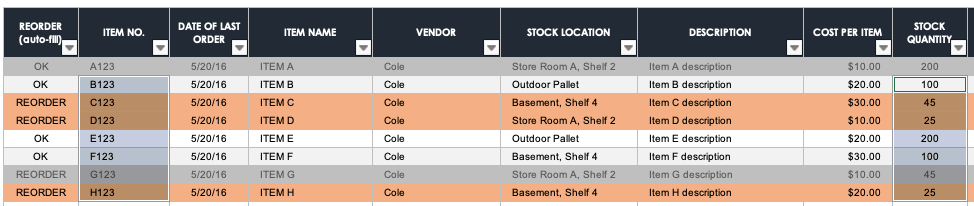
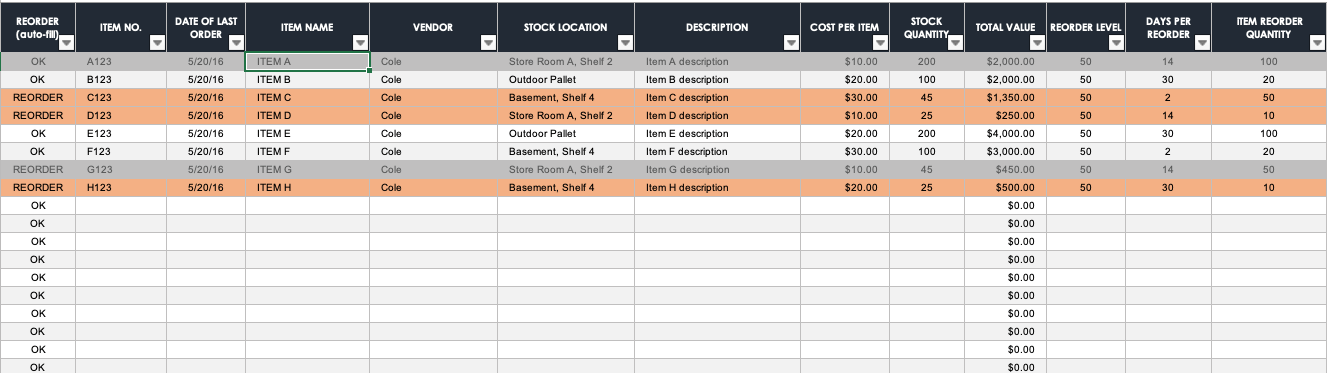
- To create your first inventory visualization tool, with your cursor, highlight the columns that will be represented on the visual chart for your dashboard. Hold Control for Windows or Command for Apple, and highlight the next field you want in your chart. In this example, we’ll create a visual chart for Stock Quantity by Item No.
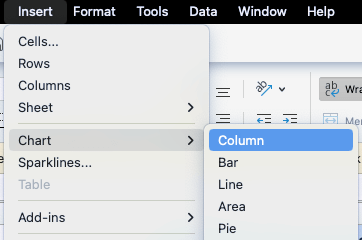
- On the page menu, click Insert. Then click Chart and select the type of chart you want to create. In this example, we’ll create a Column chart.
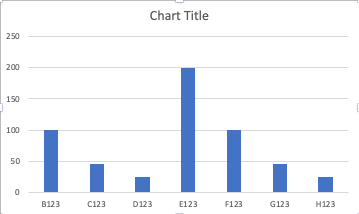
- Excel automatically creates your chart, which shows the inventory levels for each item. You can also create charts that show the total value of each item or reorder status.
- Now you can create a pivot table. Click a cell that contains data from which you want to create a pivot table.
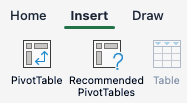
- Click Insert, and then click PivotTable.
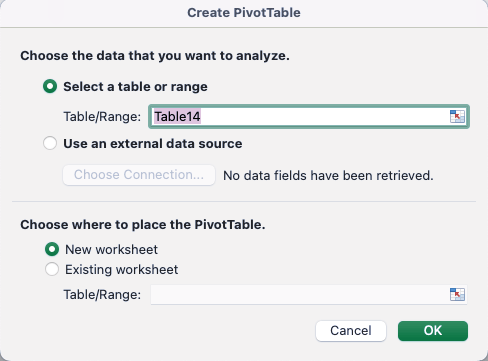
- A pop-up window will appear on your screen. Click Select a table or range and New worksheet. Then click OK.
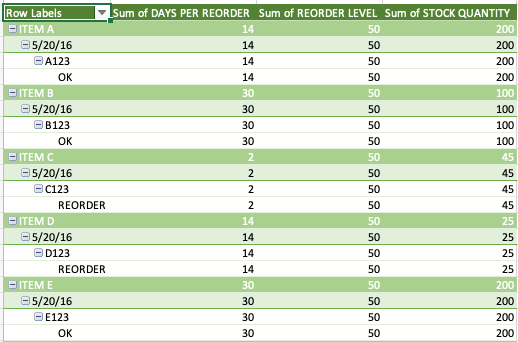
- Select the pivot table fields you want for your table. For this example, we are creating a pivot table to visualize data related to reorder status.
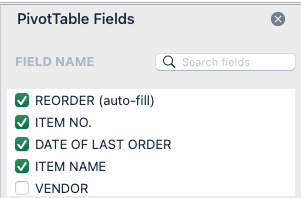
- Check to make sure that pivot table includes all the data you want.
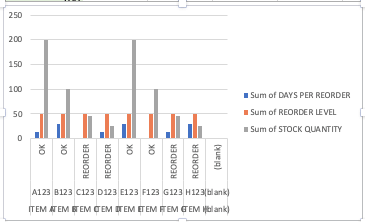
- Next, create a pivot chart. Click any cell on your pivot table.
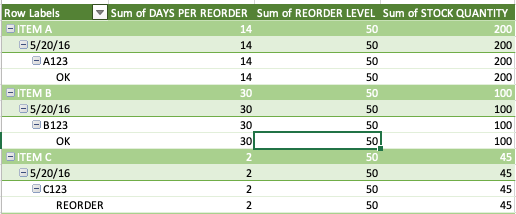
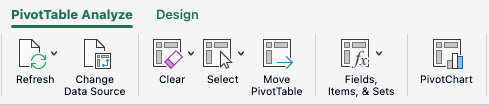
- At the top of your screen, click PivotTable Analyze. Then click PivotChart.
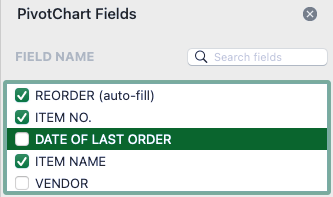
- Excel will create your PivotChart. Check to make sure it includes all the data you want and nothing more. In this example, we will remove Date of Last Order from the chart.
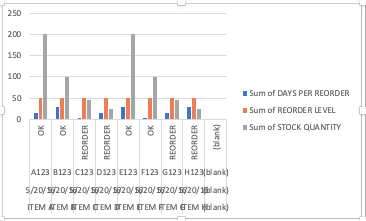
- To change the data included in your chart, select or deselect fields from the PivotChart Fields selector on the right-hand side of the chart.
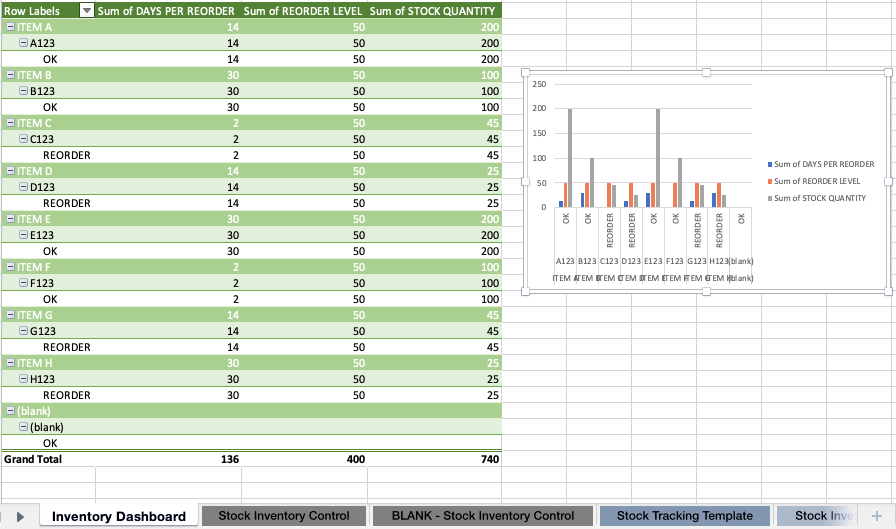
- Once you’ve customized the data included on your chart, your pivot chart is complete.
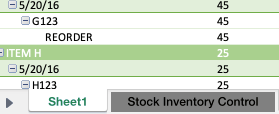
- Right-click the sheet at the bottom, click Rename, and type Inventory Dashboard.
Find more templates for equipment inventory or learn the basics of inventory management.
How to Use AI to Create Pivot Tables for an Inventory Dashboard in Excel
Once you have an Excel spreadsheet with inventory data, you can use AI to create a pivot table. Highlight the data you want to analyze and provide a prompt. The AI tool will create a pivot table and insert it into a new worksheet. Turn those tables into graphs and charts using existing Excel tools.
- Highlight the data in your inventory chart. Click the Home tab, and click the Analyze Data icon.
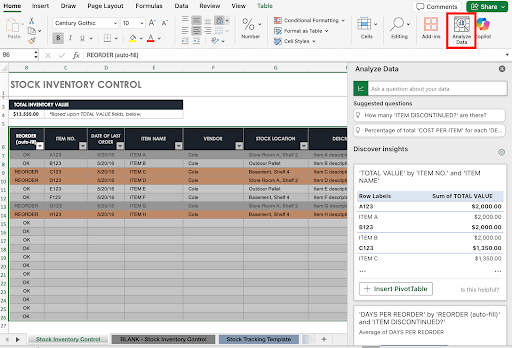
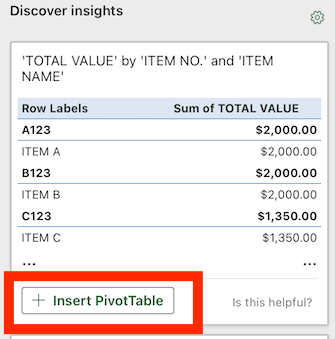
- Excel’s Copilot feature will automatically create a pivot table. Click the +Insert PivotTable button. The pivot table appears in a new worksheet.
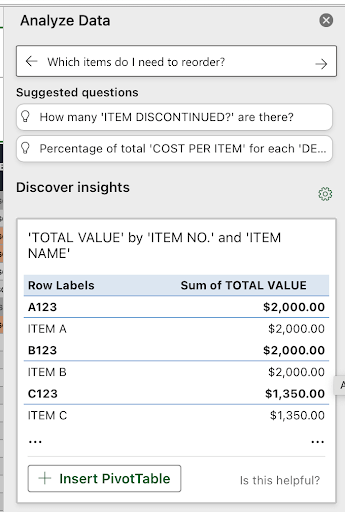
- In the Analyze Data pop-up window, type a specific question about the highlighted data. Excel will return a response with an option to create a new pivot table. Click the +Insert PivotTable button. The pivot table appears in another new worksheet.
- Copy the pivot table on Sheet2 and paste it near the first pivot table on Sheet1.
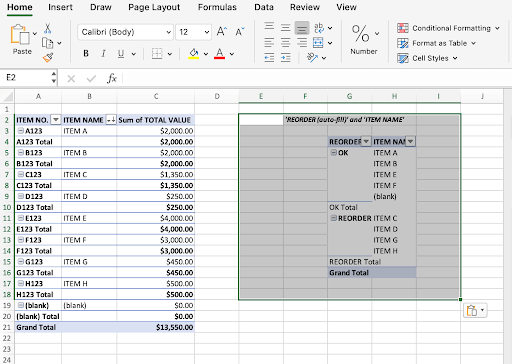
- Repeat steps 3 and 4 until you have all the pivot tables you need for a chart. Then use the tools in Excel to turn those tables into charts and graphs to build a dashboard.
How to Create an Inventory Dashboard in Google Sheets
You can use a template to build an inventory dashboard in Google Sheets. Simply enter your data and use the chart creator to build graphs and charts to populate the dashboard. The process is similar to building a dashboard in Excel.
Below, you’ll find a step-by-step how-to for creating an inventory dashboard using a template in Google Sheets.
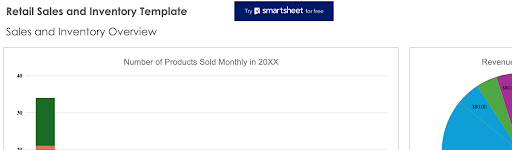
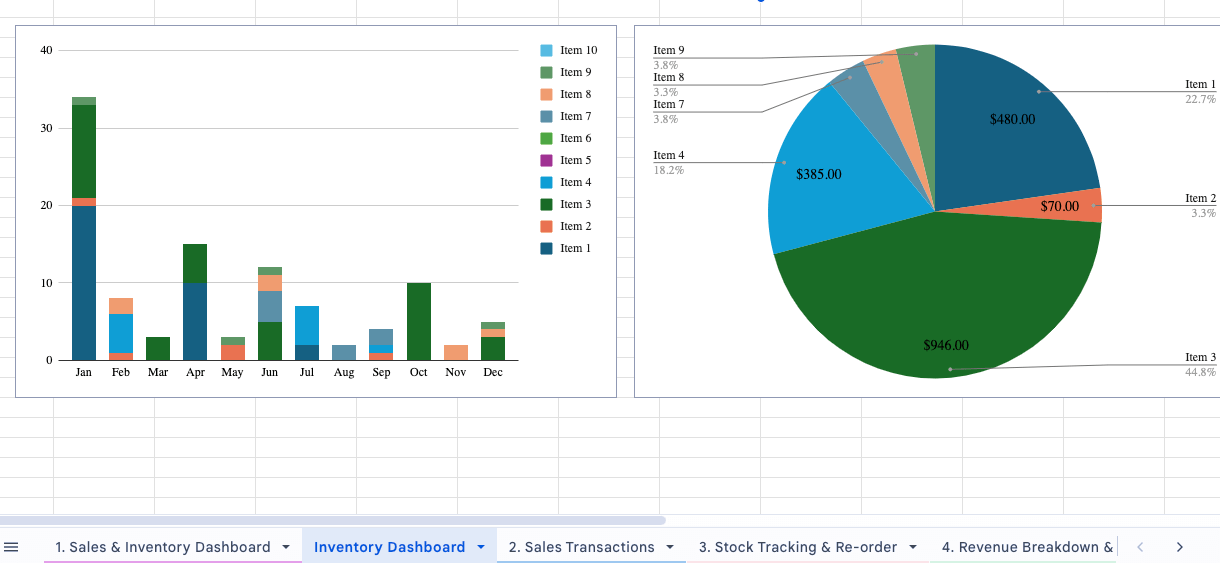
- Open the retail sales and inventory template in Google Sheets.
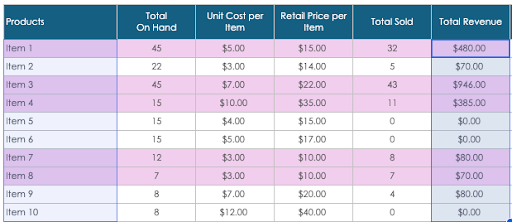
- Highlight the row with the names of your products, then hold down the Command button on Mac, or Control on PC, and click and drag down to highlight the second column of data (in this example, Total Revenue).
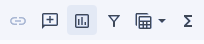
- Click the Chart icon in the top-right corner to launch the Chart editor.
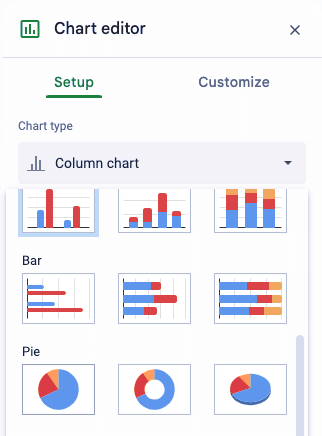
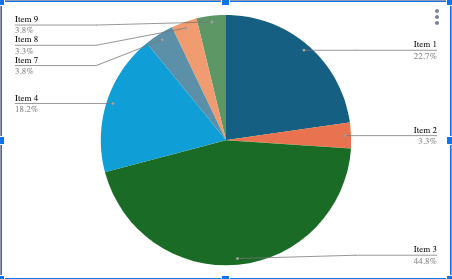
- From the drop-down menu, click Column chart and scroll down. Click the Pie chart icon.
- The chart will appear at the top of the page. Double-check that it visualizes your data correctly.
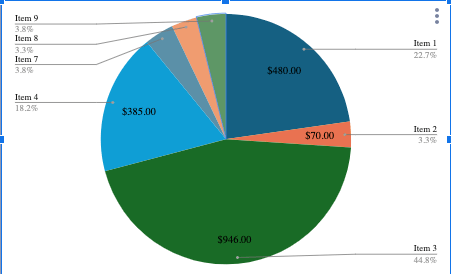
- In the Chart editor, click Customize. From the Slice label drop-down menu, click Value.
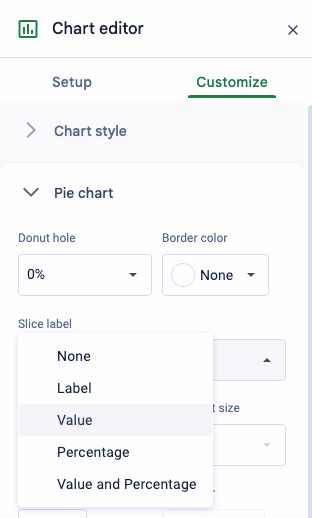
- Now your chart includes the revenue total on each slice to help you better visualize your revenue data.
- Create a bar chart with the other data table on the sheet by highlighting the data you want to include in a table. In this example, highlight the full chart.
- Click the Chart button on the upper-right of the page.
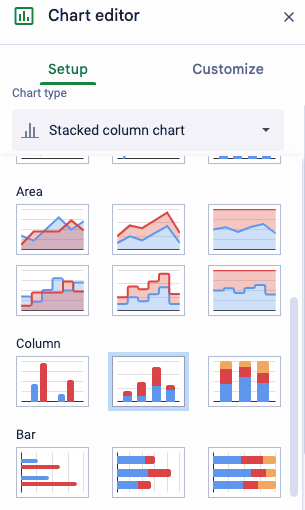
- The Chart editor will pop up. From the Chart type drop-down menu, click Stacked column chart.
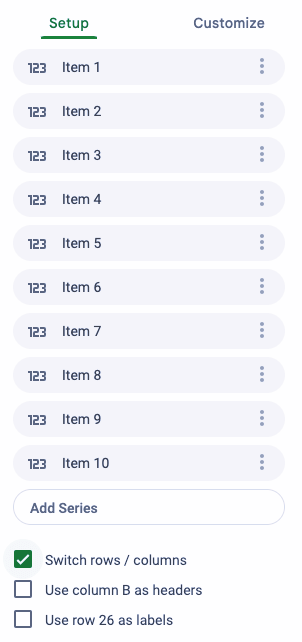
- Scroll to the bottom, and select the Switch rows/columns check box to change the chart organization of the chart so that it shows the month instead of the item name.
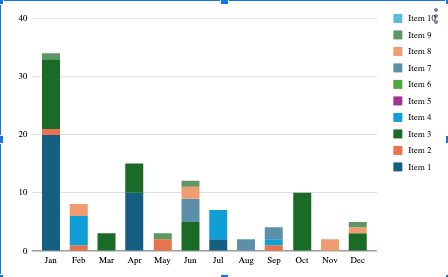
- The chart will be created at the top of your sales and inventory dashboard. Double-check to ensure that it accurately visualizes the data.
This example document already has the inventory dashboard elements provided to you, but if you want to make your own dashboard elements as we have in these steps, you could create a separate worksheet containing all of your elements separate from the page with your data.
- Click the plus sign button on the bottom of the page to create a new Inventory Dashboard Worksheet tab.
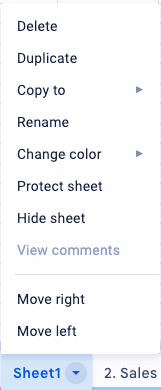
- Right-click the new sheet, click Rename, and name it Inventory Dashboard.
- Go to the sheet where you made the tables and charts. Click your chart or table and copy them. Go back to your new Inventory Dashboard worksheet and paste them.
Find more Google Sheets inventory templates for different industries.
Examples of Inventory Dashboards
Below are some examples of inventory dashboards, such as an inventory KPI dashboard, a retail inventory dashboard, and an inventory management dashboard.
Inventory KPI Dashboard

Dheerendra Mishra is a strategic operations leader at Johnson Controls. He suggests that you use pivot tables, charts, and drop-down lists for your inventory dashboard, and to track metrics such as current stock levels, reorder points, days of supply, inventory turnover rate, low stock alerts, and product categories.
His ideal dashboard layout would include KPIs, such as total inventory value, total sales, and low stock count, as well as a section with drop-down lists for product category, vendor, and more; a section with pivot tables and charts that show stock levels, sales trends, and low stock alerts; and a section with detailed inventory data tables.
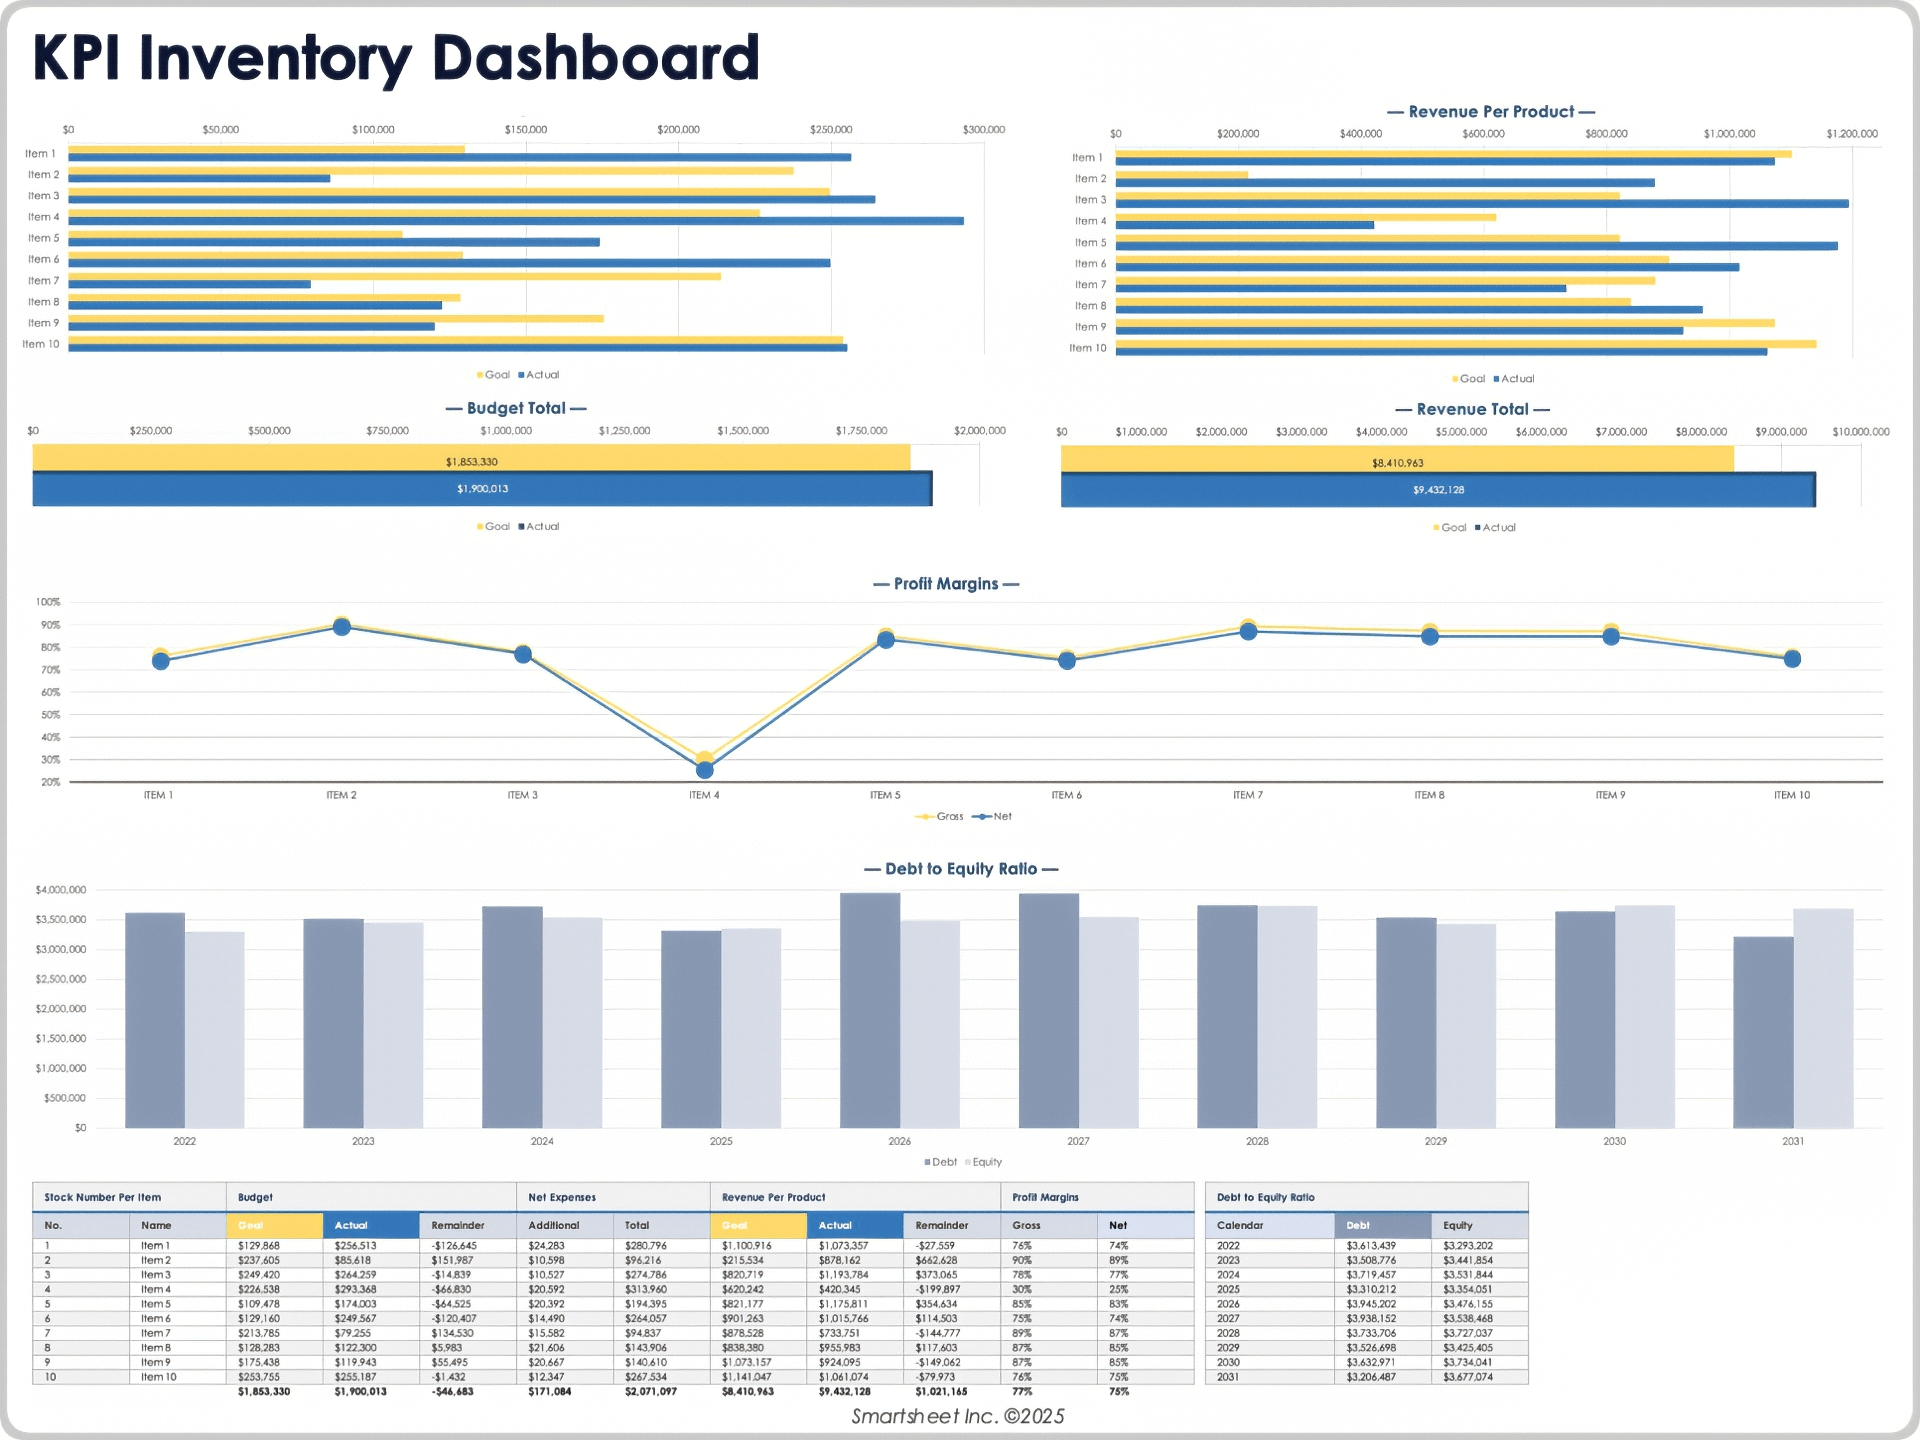
Download the KPI Dashboard for
Excel
| Google Sheets
Use this inventory KPI dashboard template to track the key performance indicators of your inventory data and to track the health of your inventory and revenue flow. You can create a graph that shows the profit margin for each item, a table with the stock numbers per item, or a table of the revenue per product.
Check out these free excel inventory templates for more useful documents and information.
Retail Inventory Dashboard
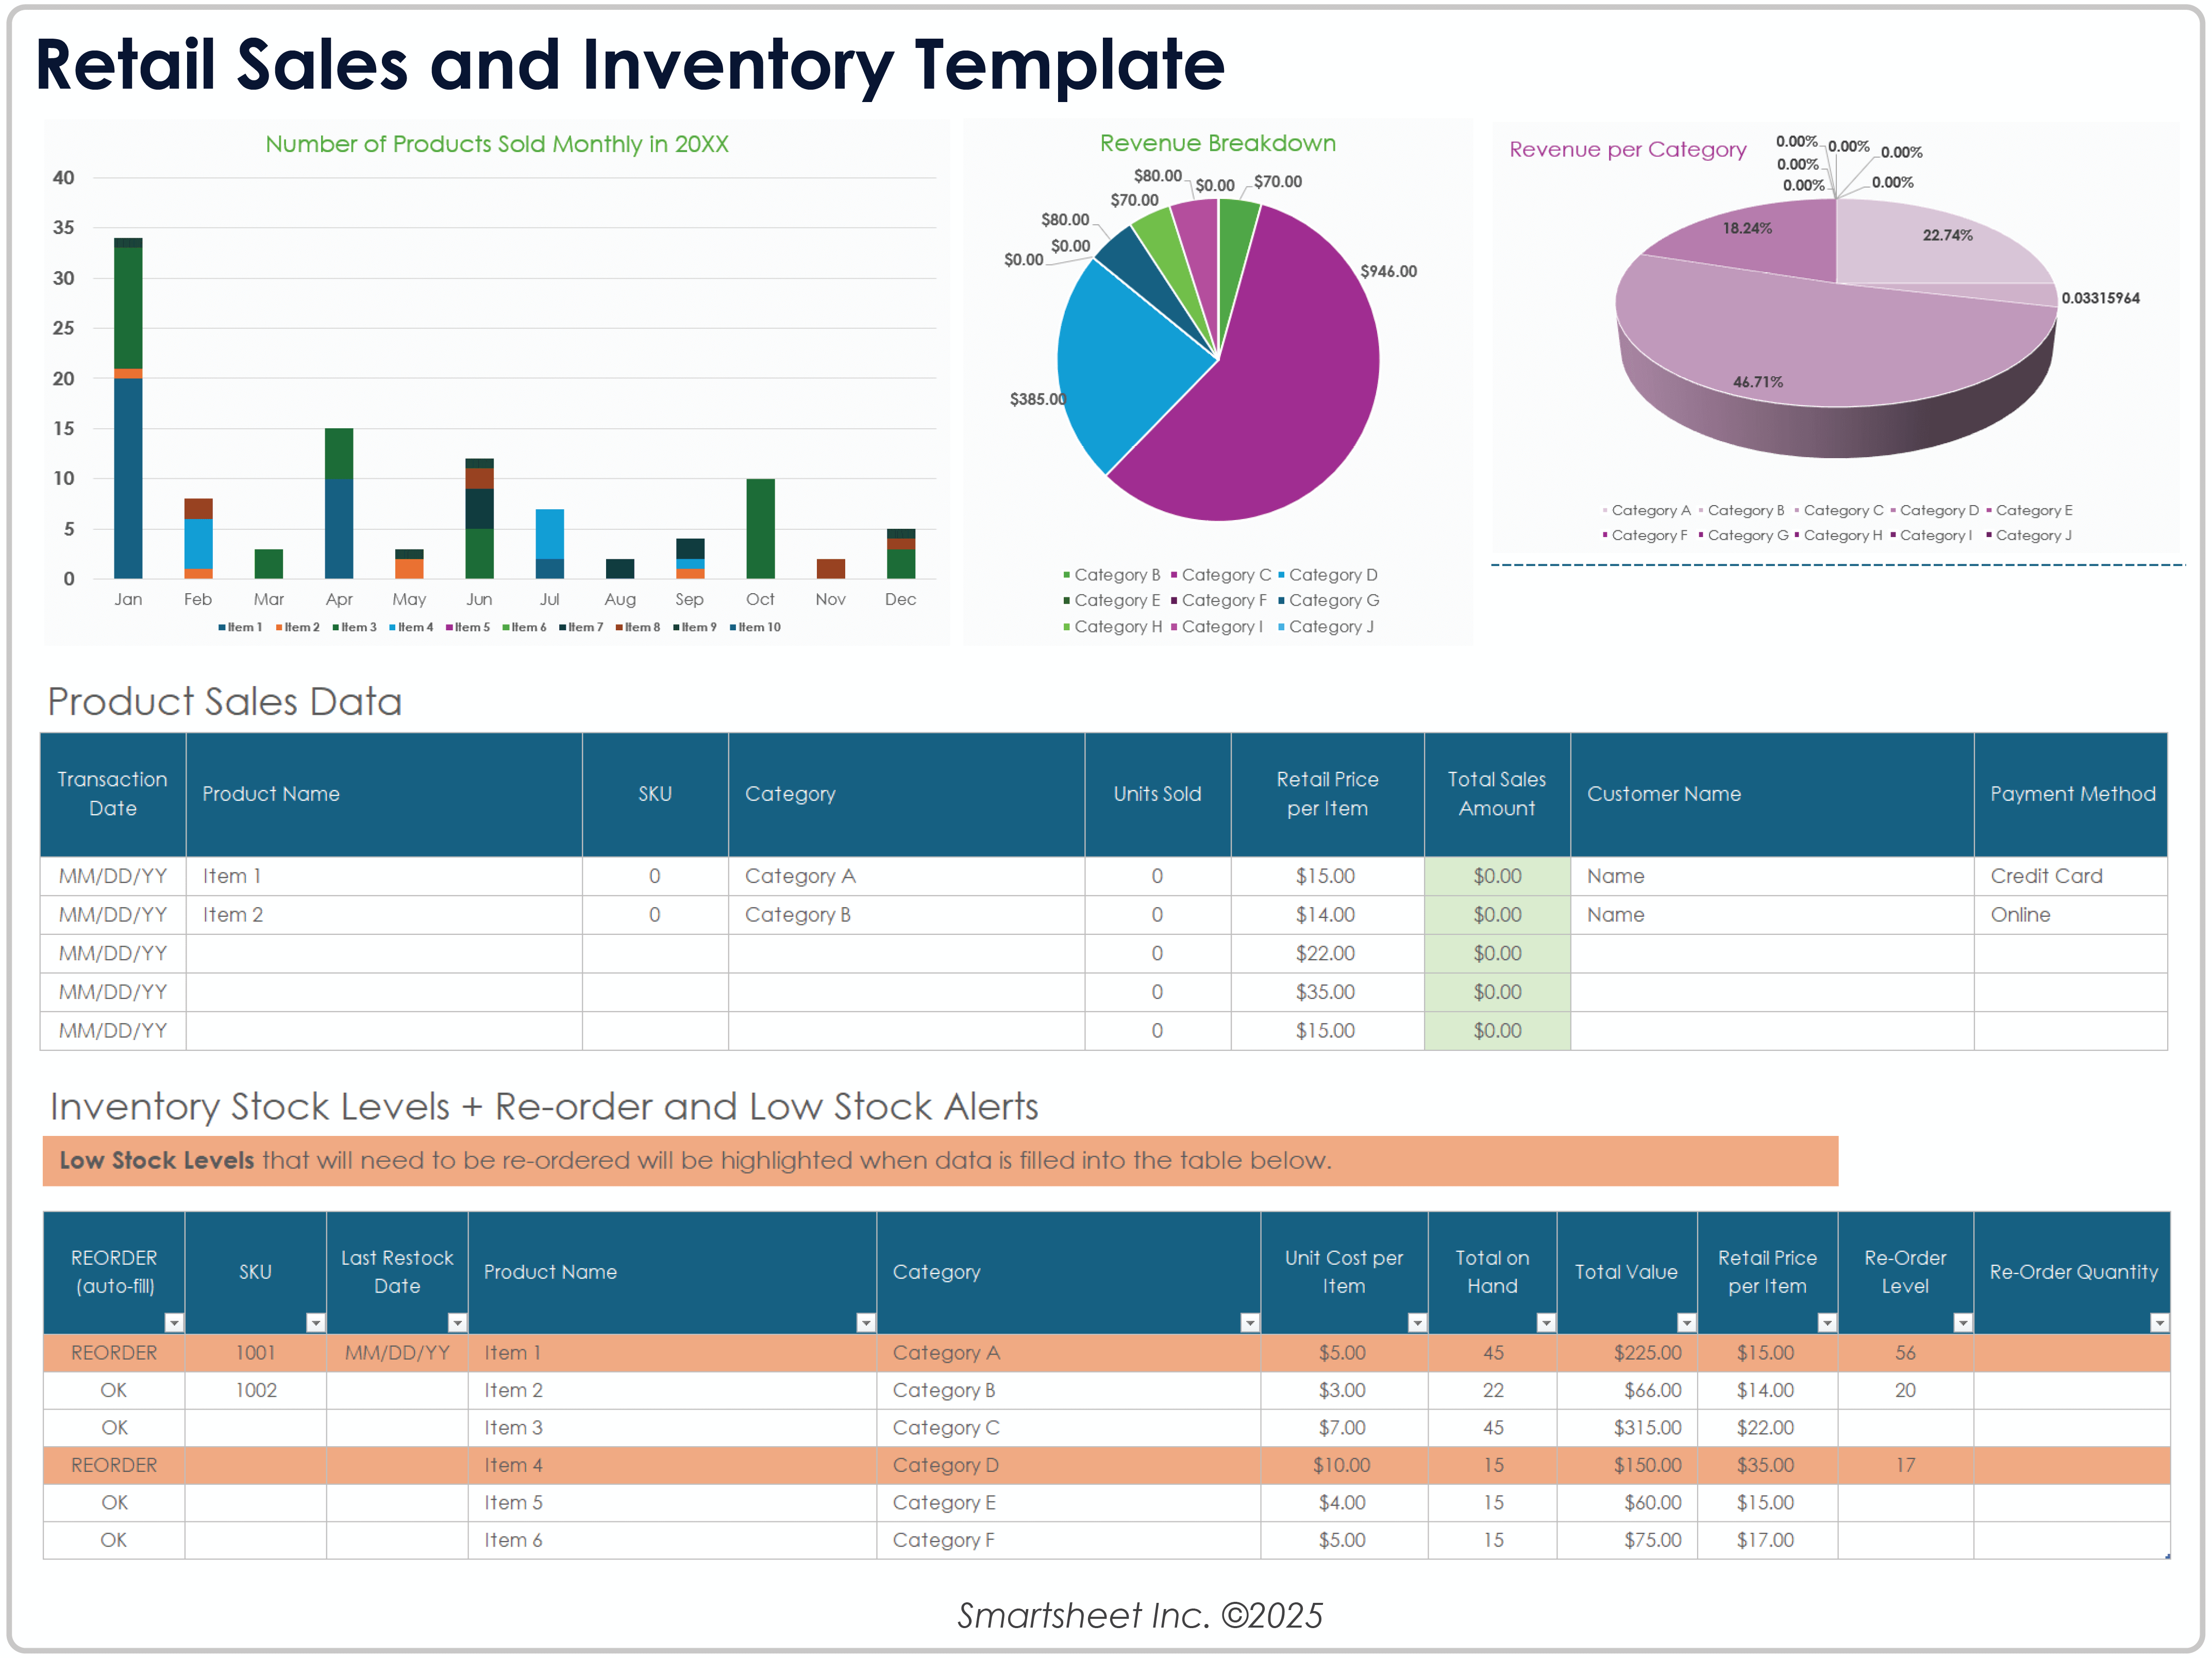
Download the Retail Sales and Inventory Template for Excel
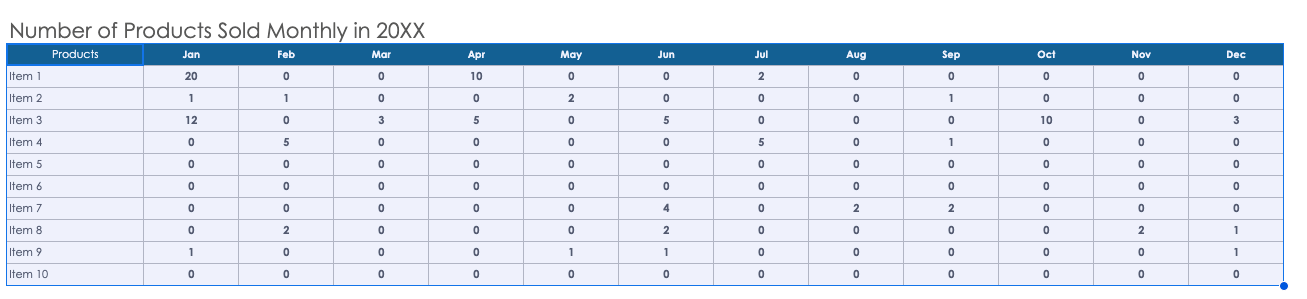
Use this retail inventory dashboard to track all your retail inventory information and create a visualization of key information summaries. The template allows you to create a graph of the number of products sold monthly or a pie chart of the revenue per item.
For more resources and information, see this collection of retail inventory management templates.
Inventory Management Dashboard
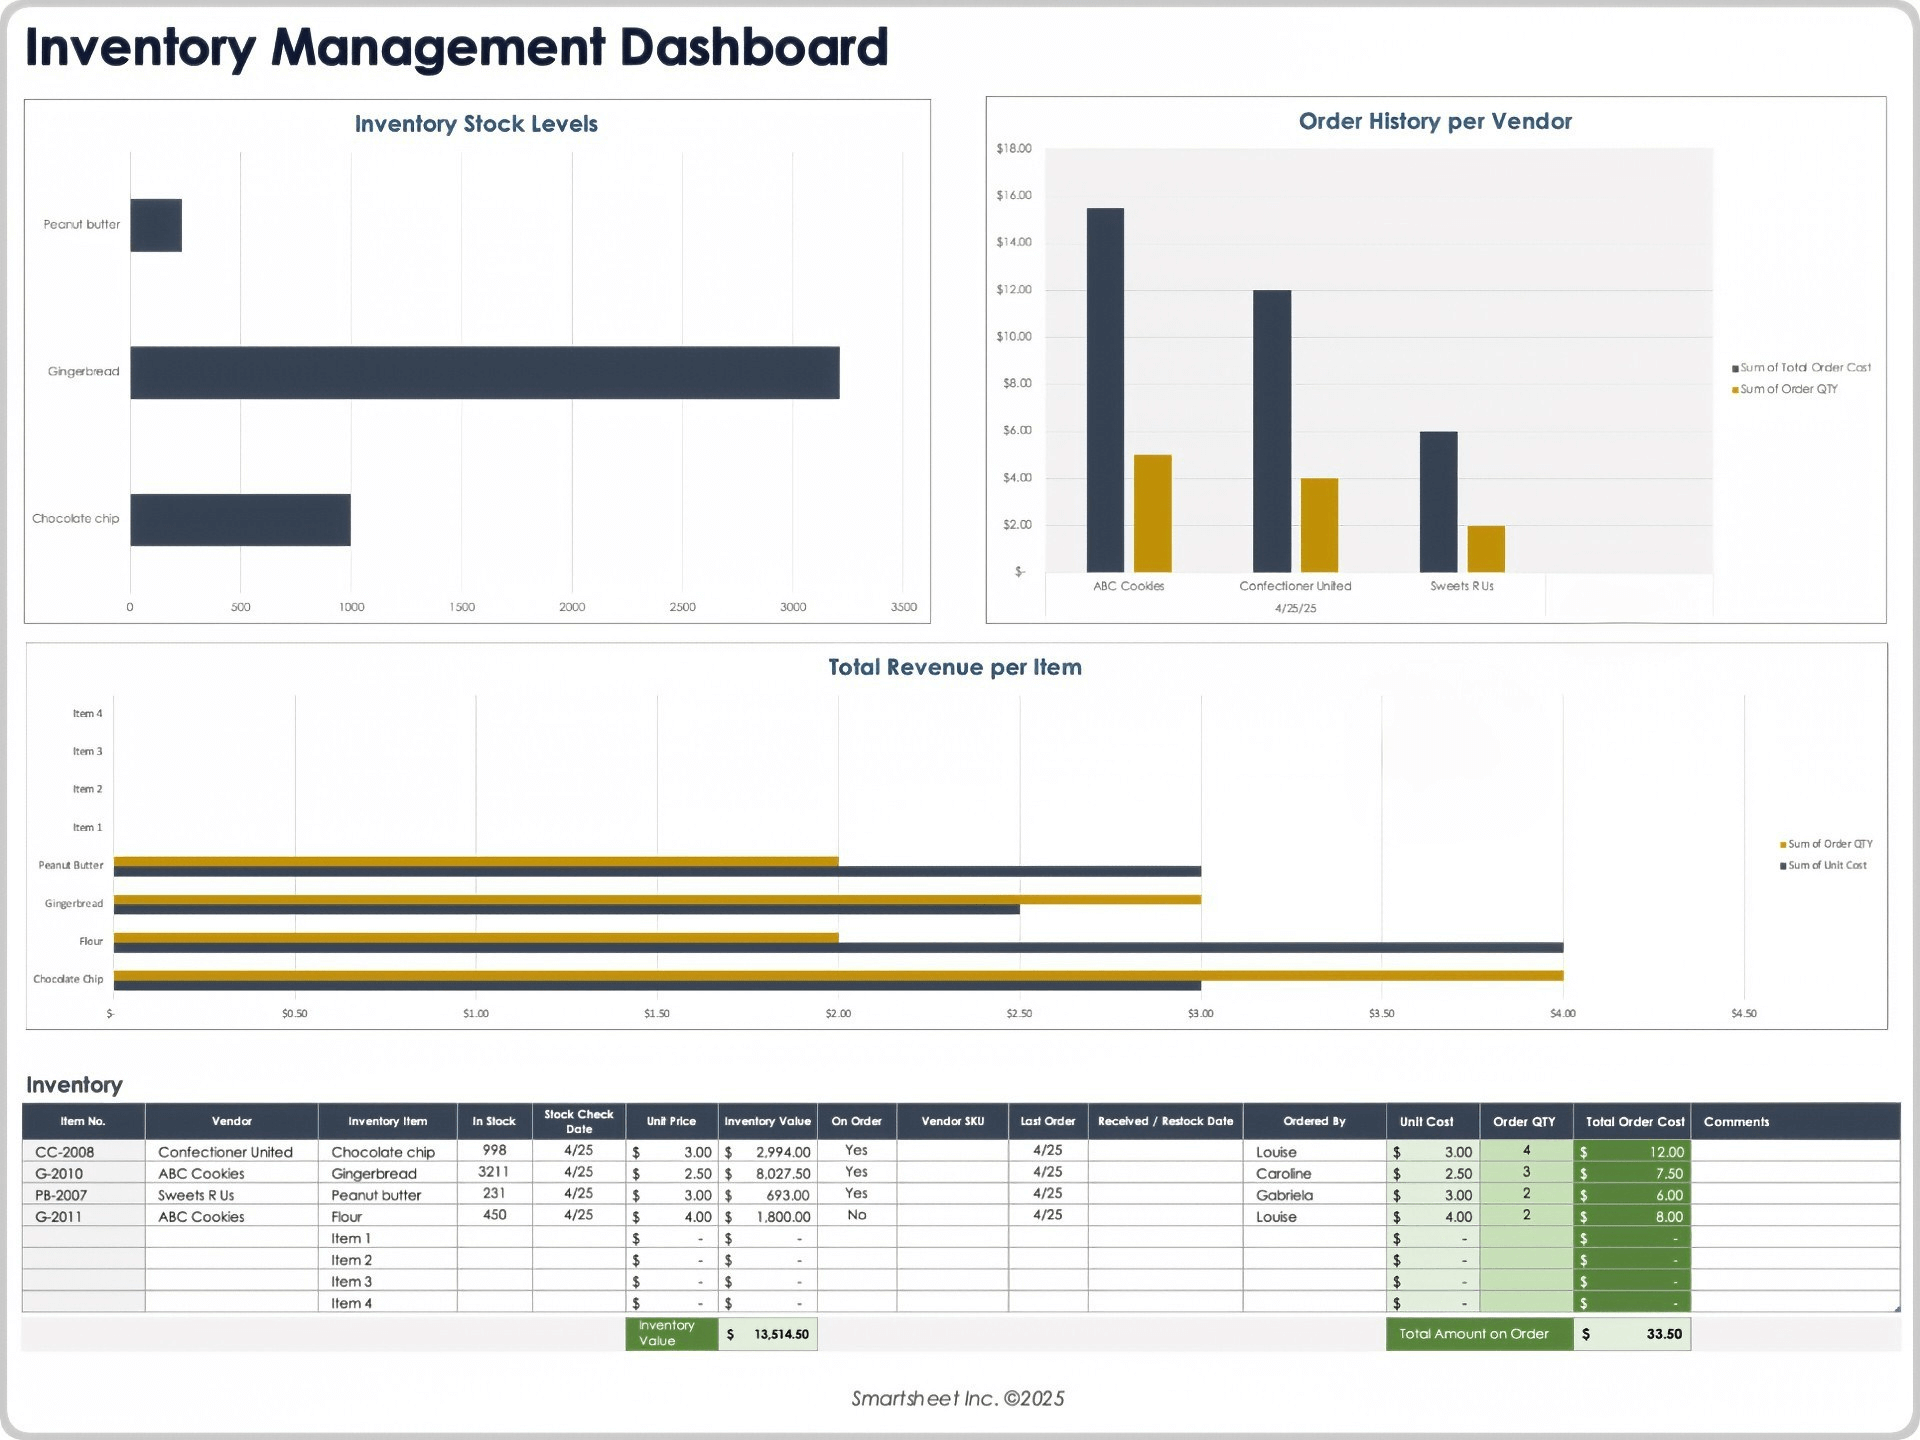
Download the Inventory Management Dashboard for
Excel
| Google Sheets
This inventory management dashboard visualizes your current inventory, order history, and new order requests. Use this dashboard when you want to see a table of your current inventory stock levels, the order history per vendor, and the total revenue per item.
How to Create an Inventory Dashboard in Smartsheet
In Smartsheet, you can create real-time inventory dashboards that alert you when stock is low and that automate your workflows. Start by opening and adding your data to the inventory management tracking sheet template.
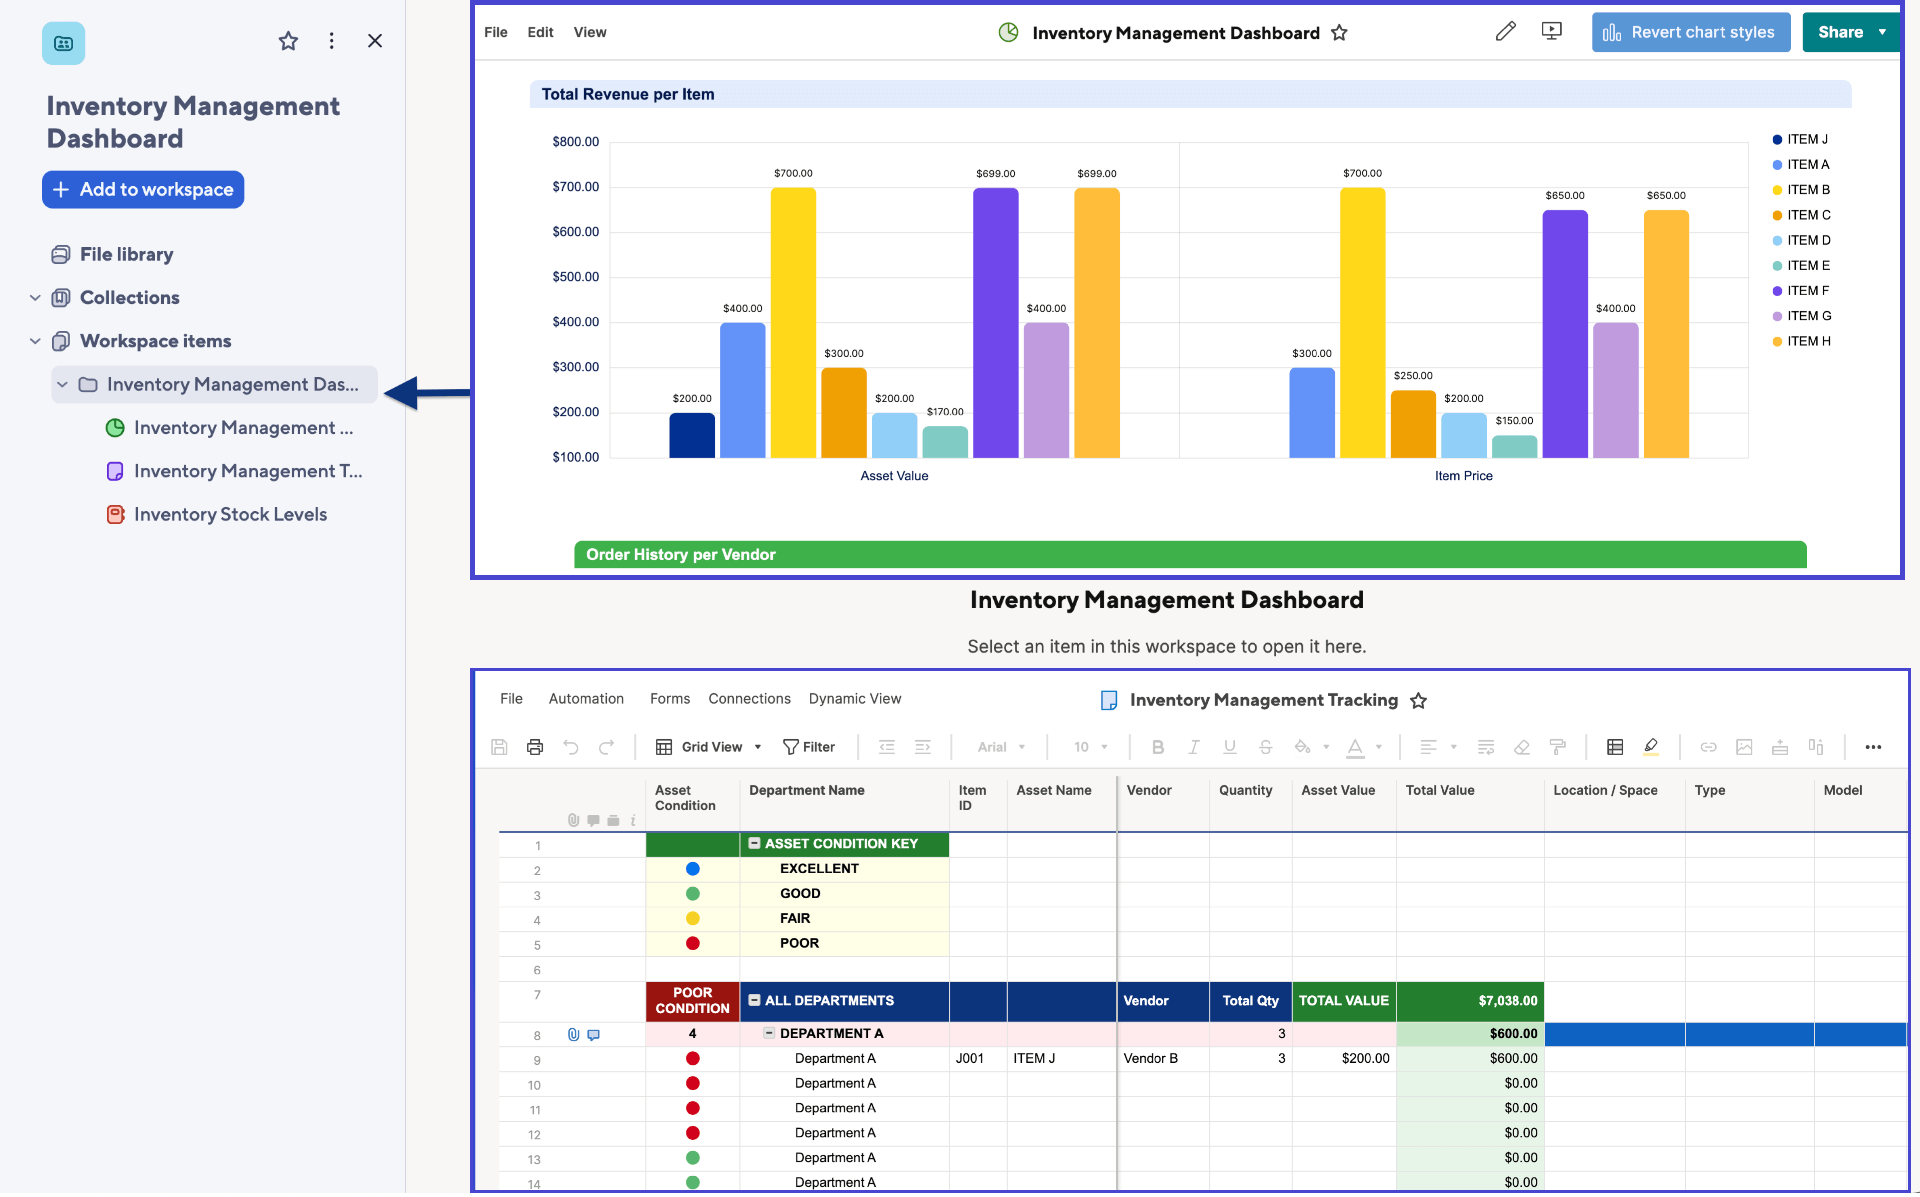
The data collected in this sheet will automatically populate this inventory management dashboard in Smartsheet. As data changes in the inventory management tracking sheet it will be reflected on this dashboard in real time.
To make tracking inventory easier, team members can simply complete the included inventory tracking form. Any data collected through this form will be added to the bottom of the inventory management tracking sheet, which will automatically be reflected in the inventory dashboard.
Create Powerful Inventory Dashboards for Real-Time Work Management in Smartsheet
Empower your people to go above and beyond with a flexible platform designed to match the needs of your team — and adapt as those needs change.
The Smartsheet platform makes it easy to plan, capture, manage, and report on work from anywhere, helping your team be more effective and get more done. Report on key metrics and get real-time visibility into work as it happens with roll-up reports, dashboards, and automated workflows built to keep your team connected and informed.
When teams have clarity into the work getting done, there’s no telling how much more they can accomplish in the same amount of time. Try Smartsheet for free, today.