Why Visibility Matters in Resource Allocation
Having visibility into your team members’ capacity is crucial for successful and on-time execution. Visibility helps teams stay proactive and allows managers to identify potential bottlenecks before they derail progress, rebalance workloads, and set appropriate expectations with stakeholders.
As a team leader, you’ve likely already built detailed schedules, aligned on capacity plans, and assigned work thoughtfully. But execution requires more than planning. Without transparent tracking and visibility, resource allocation quickly becomes guesswork instead of a data-driven process. Priorities or workloads shift, and you're suddenly dealing with scheduling conflicts, overwhelmed team members, or missed deadlines.
The result is a smoother path from planning to delivery, one where teams stay aligned, focused, and confident in their ability to execute.
You can be a team lead juggling day-to-day execution, a project manager coordinating cross-functional projects, or a resource manager keeping staffing aligned with business goals. In all these cases, visibility helps you gain control, clarity, and confidence in how your team operates.
Common Challenges in Resource Allocation Visibility
Common challenges to getting visibility into resource allocation include having siloed data, using outdated tools, and lacking real-time updates, a high-level view, or strong visualizations.
Below, we provide more detail on each of these common roadblocks and offer solutions. These tips are especially useful for teams as they grow or start managing multiple projects simultaneously.
- Challenge: Siloed Data and Discontinued Tools: One of the most common blockers of visibility is data being scattered across too many tools. Without a centralized view that pulls in data from all your tools, resource planning happens in isolation and no one has an understanding of the bigger picture.
Solution: Bring all your project and resource data together in one place. Resource Management by Smartsheet gives you a unified workspace to plan, allocate, and track resources, so you can move from silos to shared visibility. When everyone works from a single source of truth, planning and collaboration get easier and smarter.
- Challenge: Lack of Real-Time Updates: When teams update resource allocation data manually and irregularly, they are automatically working with outdated information. This means that by the time you spot a problem, project outcomes have already been affected.
Solution: Use live dashboards and automated reports to surface real-time insights. By connecting your project schedules and staffing plans to reporting dashboards with Smartsheet, you’ll ensure that you always have current data on capacity, allocation, and workload distribution at your fingertips.
- Challenge: No Portfolio-Level View: It’s important to have visibility across your entire portfolio when managing multiple projects at once. Without portfolio-level visibility, you can’t spot trends, anticipate conflicts, or prioritize strategically.
Solution: Layer in portfolio-level dashboards and reports that can be grouped by team, project, or role. These different views in Smartsheet help you track allocation across the organization, spot resourcing patterns, and quickly provide data-backed answers to questions from leadership.
- Challenge: Poor Visualization of Capacity and Workload: It’s much easier to make informed decisions from your data with visuals. Even so, static spreadsheets and Gantt views don’t always reveal imbalances clearly enough to take the right actions.
Solution: Heatmaps and visual workload reports in Smartsheet show how booked or available your resources are, color-coded and filterable by team, time frame, or project. They provide a fast, real-time, intuitive way to spot over- and underutilization or project-resource mismatches at a glance.
Actionable Strategies to Improve Resource Allocation Visibility
You can take concrete steps to improve visibility into resource allocation. To do so, centralize planning, use portfolio-level dashboards to track trends, incorporate heatmaps, and create reports by group, project, and role.
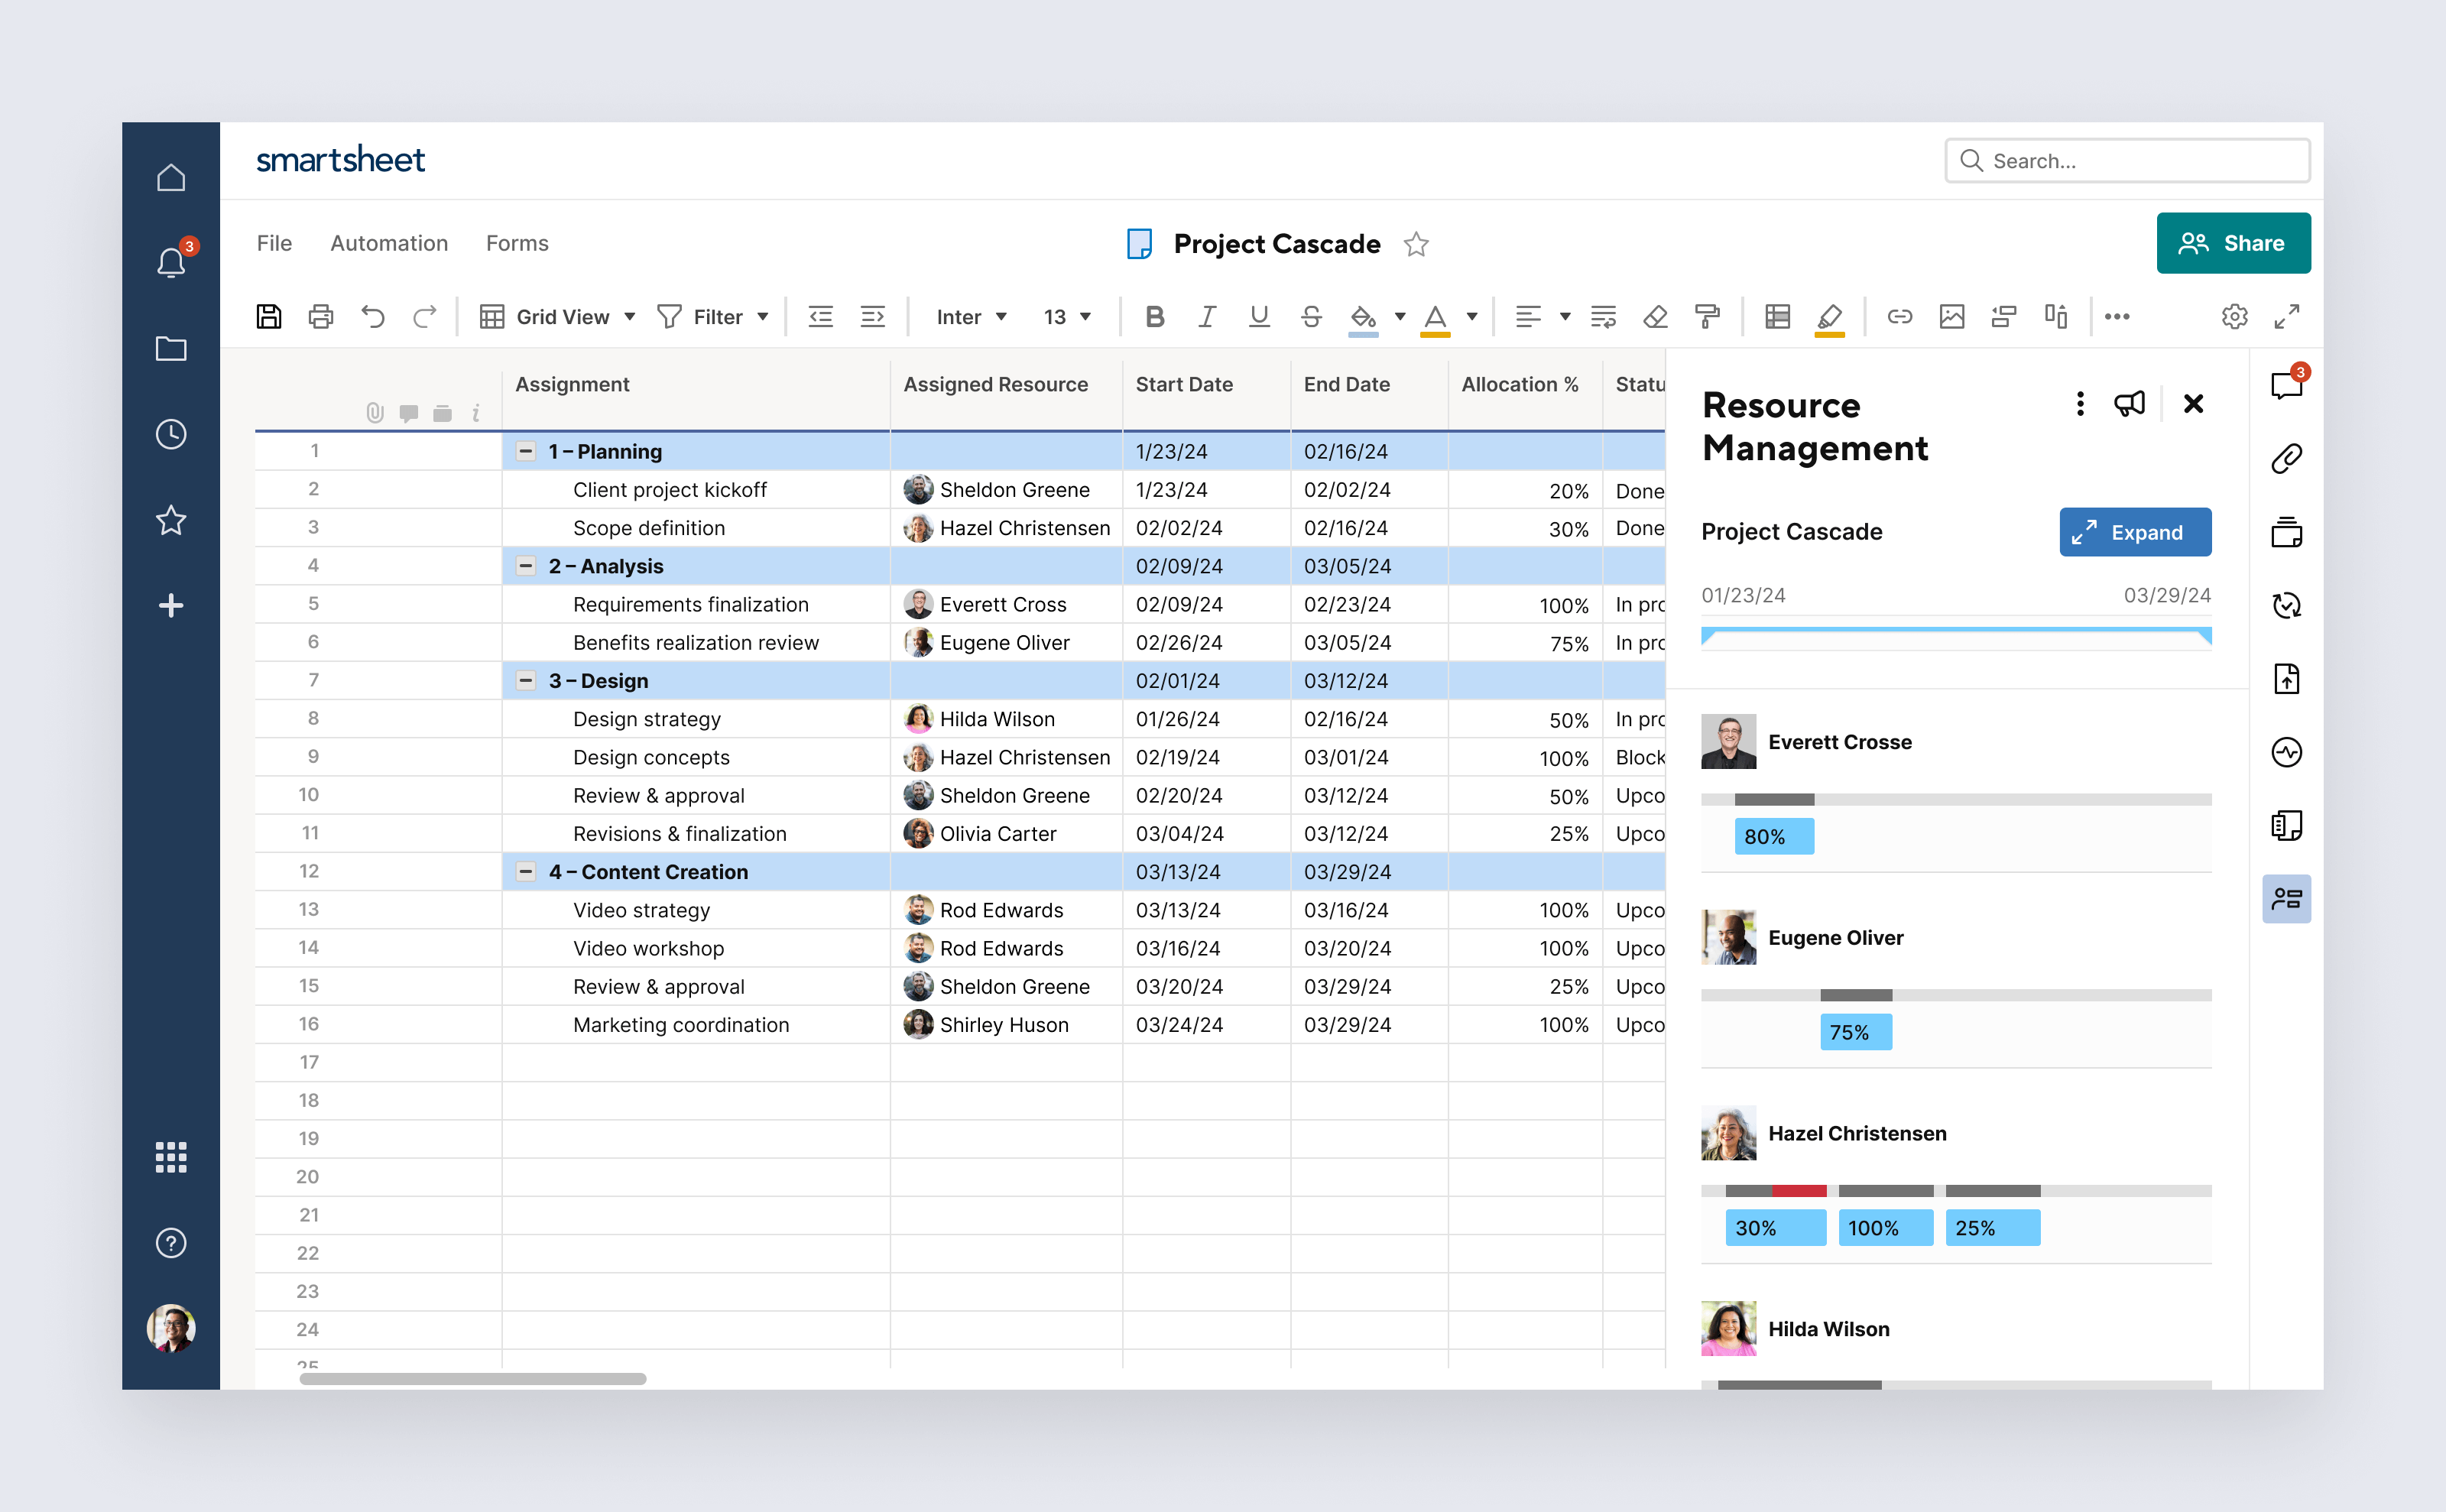
Centralize Planning With Resource Management
When data lives in multiple, disconnected tools — project plans and schedules in one place, resource allocation in another — teams can’t get accurate visibility into their work. By centralizing all of this data in a single location, teams get a shared source of truth that connects staffing decisions directly to real-time project execution.
For example, imagine the planning for a product launch. With a centralized system, you’d have visibility into your senior developer’s bandwidth before assigning them work. Let’s say they’re already booked 90 percent on another project. With this information, you can either shift timelines or assign the work to a different developer, all before the conflict causes confusion and delays.
With Resource Management by Smartsheet, you can close the gap between planning and execution by quickly getting insight into the following:
- Who’s working on what, and when
- How much time they’re committed to across all projects
- What their actual capacity is (based on working hours, time off, etc.)
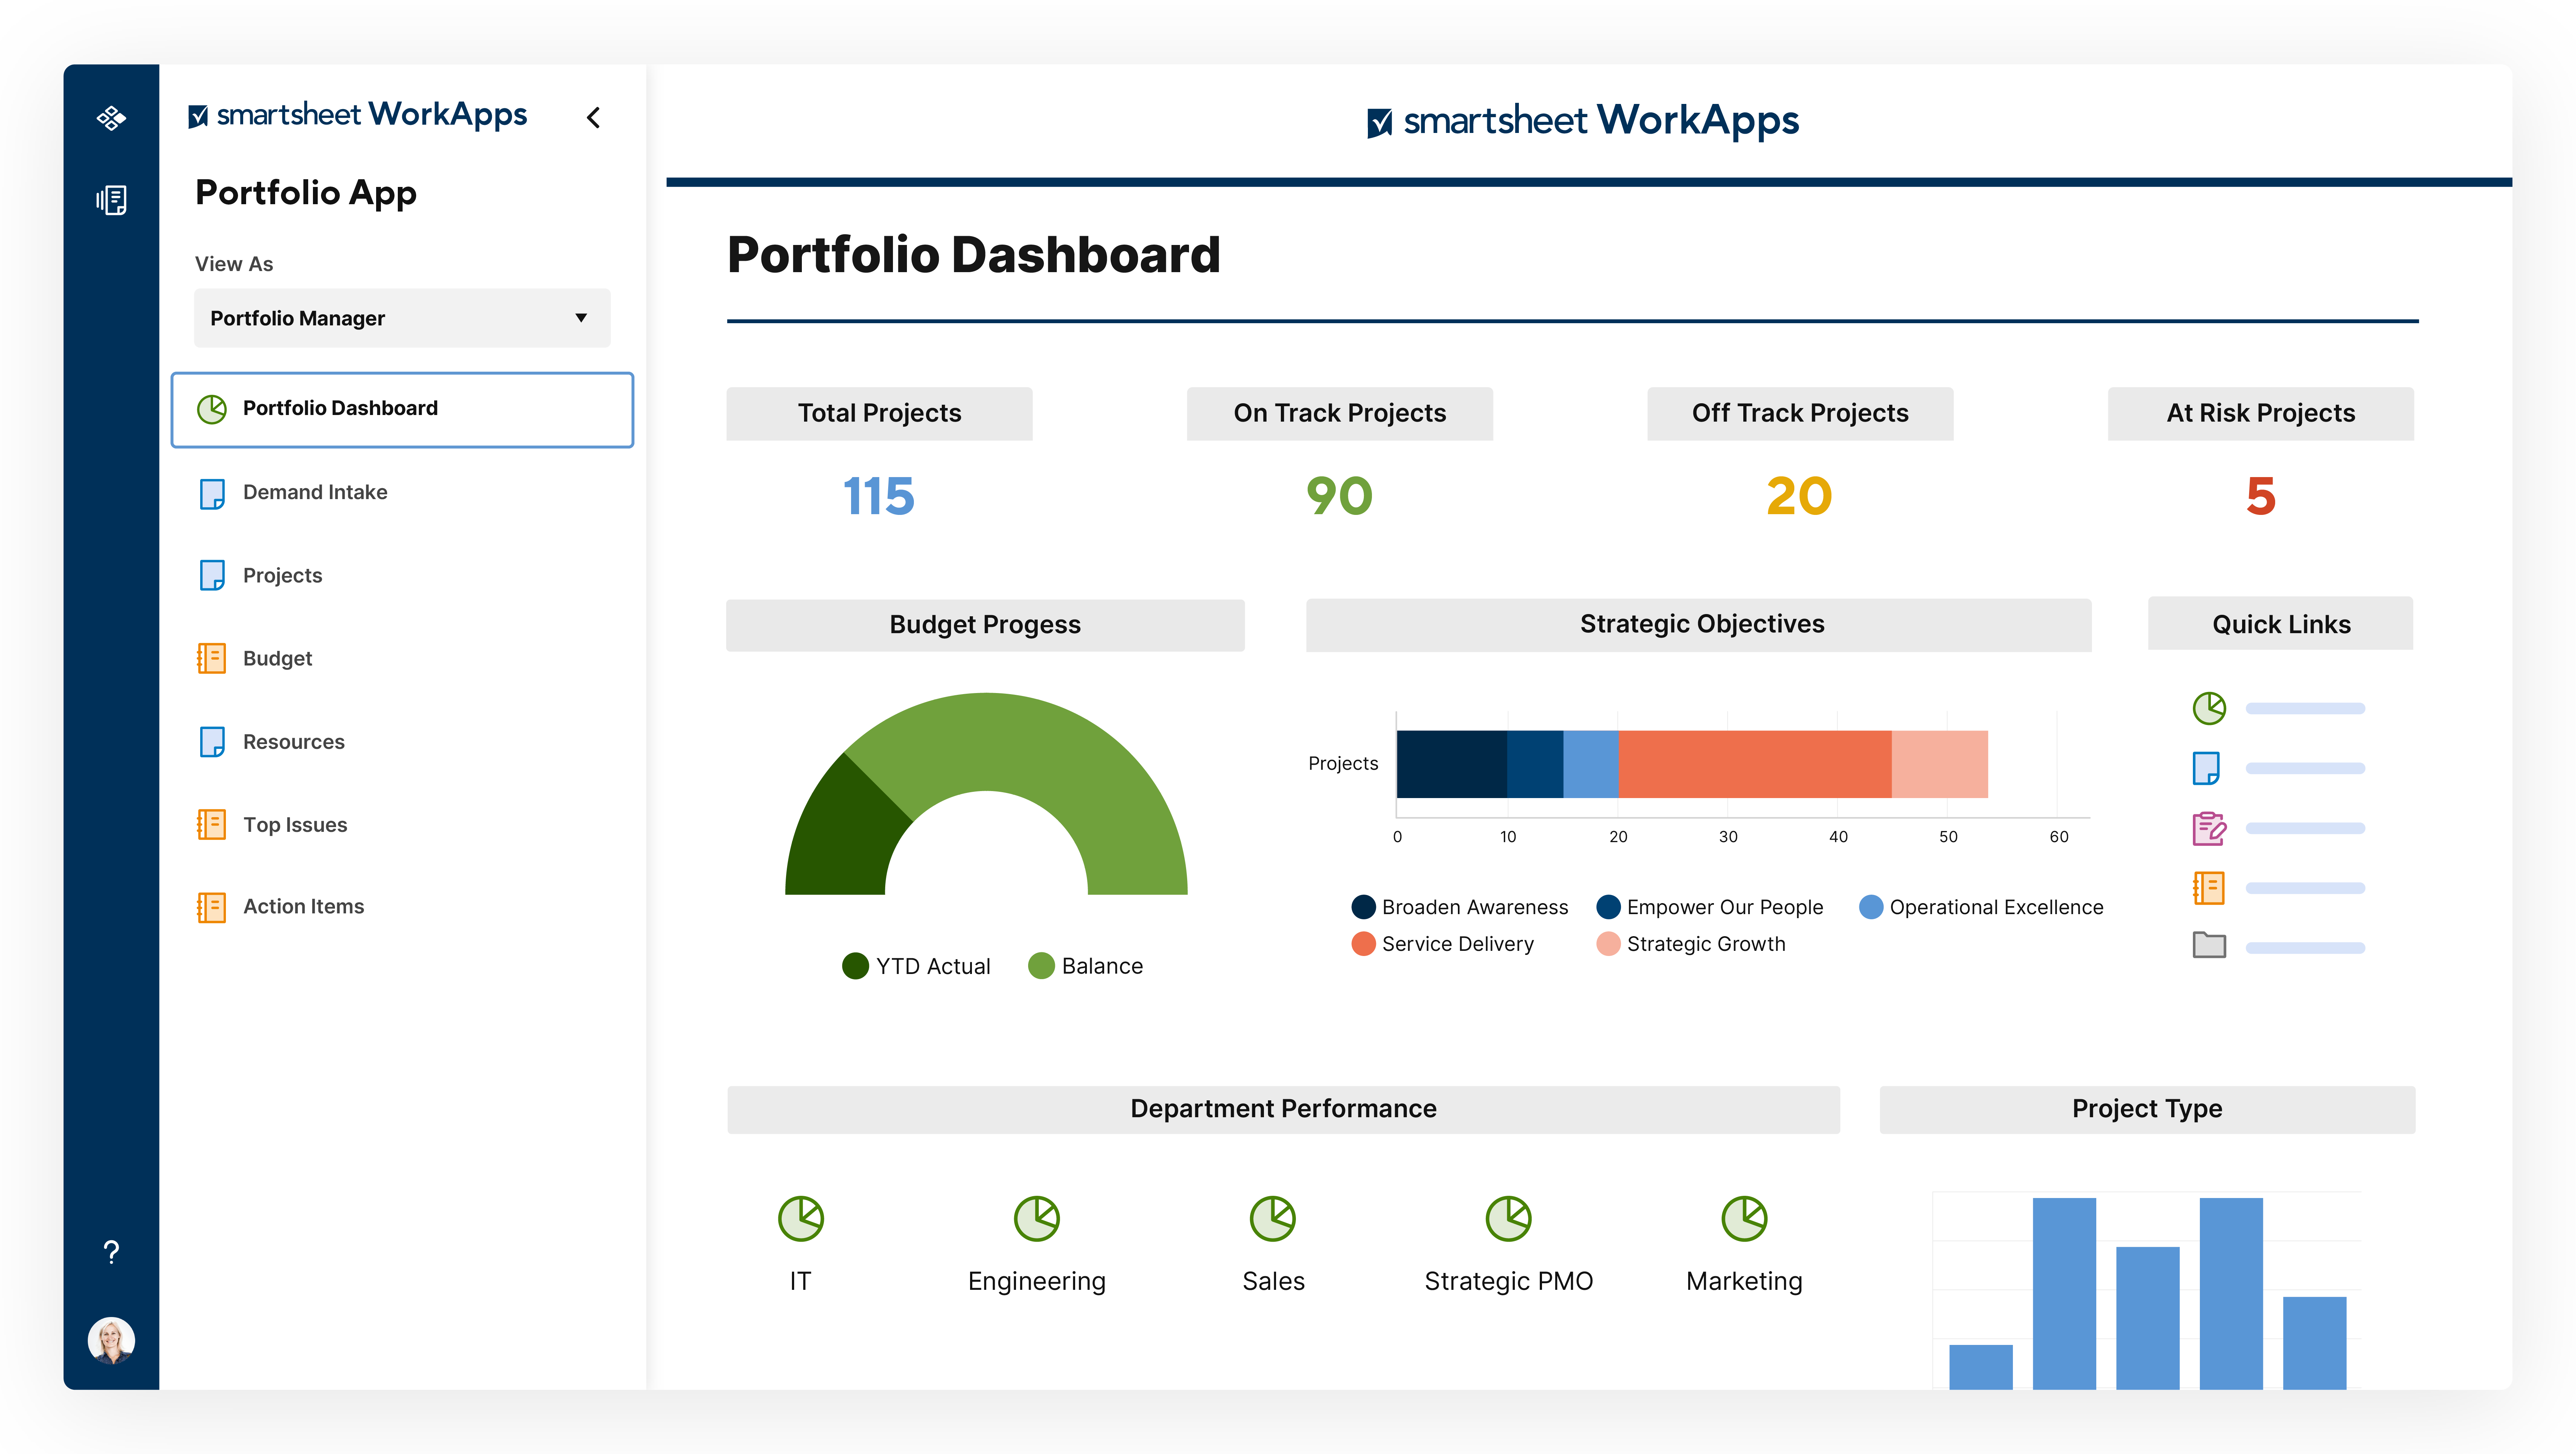
Use Portfolio-Level Dashboards to Track Allocation Trends
Without a portfolio-level perspective, you’ll miss widespread patterns and trends. Portfolio-level dashboards provide a high-level view of resourcing across all projects and the ability to quickly provide leadership with customized real-time insights.
For example, if a department lead wants to know whether their design team can support two upcoming campaigns, a shared dashboard that shows current allocation across ongoing and planned work will make it immediately clear if additional support will be needed.
Smartsheet dashboards enable you to connect multiple projects into a visual control center where you can do the following:
- Track total hours allocated across all active projects.
- Monitor capacity versus demand by department or role.
- Bring attention to KPIs, such as overallocated team members or unassigned tasks.
- Drill into metrics by project owner, timeframe, or priority level.
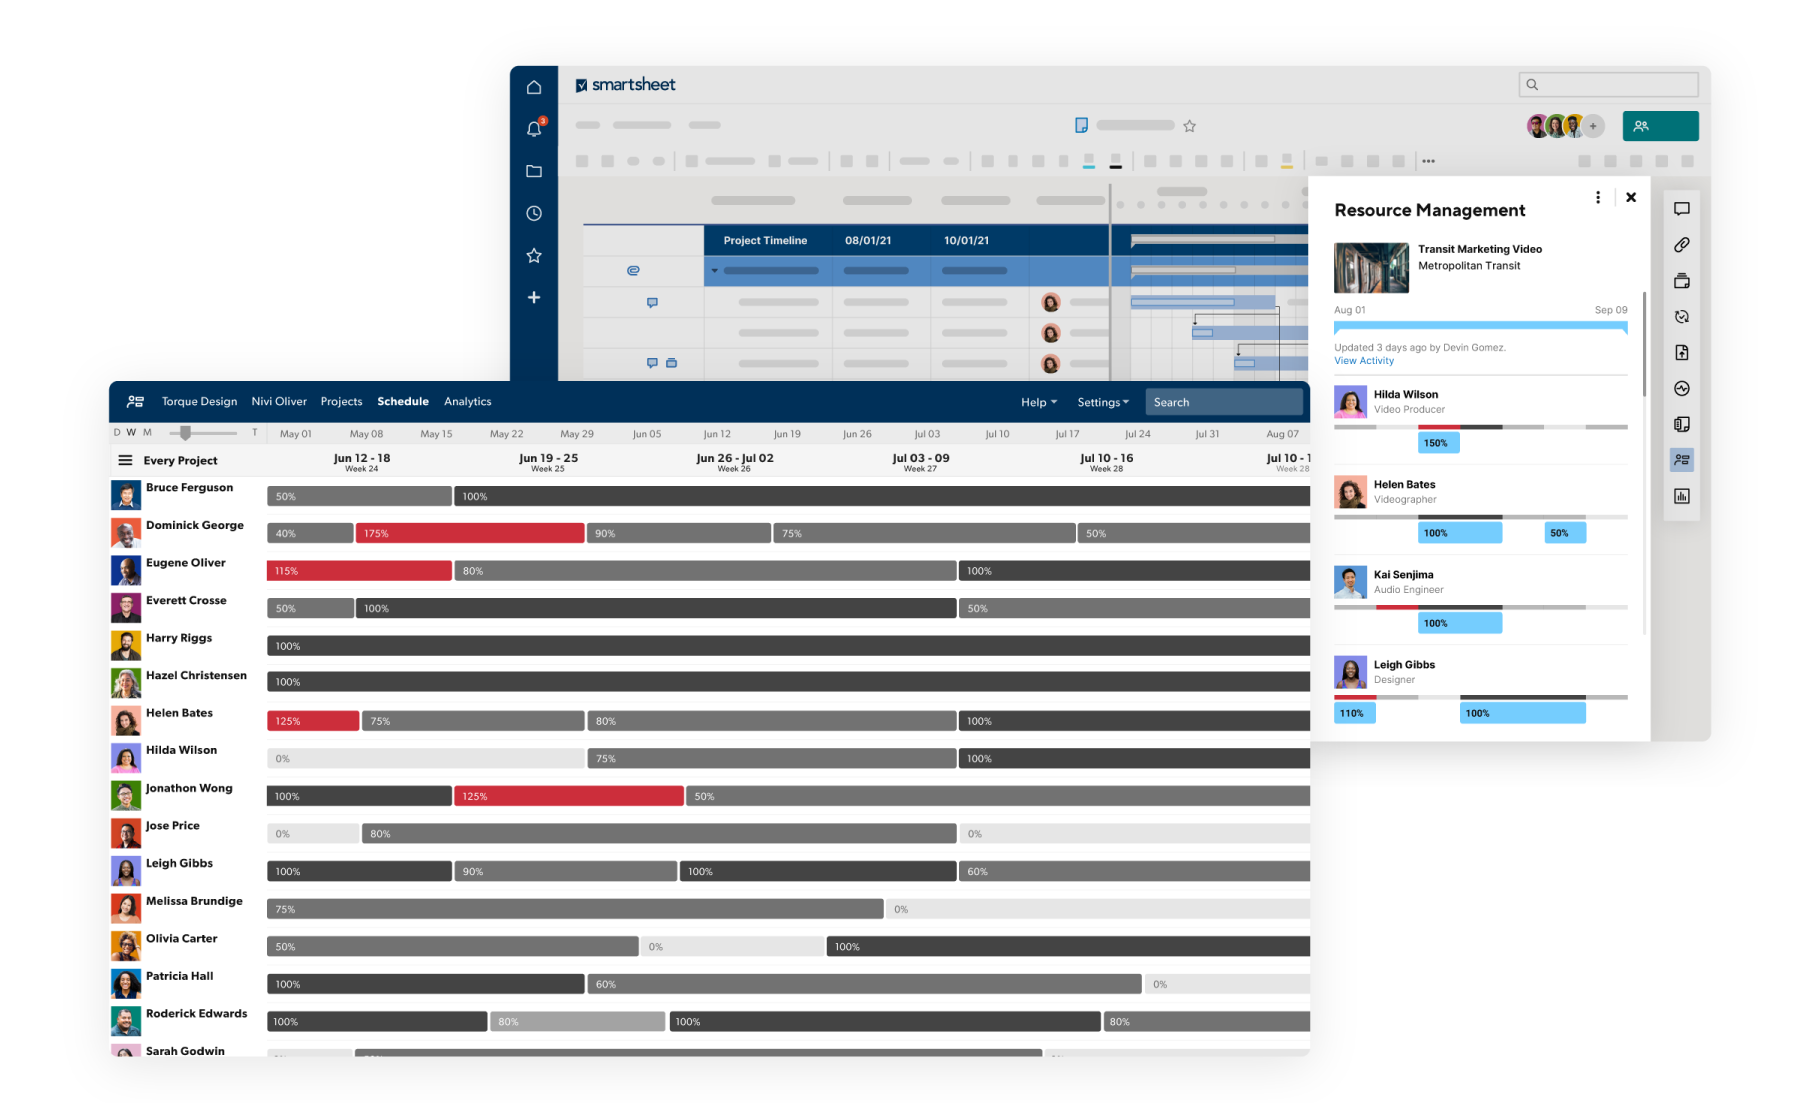
Visualize Capacity With Allocation Heatmaps
Prolonged overallocation can go unnoticed in siloed spreadsheets. Over time, this leads to burnout and resourcing issues. Heatmaps not only make over- and underallocation issues more visible, but they also increase confidence in staffing and hiring decisions, which helps prevent burnout and capacity challenges down the line.
Picture this: Your QA team lead wants to know why deadlines keep slipping. Pull up a heatmap to show that the testers have been consistently overallocated for four weeks and likely burned out.
In Smartsheet, color-coded allocation heatmaps give you a time-based snapshot of resource capacity. Red typically indicates overallocation, yellow indicates nearing capacity, and green indicates availability or underallocation.
You can also filter heat maps by week or month, project or team, role or team member, and billable or nonbillable hours (if applicable).
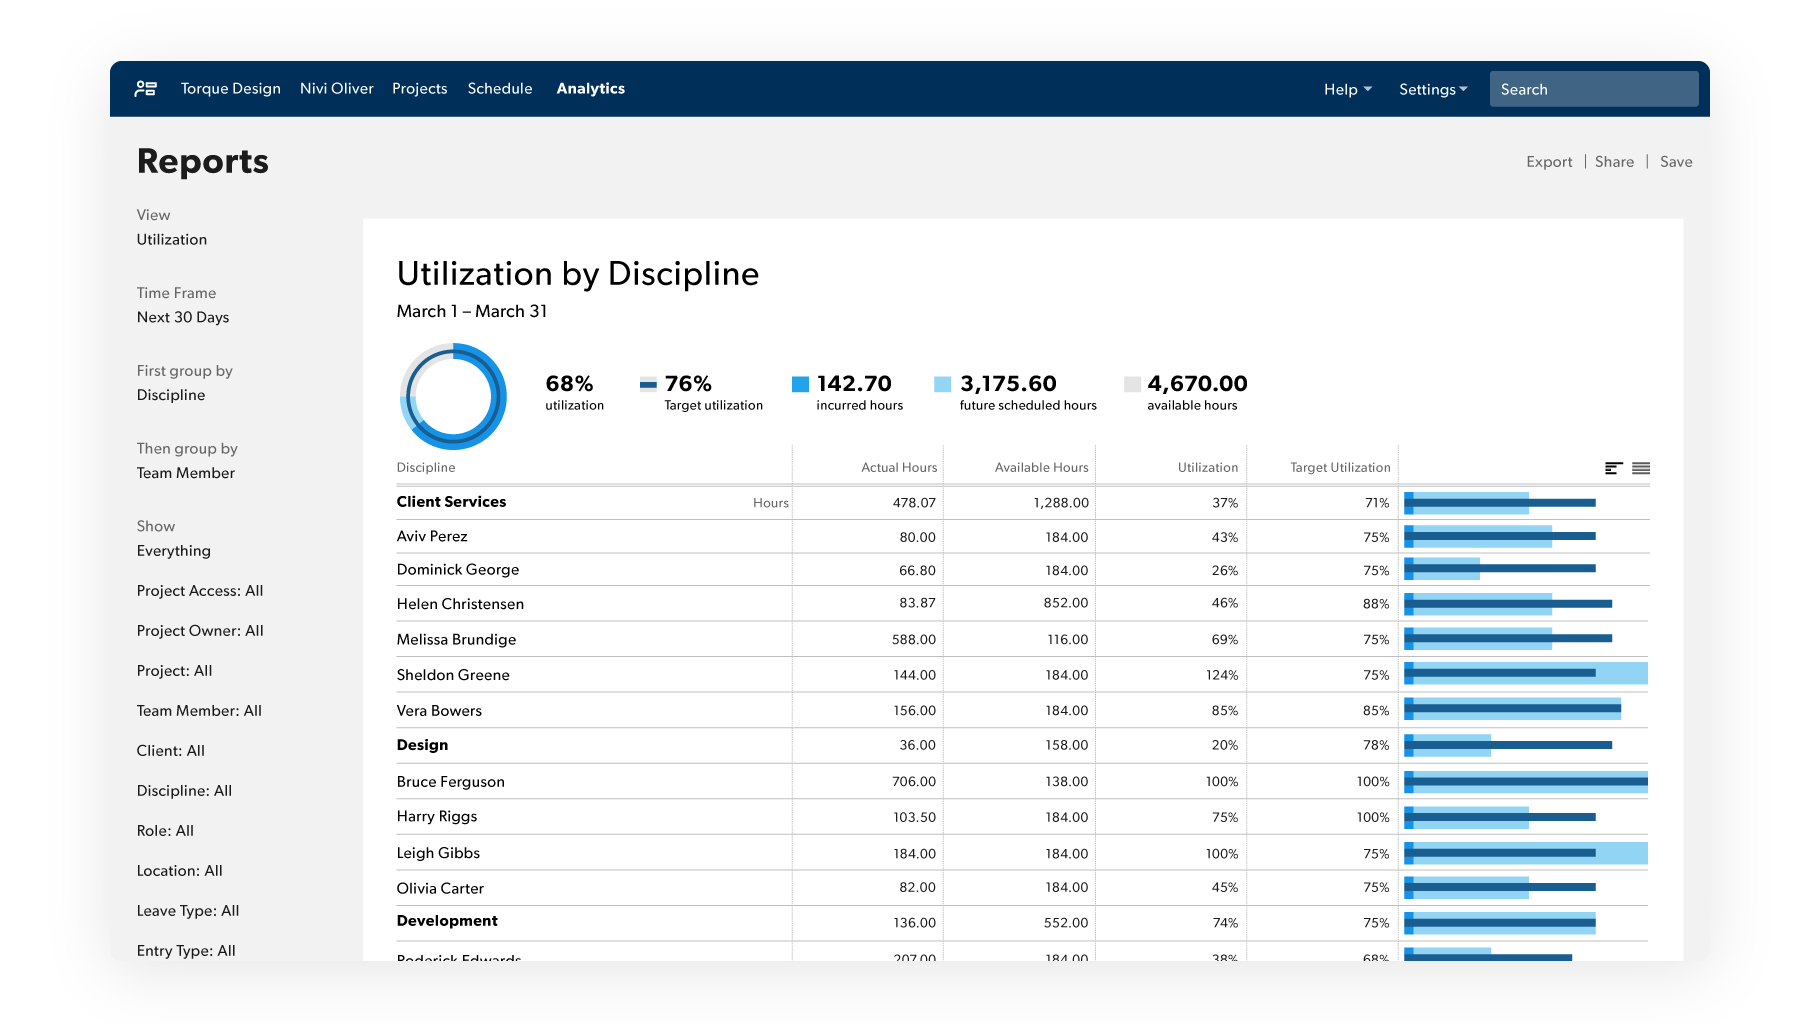
Group Reports by Team, Project, or Role
Sometimes you need more granular reporting to make sense of resource usage, especially if you manage multiple functions or want to track performance over time. Group reports for a more detailed view and to connect day-to-day allocations with bigger-picture metrics, such as capacity planning and team performance.
Smartsheet reports let you filter, group, and display resource data based on what matters most. Create custom views tailored to your team’s structure with the ability to visualize data by the following variables:
- Project: Compare estimated versus actual hours or track upcoming demand.
- Team: View workload distribution and pinpoint areas or over/underutilization.
- Role: Identify gaps in critical functions, such as development, marketing, or QA.
- Custom Tags: Group resources by custom tags, such as skill, location, seniority, or availability.
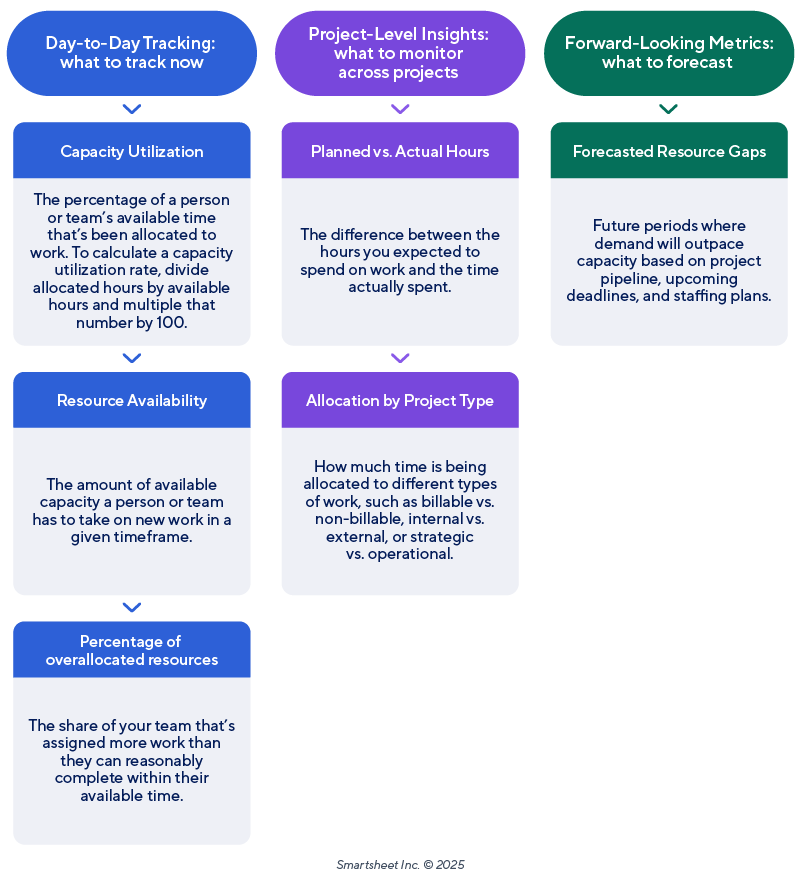
Metrics and KPIs to Track for Resource Visibility
Once you’ve centralized planning, visualized capacity, and set up dashboards, you can measure progress. By tracking the right resource allocation metrics, you gain insight into trends and bottlenecks before they happen. Track the following resource allocation visibility KPIs to help justify hiring and reallocation decisions and improve your planning process.
The below chart provides more detail into the top metrics to track, what it is, and how to track it in Smartsheet.
Metric/KPI | Definition | How to Track It in Smartsheet |
|---|---|---|
| Capacity Utilization Rate | The percentage of a person’s or a team’s available time that’s been allocated to work. To calculate a capacity utilization rate, divide allocated hours by available hours and multiple that number by 100. | Use reports or dashboards to show allocation versus availability by person or role over time. Heatmaps also make this easy to see at a glance. |
| Planned vs. Actual Hours | The difference between the time you expected or allocated to spend on a task or project and the time you actually spent on it. | Compare planned hours from project schedules to actual time logged in Resource Management by Smartsheet or connected timesheets. |
| Resource Availability | The amount of available capacity (usually in hours) a person or team has to take on new work in a given time frame. This helps you avoid overcommitting team members and surface underutilized resources. | Filter resource views by role or department, and display remaining hours or capacity percentages by week or month. |
| Allocation by Project Type or Priority | How much time is being allocated to different types of work, such as billable versus nonbillable, internal versus external, or strategic versus operational. Use this to ensure your time aligns with company priorities. | Use custom fields (e.g., “Project Type” or “Priority”) and group your reports accordingly. Dashboards can show time distribution in pie charts or bar graphs. |
| Percentage of Overallocated Resources | The share of your team that’s assigned more work than they can reasonably complete within their available time. Calculate this to uncover visibility gaps. | Heatmaps and portfolio-level reports can highlight individuals or roles exceeding 100 percent allocation. Use conditional formatting to flag issues automatically. |
| Forecasted Resource Gaps | Future periods where demand will outpace capacity based on project pipeline, upcoming deadlines, and staffing plans. | Use project start dates and future allocations to forecast needs 30, 60, or 90 days out. Pair this with dashboards that display upcoming capacity gaps by role or team. |
Tracking the right metrics will help you make smarter staffing decisions, justify priorities, and prove the impact of your resource planning process. From there, you can level up your tracking by automating some of this work. Smartsheet makes it easy to schedule reports and automatically update dashboards so that metrics are always current.
Smartsheet in Action: How Caravel Improved Resource Allocation Visibility at Scale
Caravel, a fast-growing professional services firm, turned to Smartsheet to replace siloed systems with a centralized hub. By standardizing how it staffed projects and tracked availability, Caravel gained real-time visibility into workloads and dramatically reduced the time teams took to assign the right people to the right work.
With portfolio-level dashboards and grouped reports, leaders and clients alike could see progress and staffing levels at a glance, improving collaboration while eliminating the silos that slowed them down. At the same time, Smartsheet helped improve Caravel’s ability to identify when teams were over- or underutilized, optimize resource distribution, and proactively plan new hires to meet upcoming demand.
Automations and project blueprints further streamlined setup, freeing project managers to spend less time on administration and more time customizing solutions for clients. The results were significant:
- Faster staffing decisions
- A 25 percent boost in resource utilization
- Up to 1,400 hours reclaimed weekly
- Scaled headcount 500 percent while still delivering a high-touch client experience
Whether you're supporting one project or managing resources across an entire portfolio, Caravel’s success story is just one demonstration of how Smartsheet tools scale to meet your visibility needs and help you achieve sustainable business growth.
Overcoming Roadblocks to Adoption
In addition to getting better tools for resource allocation, you’ll need buy-in, behavior change, and adoption across teams. After all, dashboards and reports only become powerful when team members actually use them.
Below, you’ll learn more about the most common roadblocks that teams face when implementing new strategies to support resource allocation visibility and how to overcome them.
Challenge: Change Aversion
It’s natural for teams to hesitate to replace a process, system, or tool, especially if they’ve used one for a long time. While change can feel unsettling, it can provide new opportunities for growth.
How to overcome it:
- Start Small: Pilot the new tool or process with a single team or project before rolling it out more broadly.
- Show Quick Wins: Use initial data to demonstrate how visibility helped rebalance workloads, meet a tight deadline, or reduce team burnout.
- Involve Key Stakeholders Early: Make team leads part of the solution, not just end users.
Challenge: Too Many Tools Already in Play
Today’s tech stacks have many teams feeling overwhelmed, and adding another platform can feel like just another login and an annoying learning curve. Reduce tool overload by showing how the new tool consolidates and simplifies the company’s existing tech stack.
How to overcome it:
- Consolidate Workflows: Advocate for the importance of a central hub where project schedules, resource data, and reporting come together, reducing the complexity of disconnected tools.
- Highlight Integration Opportunities: Show how the tool will integrate with resources the team is already using and how those integrations will save them time and make their work easier.
Challenge: Inconsistent Data or Low Trust in the System
If resource data is inaccurate or updated inconsistently, teams won’t trust what they see, and they’ll revert to old habits. Set up data governance proactively and explain why it’s important to build trust in the new tool’s outputs and results.
How to overcome it:
- Assign Clear Ownership: Ensure there is a clear understanding of who is responsible for keeping resource plans updated in the new tool and at what cadence.
- Automate Updates: Use automation and dynamic reports (available in Smartsheet) to reduce manual data entry and keep views accurate.
- Educate on the “Why”: Remind team members that accurate data ultimately means better decisions, fewer fire drills, more realistic expectations, and more projects delivered on time and on budget.
Challenge: Leadership Needs Proof Before Fully Buying In
Executives might be skeptical of resource management investments unless there’s clear ROI or performance impact. Build a business case with the following elements for enthusiastic buy-in.
How to overcome it:
- Present Compelling Data: Use KPIs such as utilization rate, project delivery rates, and reduced overallocations to demonstrate material impact.
- Create Executive Dashboards: Build clean, high-level views that show leadership how easily they will be able to monitor team health, resourcing trends, and hiring needs at a glance.
- Use Visual Storytelling: Show before-and-after states of capacity, workload distribution, or missed deadlines to make the case real.
Challenge: Teams Don’t Know Where to Start
Sometimes, resource managers know visibility is a problem, but they don’t know how to fix it or where to start.
How to overcome it:
- Start With Visibility, not Perfection: Focus on uncovering your resource data first, even if it’s not yet optimized.
- Use Templates: Start with pre-built dashboards, reports, and allocation views to eliminate tedious manual setup and get up and running quickly.
- Lean on Training and Support: Empower teams to leverage resources, tutorials, and customer support to conquer the learning curve.
Improving resource allocation visibility is an investment in clarity, collaboration, and control. It’s well worth the shift required. When you are prepared for these common roadblocks, you’ll set everyone up for long-term success.
Final Thoughts: Build a Culture of Transparent Planning
Improving resource allocation visibility isn’t just about solving for today’s workload. It’s about creating a culture of clarity, accountability, and proactive planning.
When your team has access to real-time insights into who’s doing what, when, and with how much capacity, you unlock more than efficiency. You empower more impactful conversations and decision-making — not to mention more predictable outcomes. Plus, you’ll reduce the risk of burnout and unexpected setbacks.
Smartsheet gives you the tools to make this kind of visibility not just possible, but sustainable. From high-level dashboards to granular heatmaps and automated reports, you can customize your planning system to match your team’s needs and scale it as you grow.
Improve Resource Management Efforts With Smartsheet
Resource Management by Smartsheet is a powerful resource management software that helps to effectively manage the who, the what, and the when behind projects.
With Resource Management by Smartsheet, you can more easily build the best team for a project, keep project schedules and budgets on track, and confidently forecast business needs.
When teams have clarity into the work getting done and by whom, there’s no telling how much more they can accomplish in the same amount of time. Watch a free demo to learn more about Resource Management by Smartsheet.