What is ROI in PPM Software?
ROI in PPM software measures the value an organization gains compared to the cost of implementing and using the tools. It can help leaders decide if benefits like improved visibility, efficiency, and decision-making are worth the financial investment.
According to a recent survey, over 60% of PPM professionals say that their organization's current tools and systems make it difficult for them to demonstrate their contributions to project outcomes. The ability to prove PPM ROI is, therefore, more important than ever.
Unlike project-level ROI, PPM ROI looks at portfolio-wide outcomes and includes considerations like overall organization-wide efficiency gains, avoided risks, resource use, prioritizing the right work at the right time, and the business impact of adopting PPM tools that allow these benefits.
Expected Benefits of Implementing PPM Tools
The expected benefits of implementing PPM tools include both tangible and intangible gains. Tangible benefits include things like cost savings, efficiency improvements, and better overall performance, while intangible benefits might include improved visibility, decision-making, and strategic alignment.
For leaders, the most important benefits of PPM tools are typically a combination of both tangibles and intangibles.
Tangible Benefits
Tangible benefits are measurable, cost-related improvements such as reduced labor effort, fewer project delays, improved budget accuracy, and lower technology spend. These benefits can be directly tracked using numerical and financial metrics.
We’ve outlined some of the most common tangible benefits of implementing PPM software below:
- Reduced Project Delays and Failures: More projects are delivered on time and with fewer timeline overruns, which frees up budgets and resources for future projects.
- Lower Labor Costs: Automation and modern tools reduce the time spent on manual reporting, duplicated efforts, and change requests.
- Improved Resource Utilization: PPM software gives clear visibility into capacity and timelines helps teams allocate the right people to the right work at the right time.
- Faster Project Start Times: Better planning, including using templates and tools included in PPM software, enables quicker approvals and launches for high-impact projects.
- Reduced IT License Costs: Consolidating or eliminating redundant and outdated tools lowers overall software spend and saves money for the business.
- Improved Budget Accuracy: Real-time cost tracking improves financial forecasting, reducing risks and surprises.
- Lower Management Overhead: Less time is spent preparing status reports, approvals, and documentation, freeing time for higher-value work.
- Avoiding Spend on Low-Value Work: Better prioritization prevents time wasted on non-strategic or duplicative initiatives.
Intangible Benefits
Intangible benefits can be difficult to quantify with numbers and financial metrics. These might include better visibility, decision-making, strategic alignment, and agility. While less quantifiable, these benefits can also drive long-term value through risk reduction and better organizational processes.
We’ve outlined some of the most common intangible benefits of implementing PPM software in the list below:
- Improved Portfolio Visibility: PPM tools give leaders a clearer, real-time view of projects, budgets, risks, and dependencies, all in one place.
- Better Strategic Alignment: Work can be prioritized and budgeted based on business objectives rather than urgency or intuition.
- Stronger Decision-Making: Data-driven insights and scenario planning reduce reliance on guesswork.
Proactive Risk Management: Risks and bottlenecks can be identified earlier, before they impact project delivery or blow the budget. - Improved Collaboration: With PPM software, teams can work from a shared, internal system rather than a series of disconnected spreadsheets and email threads.
- Greater Transparency and Accountability: Decisions, approvals, requests, and changes are better documented and more easily traced.
- Improved Governance and Compliance: Standardizing tools and workflows helps to support audits and regulatory requirements.
- Better Organizational Agility: With PPM software, leaders can more easily adjust to changing priorities as business needs evolve.
Common Challenges When Measuring PPM Software ROI
Measuring PPM ROI can be challenging when your data sources are fragmented, your tool adoption is inconsistent, or you don’t set up a proper baseline beforehand.
Below, we’ve outlined some common challenges you might encounter when measuring PPM ROI, and how to solve them.
Lack of Measurement Baseline
Organizations may not capture cost or effort metrics before adopting new tools, which makes ROI comparisons difficult.
→ How to Solve: Spend time to organize your current portfolio metrics where you can before rolling out a new tool, even if the data is imperfect or incomplete.
Inconsistent Tool Adoption
Teams often use tools inconsistently, leading to incomplete or unreliable data.
→ How to Solve: Standardize workflows and reporting requirements across teams where possible, so everyone is using the tool consistently.
Difficulty Quantifying Intangible Benefits
Improvements like decision-making quality and strategic alignment are real, but can be difficult to compare alongside more tangible ones like cost savings.
→ How to Solve: Tie intangible benefits to proxy metrics where possible, such as decision cycle time, risk exposure and response time, or approval speed.
Fragmented Data Sources
Financial, resource and project delivery data often live within different systems that are not fully integrated.
→ How to Solve: PPM software brings financial, resource, project data, and more into a single ecosystem to view and work from all in one place.
Manual or Inaccurate Data
Poor data hygiene can undermine the validity of reports and ROI calculations.
→ How to Solve: Automate data capture with PPM software and enforce standardized workflows to improve the accuracy of your data.
Underrepresenting Long-Term Value
Early results can underrepresent the long-term value of PPM tools as your processes and adoption mature.
→ How to Solve: Measure ROI at multiple intervals and compare them over time to account for adoption and organizational maturity over time.
Unclear Ownership of ROI Measurement
It can be difficult to measure ROI accurately when no single team is responsible for tracking outcomes after tool adoption.
→ How to Solve: Assign clear leads to track ROI outcomes over time.
Attribution of Outcomes
External factors like staffing changes or market changes can complicate the attribution of outcomes to a single variable.
→ How to Solve: Document assumptions about external variables alongside more tangible ROI factors to provide context for results where needed.
Typical PPM Software Costs
The typical costs associated with implementing PPM software include one-time deployment costs and ongoing recurring costs. Deployment costs often include setup, configuration and training while recurring costs might cover licensing, support, and ongoing administration.
Deployment costs are usually charged during implementation and focus on getting the software up and running and adopted across the organization. Recurring costs continue over time and reflect the ongoing investment required to maintain, scale, and support the system as internal usage matures.
Deployment Costs
Deployment costs for PPM software are the costs associated with things like data migration, software implementation, hardware setup, and training.
Below, we’ve outlined the most common deployment costs for implementing PPM software:
- Data Migration: Importing existing project and portfolio, financial, and resource data from legacy tools and spreadsheets into the new tool
- Implementation and Configuration: The initial setup of projects, portfolios, workflows, templates, data models, permissions, and other things needed to get the software up and running for the users
- Hardware Setup: The purchase and setup of any new machines, servers, or peripherals required to run and maintain the new software
- Training and Enablement: The time and costs required to onboard teams, administrators, and leaders to ensure effective adoption of new software
- Change Management: The time and effort spent standardizing processes and encouraging consistent usage in the organization
Recurring Costs
Recurring costs for implementing PPM software might include things like software licensing, maintenance, and ongoing training and support.
We’ve outlined some of the most common recurring costs related to implementing PPM software in the list below:
- Software Licensing: Ongoing subscription fees based on the number and type of users, selected features, portfolio size, and more
- Maintenance and Upgrades: The costs associated with maintaining integrations, adopting new features and capabilities, or growing in size
- Platform Administration: Time spent managing users and permissions, building workflows and templates, and auditing procedures and data quality
- Ongoing Training and Support: The costs of continued enablement for new users, new features, and evolving processes
- Change Management: The time and effort spent maintaining sustained change management
How to Measure & Prove PPM Software ROI
To measure PPM ROI, first define success and establish a baseline. Then, map your PPM capabilities to measurable outcomes and quantify your gains, cost savings, and value creation. Finally, compare those benefits to the total cost of the tool over time.
We’ve simplified the process to measure and prove PPM ROI to these five steps, which we’ve outlined in the sections below:
- Define success and establish a baseline
- Map PPM capabilities to measurable business outcomes
- Quantify efficiency gains and cost savings
- Measure value creation
- Compare total benefits against total cost over time
Step 1: Define Success and Establish a Baseline
You can’t measure ROI without first defining what success looks like. Before implementing a PPM tool, it’s important to document how your work is currently conducted, delivered, managed, and reported so you have clear points of comparison.
Before rolling out a PPM tool, document:
- Project Performance: Note the current on-time and on-budget project delivery rates across the portfolio.
- Manual Effort: Find the number of hours spent on manual tasks like reporting, intake, status updates, and administrative work.
- Current Tool Stack: Record the number and type of tools in use, especially if they are disconnected.
- Decision-Making Speed: Note the average time required to approve projects and requests, launch work, or make course-corrections.
This baseline will provide the foundation for comparison to measure improvements after implementing PPM software. Without data from before implementation, ROI calculations rely largely on assumptions, making it more difficult to prove the benefits of adoption and build a strong business case.
Step 2: Map PPM capabilities to measurable business outcomes
Connect the core features of your PPM software to measurable results. This ensures ROI is tied to business outcomes rather than tool adoption alone.
Connect specific PPM capabilities to outcomes leadership cares about, such as:
- Centralized Intake: Reduces duplicative, low-value, or unapproved tasks entering the workstream and taking resources from more important initiatives
- Portfolio Visibility: Enables faster prioritization and more informed funding decisions
- Real-Time Reporting: Decreases the time needed to prepare executive updates and status reports
Resource Management: Improves resource utilization and helps prevent burnout and delays.
By linking capabilities directly to measurable outcomes, you can make it clear at a glance why and how the investment in PPM tools delivers value to the business.
Step 3: Quantify efficiency gains and cost savings
First, focus on tracking operational improvements that can be translated into time and cost savings across teams and portfolios.
Track improvements like:
- Administrative Time Savings: Fewer hours saved per week on automating manual tasks like reporting and status update
- Reduced Rework: Reduction in rework caused by misalignment or incorrect or poorly prioritized tasks
- Improved Project Execution: Fewer missed deadlines or budget overruns, and less severity
- Tool Consolidation: Decreased reliance on spreadsheets, email, or disconnected tools
Even conservative estimates can add up quickly across teams and large portfolios.
Step 4: Measure value creation
ROI goes beyond cost savings and can also show how better decision-making adds value to the business. Use your PPM tool to show the intangible benefits of better portfolio-level management, and how your new tools improve outcomes as well as efficiency.
You can use your PPM tool to show:
- Increased Throughput: More high-value and strategic work delivered using the same (or fewer) resources
- Faster Time to Value: High-priority initiatives move from intake to execution more quickly
- Improved Funding Alignment: Financial investments are directed toward work that best supports strategic goals
- Earlier Risk Detection: Risks are identified and addressed sooner, reducing the likelihood of costly failures
This is especially powerful for executive audiences, because it helps to link better PPM directly to overall growth and resilience, not just efficiency.
Step 5: Compare total benefits against total cost over time
The final step is to bring all these benefits and costs together into a single, clear ROI calculation. This allows you to quantify the overall return on your PPM investments and communicate it clearly to stakeholders.
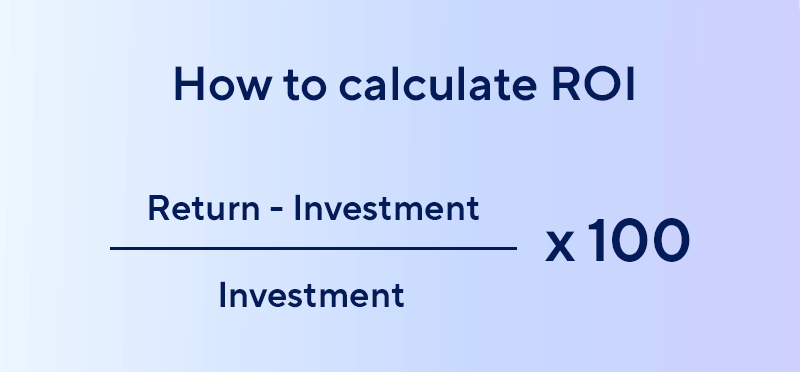
ROI is calculated using the following formula:
(Total benefits - Total costs) / Total Costs
Pro Tip: Multiply the result by 100 to express ROI as a percentage increase
To show how value increases over time as adoption matures, track your ROI in increments. You can use whatever time increments make the most sense to you, like months, quarters, or years. This reinforces the idea that ROI is not a one-time outcome, but a result that builds as processes improve and usage becomes more consistent.
Key Metrics to Track When Measuring PPM Software ROI
Key metrics to consider when measuring PPM ROI include performance metrics, financial and cost metrics, and resource and capacity metrics. Together, these metrics capture both tangible and intangible benefits of PPM software and translate operational improvements into measurable value.
Delivery and Performance Metrics
Delivery and performance metrics include things like the number of projects delivered on schedule and on budget, how frequently they’re delayed or reworked, and the time between intake and completion.
We’ve outlined some common PPM delivery and performance metrics in the list below:
- On-Time Delivery: The percentage of projects completed by their planned end date across the portfolio
- On-Budget Performance: The number of projects that are delivered within approved budget thresholds
- Cycle Time: The average time it takes for tasks, projects, or approvals to move from requests to completion
- Project Delay Frequency: The number of projects impacted by risks, dependencies, or bottlenecks, and how frequently those impacts are severe
- Rework: How often tasks or projects require scope changes, rework, or corrective action
Financial and Cost Metrics
Financial and cost metrics can be calculated in value gained or losses avoided, and can include things like cost variance, budget overruns, avoided spend, and more.
We’ve outlined some common financial and cost metrics related to PPM below:
- Cost Variance: The difference between planned and actual costs across projects and portfolios
- Budget Overruns: The frequency and severity of projects that exceed approved budgets
- Avoided Spend: Costs saved by eliminating duplicative or low-value projects
- Labor Cost Savings: Reduced labor costs from automating repetitive, low-value tasks and administrative work
- ROI Percentage: The calculation of net benefits compared to total PPM costs, expressed as a percentage return
Resource and Capacity Metrics
Resource and capacity metrics related to the use of human or technology resources, and might include the utilization rate, reduction in conflicts, and overall time spent on work.
We’ve outlined some common PPM resource and capacity metrics in the list below:
- Resource Utilization: The percentage of available capacity allocated to productive work for each team member
- Capacity Alignment: How well available resources match portfolio demand and business priorities
- Conflict Reduction: Decreases in resource overallocations and employee scheduling conflicts
- Time Spent on Work: The amount of time spent on high-value vs. low-value, repetitive work
- Forecast Accuracy: The reliability of staffing and needs forecasts over time
How Smartsheet Intelligent Work Management Can Help
Smartsheet Intelligent Work Management helps organizations connect strategy to execution and turn portfolio data into measurable outcomes. With built in AI, automation, and real-time visibility, teams can prioritize the right work, spot risks earlier, and make faster, more confident decisions across projects and portfolios.
Smartsheet makes it easier to track the metrics that matter most for proving PPM ROI. AI-powered insights surface trends and risks automatically, while smarter dashboards, reporting, and workflows help keep teams aligned as priorities change. The result is clearer visibility, stronger governance, and a faster path from investment to impact. Ready to see for yourself? Try Smartsheet today.


