What Is the Inventory Turnover Ratio?
The inventory turnover ratio shows which products move quickly and which move slowly, measured by how frequently your stock is sold and replenished. It’s a practical way to track how efficiently you’re managing inventory.
This ratio compares two figures: the cost of goods sold (COGS) — what you paid to produce or purchase the items you sold — and the average inventory during a given time frame, such as quarterly or annually. The resulting ratio shows how many times you turned over your inventory in that period.
To find your inventory turnover ratio, use this formula:
Inventory turnover ratio = Cost of goods sold ÷ Average inventory
A higher ratio means your products sell quickly or you’re keeping inventory lean. A lower ratio suggests sluggish sales, too much stock on hand, or both.
How to Calculate Inventory Turnover Ratio
To find your inventory turnover ratio, start with two numbers: how much you spent on goods sold during the period, and how much inventory you had on hand on average. Divide the first figure by the second. The resulting value tells you how many times you sold and replaced your inventory.
Here’s a closer look at these steps:
- Find Your COGS: Look at your income statement for the period you’re measuring: monthly, quarterly, or yearly. (Note: You want the cost of goods sold, not total revenue.) This number includes everything it cost you to produce or buy the goods you sold during the time frame.
- Calculate Average Inventory: Note the inventory value at the start of the period to the inventory value at the end of the period. Divide that sum by two. This gives you a rough average for the time frame. If you want greater precision, average it monthly, especially if your inventory swings up and down a lot.
- Apply the Formula: Plug the numbers into the formula: Inventory turnover = COGS ÷ Average inventory
We can calculate the inventory turnover ratio for a company with a COGS for the quarter of $150,000. The business has $40,000 in inventory at the beginning and $50,000 at the end, so the average inventory is $45,000 [($40,000 + 50,000) / 2].
The inventory turnover ratio equals $150,000 ÷ $45,000 = 3.33. That means the inventory turned over about three and a third times in the quarter.
This number can help you spot whether you’re holding too much inventory or not enough.
Inventory Turnover Ratio Example
In this example, you run a small online store that sells office chairs. Over the past year, you spent $600,000 on the chairs you sold. Your inventory was valued at $150,000 in January and $90,000 in December. That averages out to $120,000 on hand across the year.
Now apply the formula: Inventory turnover = $600,000 ÷ $120,000 = 5
Your turnover ratio is 5. That means you sold through your average inventory five times in the year, about once every 10 weeks. That’s not bad, especially if your goal is to keep stock moving without running out.
Imagine the ratio was 2 instead of 5. That would mean chairs were sitting around for months before selling. You might be tying up cash in slow-moving stock or overordering. On the flip side, if the ratio were 10, it might mean you're selling fast but cutting it close on inventory. In this case, double-check that you’re not running out of your best-sellers too often.
What Is a Good Inventory Turnover Ratio?
The ideal inventory turnover ratio depends on your industry and how fast your customers expect delivery. Fast-moving or perishable industries such as food or cosmetics aim for a higher annual turnover, such as 8-10, while large durable goods such as furniture or heavy equipment aim for 2-3 times a year.
In general, higher is better — it means you’re selling quickly without overstocking. But there’s a limit. If your turnover ratio is extremely high — above 12 or 15 in most industries — it may mean you’re restocking too frequently, risking stockouts, or missing sales due to empty shelves. That’s especially true if your lead times are long or your supply chain is unstable. In those cases, ultra-lean inventory can backfire. A “too high” ratio might signal efficiency, but it could also be a warning sign of understocking or overly aggressive inventory cuts.
If you sell perishables, such as food or cosmetics, a high turnover is a must. You want products moving fast to avoid spoilage. But in fast-moving sectors such as grocery or low-margin retail, inventory turns over rapidly — by design. With perishable goods or everyday essentials, slow turnover isn’t just inefficient, it’s risky. These businesses often aim for double-digit turns per year because unsold stock quickly becomes waste. For more on how inventory turnover supports retail operations, see our retail management 101 guide.
At the other end of the spectrum, large durable goods tend to move slowly. Items such as furniture or heavy equipment come with longer sales cycles and higher price tags.
Seasonal businesses add another dimension. A company that sells toys, for example, might ramp up stock in the fall and sell through most of it in December. The numbers might look skewed in October — low turnover, high inventory — but zoom out to annual figures, and you’ll see a deliberate, seasonal strategy at work.
In Lean or just-in-time (JIT) operations, companies keep inventory levels low on purpose. The idea is to reduce costs and free up cash. But if orders arrive late or demand surges unexpectedly, a Lean setup can leave shelves empty. It’s a balance: The leaner the system, the more reliable the supply chain needs to be. Learn more about this strategy in our Lean inventory guide.
A 2025 study in the International Journal of Management Finance reviewed inventory performance across 21 retail companies and found that turnover ratios, while useful on their own, carried more weight when combined with financial indicators such as sales growth and capital structure. It’s not just about how fast inventory moves — it’s how well that pace fits the broader business model.
Instead of chasing a fixed “good” number, look at your own trendlines. Is turnover improving? Are you selling efficiently without running into shortages? If so, your current ratio may be exactly where it should be.
Industry Benchmarks for Annual Inventory Turnover Ratio
| Industry | Typical Annual Inventory Turnover Ratio |
|---|---|
| Grocery Retail | 10-20 |
| Apparel/Fast Fashion | 6-10 |
| Electronics Retail | 4-8 |
| Furniture/Home Goods | 2-4 |
| Auto Dealerships | 1.5-3 |
| Restaurants | 8-15 |
| Pharmacies | 10-15 |
| Bookstores | 2-5 |
| Manufacturing (General) | 4-8 |
| Construction Materials | 4-6 |
| Luxury Goods (e.g. jewelry) | 1-3 |
| Consumer Packaged Goods | 8-12 |
| Industrial Equipment | 1-12 |
What Should Businesses Track Beyond Inventory Turnover?
Turnover reveals how frequently you track and replenish inventory. Businesses also track days sales of inventory (DSI), a metric that shows how long stock typically sits before it’s sold. A shorter DSI usually means products are moving efficiently.
Additionally, track carrying costs, or the costs to store, insure, and manage products. That’s cash tied up in inventory that isn’t yet generating revenue.
That said, faster turnover isn’t always ideal. If you’re constantly running out of stock, you might be turning products too quickly — and missing sales in the process. Customers may buy elsewhere if your shelves are consistently empty.
The goal is to find a sustainable rhythm that keeps products moving without straining your operations or supply chain.
SKU-Level Turnover vs. Overall Turnover Ratio
Your overall turnover ratio gives you a big-picture view, but it can mask how individual products are performing. Look at turnover one SKU at a time to see what is and isn’t working.
Some products move quickly and might need more frequent reordering. Others sit longer, tying up resources. Once you identify those patterns, it becomes easier to make decisions about pricing, promotions, or phasing out items that no longer earn their keep.
To track SKU-level turnover, use the same formula you used to calculate overall turnover. The only difference is that you look at the data by individual product:
SKU turnover = COGS for that SKU ÷ Average inventory for that SKU
In fact, the columns you need are the same:
- COGS for each SKU during the period of time
- Beginning and ending inventory values
- Average inventory
- Turnover ratio (COGS ÷ average inventory)
Most spreadsheet software can handle this easily. You’re not reinventing your system — just applying it at the SKU level to spot what’s selling well and what’s tying up cash.
Inventory Turnover Template
Download the Inventory Turnover Template for Excel
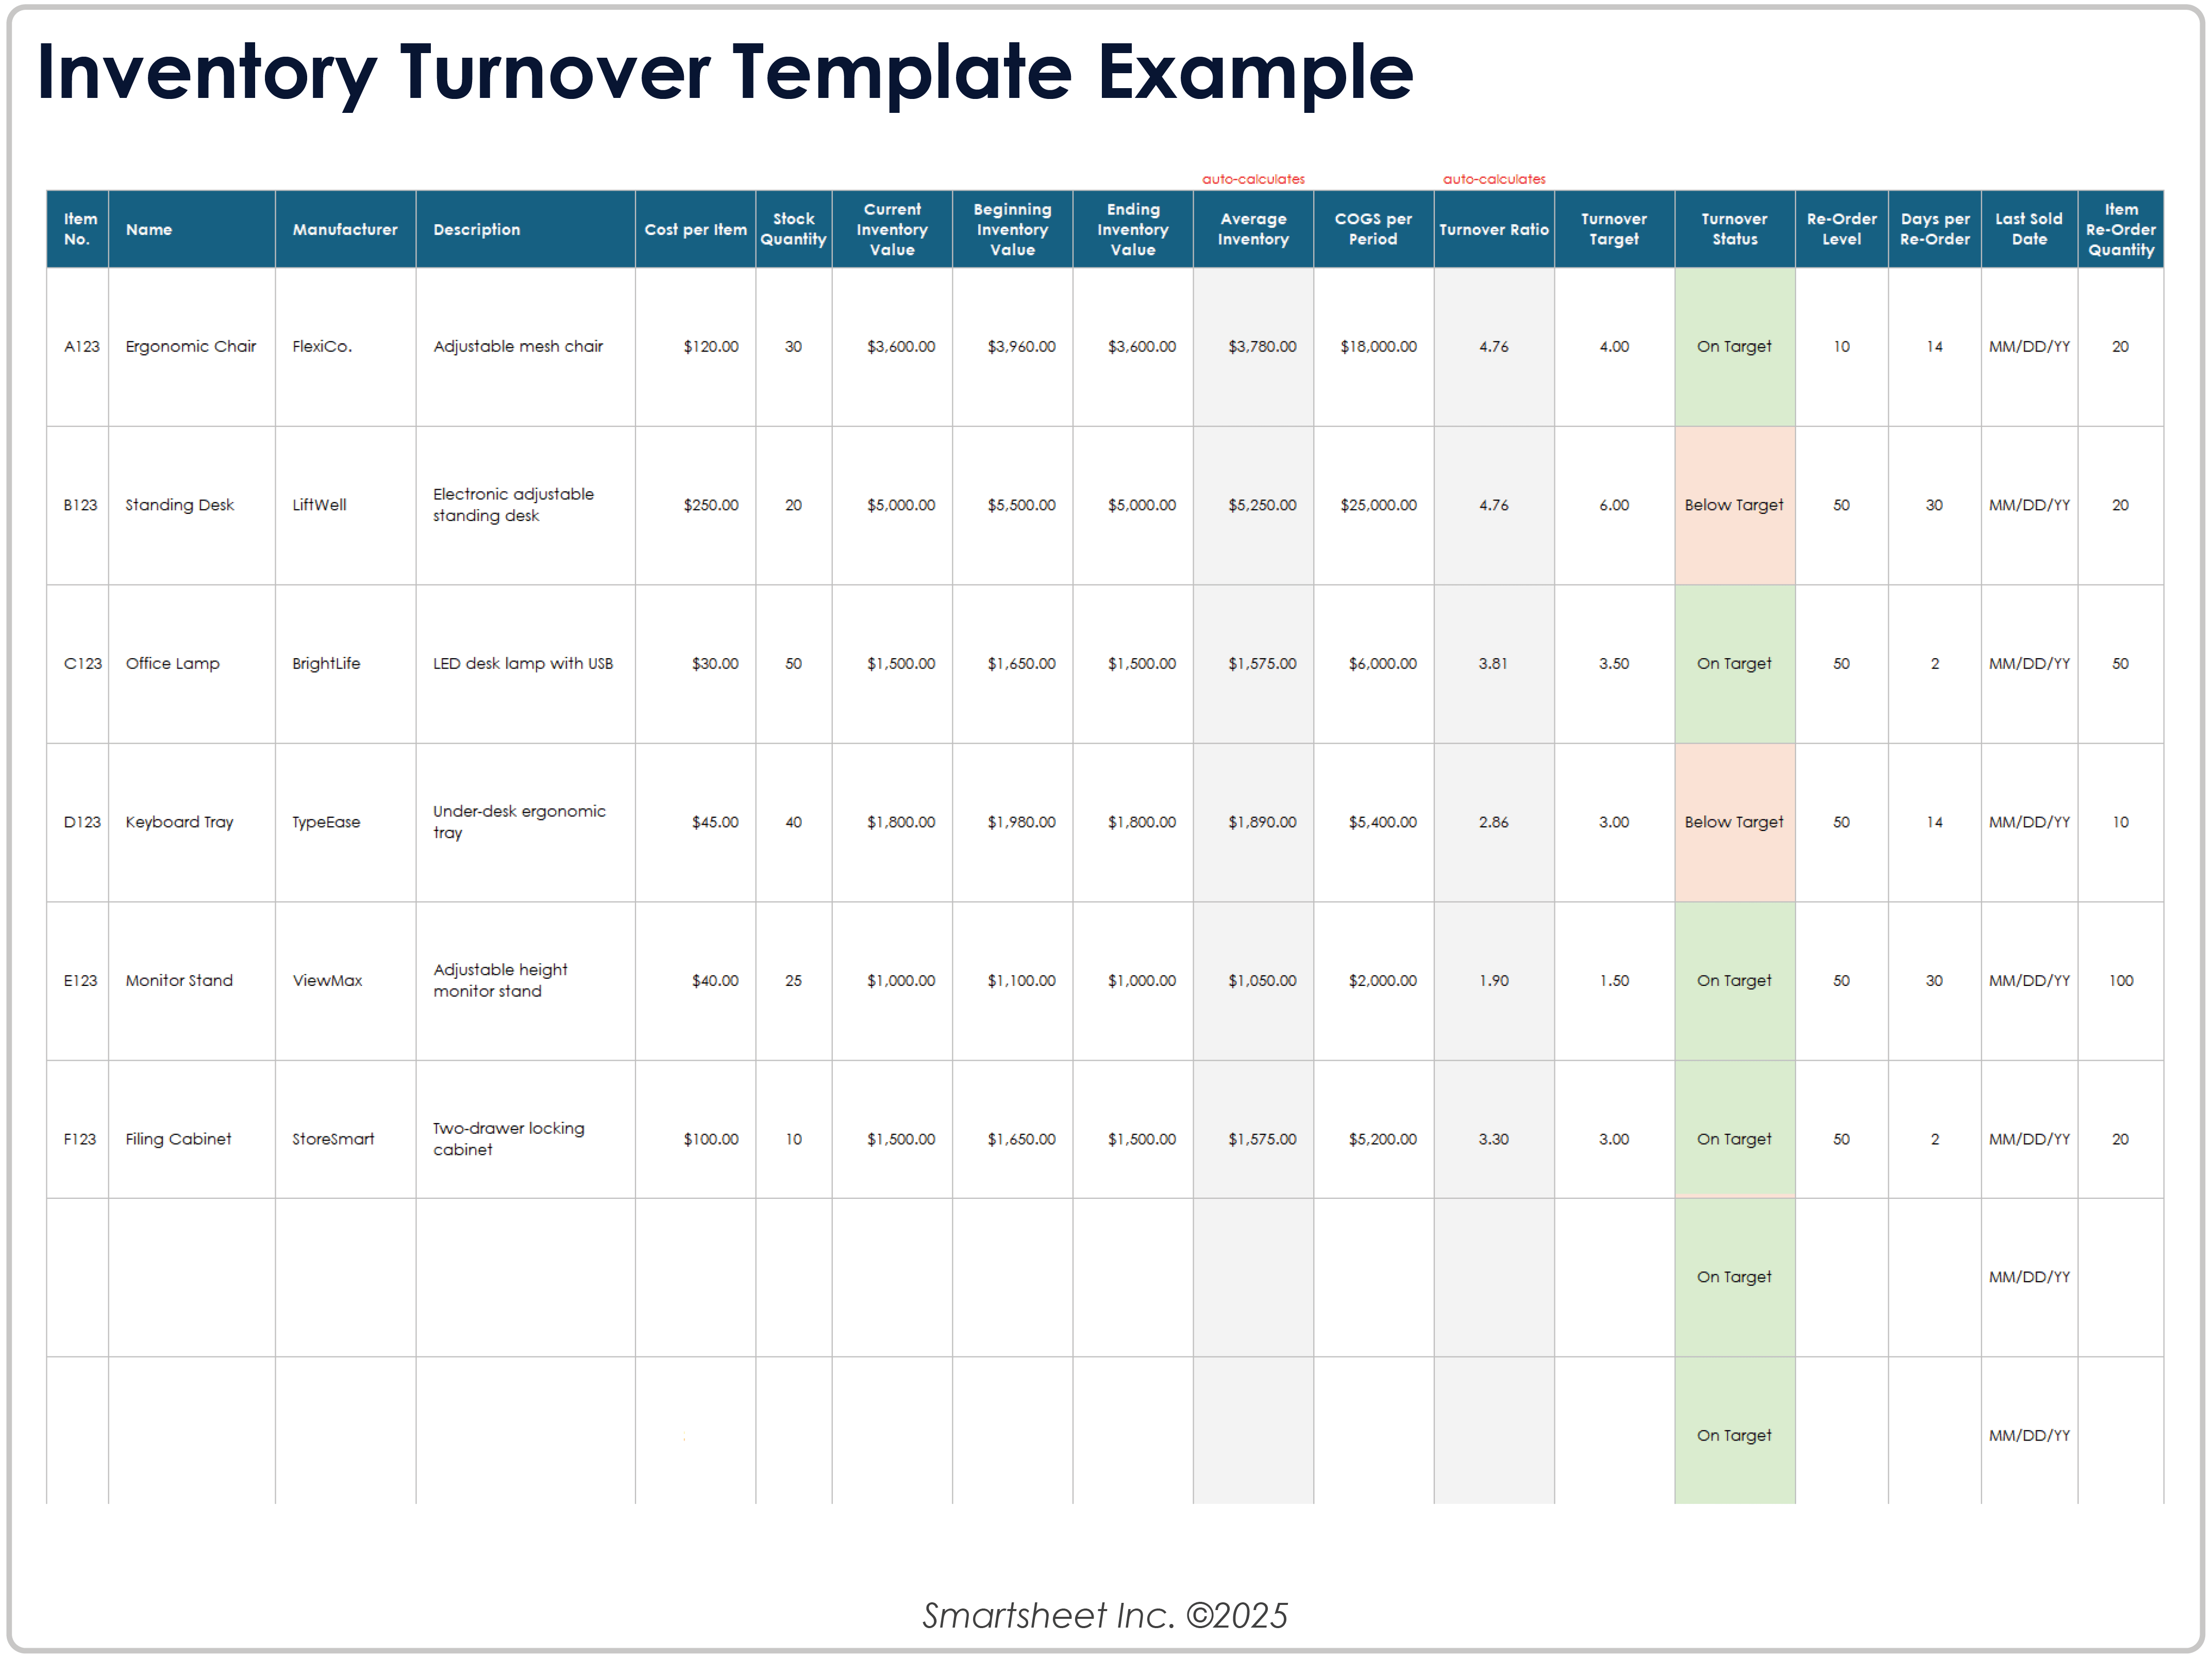
Download our free inventory turnover template in Excel to calculate and monitor your turnover ratio, both across your whole business and for each product. The flexible template allows you to view monthly, quarterly, or annual tracking and includes fields for key data, such as product details, COGS, average inventory, and inventory turnover ratio.
How to Use the Inventory Turnover Template
To use the inventory turnover template, enter your product information row by row. Then, enter your inventory values, COGS, turnover target, and reorder information. The sheet auto-calculates your average inventory, turnover ratio, and performance against targets to give a product-level view of your inventory.
Follow these steps:

Download and open the
inventory turnover template for Excel.- For each product, enter your data in the Item Number, Name, Manufacturer, Description, Cost Per Item, and Stock Quantity fields. The template will auto-calculate and auto-populate the Current Inventory Value field for each product.
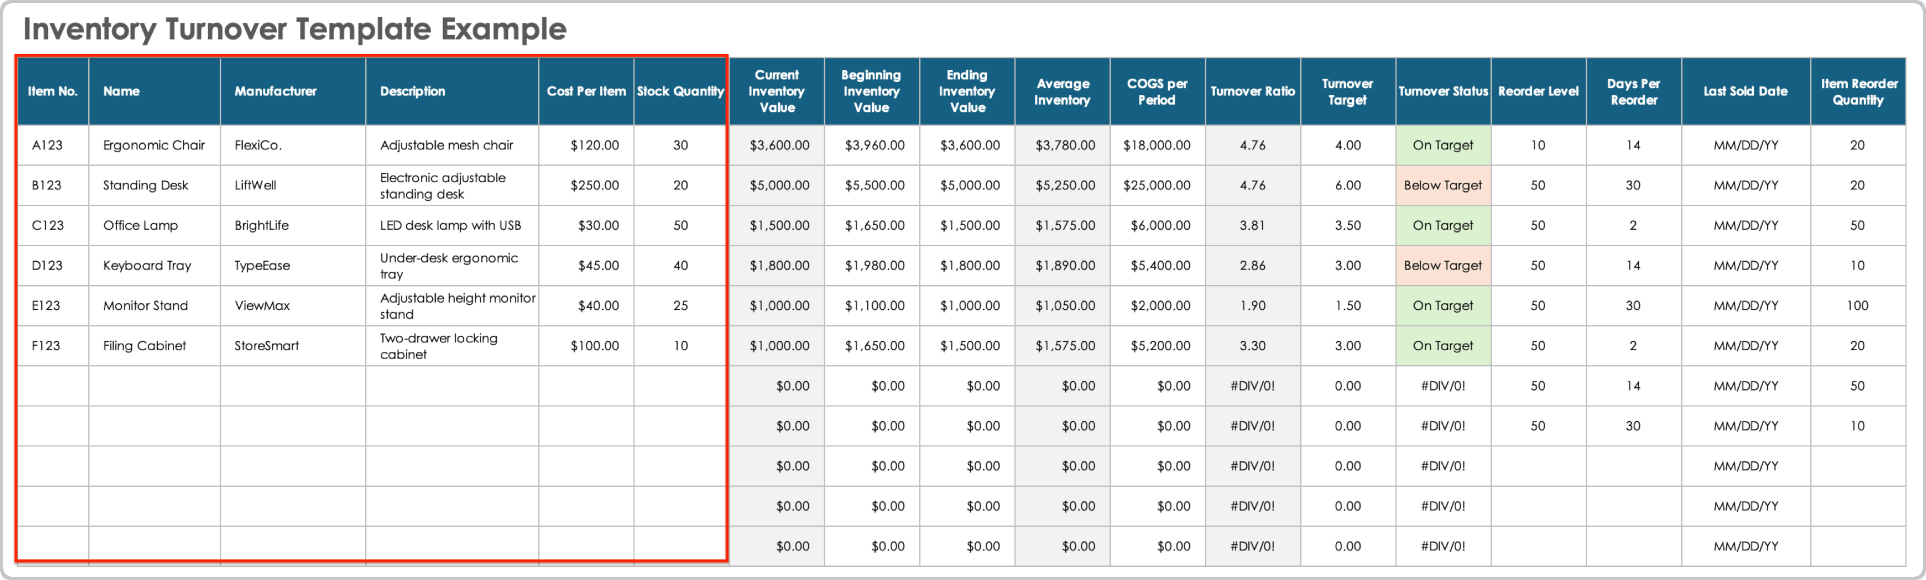
- Enter the beginning inventory value and ending inventory value for the period of time you’re tracking. The sheet will auto-calculate your average inventory. (Note: Your current inventory value may equal the beginning or ending value, depending on when you’re using the sheet. It also updates throughout the period.)
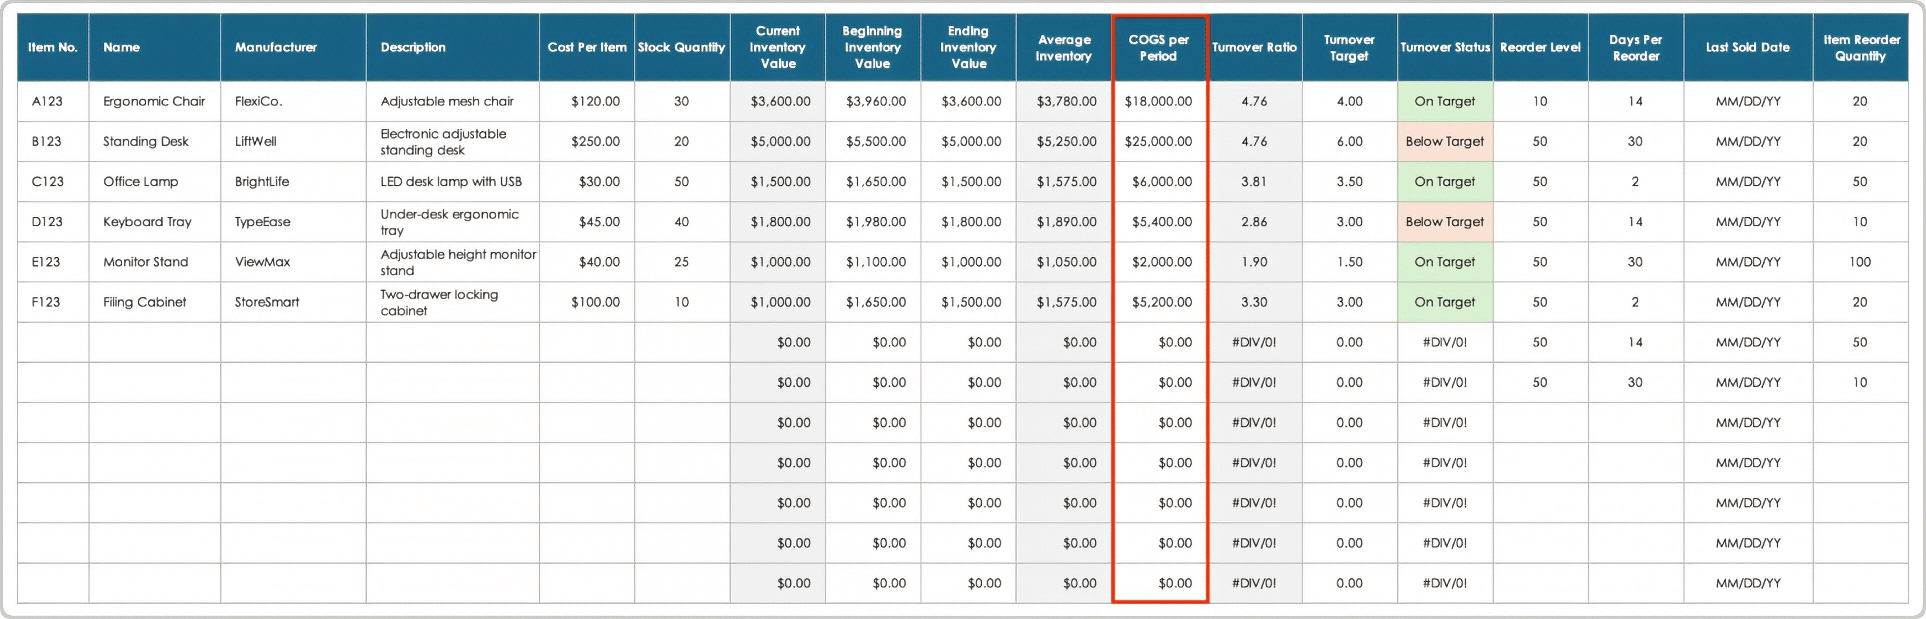
- In the COGS column, enter the total cost of goods sold for each product during your reporting period. (Note: This is not your sales revenue — it’s what you paid to buy or produce the items you sold.) The template will auto-calculate the inventory turnover ratio.
- Set your turnover target. Now that you can see your inventory turnover ratio, determine what it should be. The sheet auto-calculates whether you’re on or below target. To set your turnover target, use industry benchmarks as a starting point. You can also look at your own past turnover rates and set a goal that improves on your current performance without risking stockouts.
- Enter your reorder level, days per reorder, last sold date, and item reorder quantity. The reorder level is the stock threshold that should trigger a new purchase order (often based on how quickly the item sells and how long it takes to restock). To find this figure, multiply your average daily sales by the product’s lead time (in days), then add a small buffer for safety stock.
- Flag overstocks and understocks. Use standard Excel functionality to sort or filter your sheet to see which items have the highest or lowest turnover ratios, how they’re performing against their targets, and which you need to buy more or less.
- For a holistic view of your inventory, look at the totals for COGS, inventory, and a full-business turnover ratio at the bottom of the sheet.
Interested in other inventory templates? See the following:
Effectively Manage Your Inventory Turnover With Real-Time Work Management in Smartsheet
Empower your people to go above and beyond with a flexible platform designed to match the needs of your team — and adapt as those needs change.
The Smartsheet platform makes it easy to plan, capture, manage, and report on work from anywhere, helping your team be more effective and get more done. Report on key metrics and get real-time visibility into work as it happens with roll-up reports, dashboards, and automated workflows built to keep your team connected and informed.
When teams have clarity into the work getting done, there’s no telling how much more they can accomplish in the same amount of time. Try Smartsheet for free, today.