Excel Basic Value Stream Map Template
Download the Blank Basic Value Stream Map Template for Excel
Download the Sample Basic Value Stream Map Template for Excel
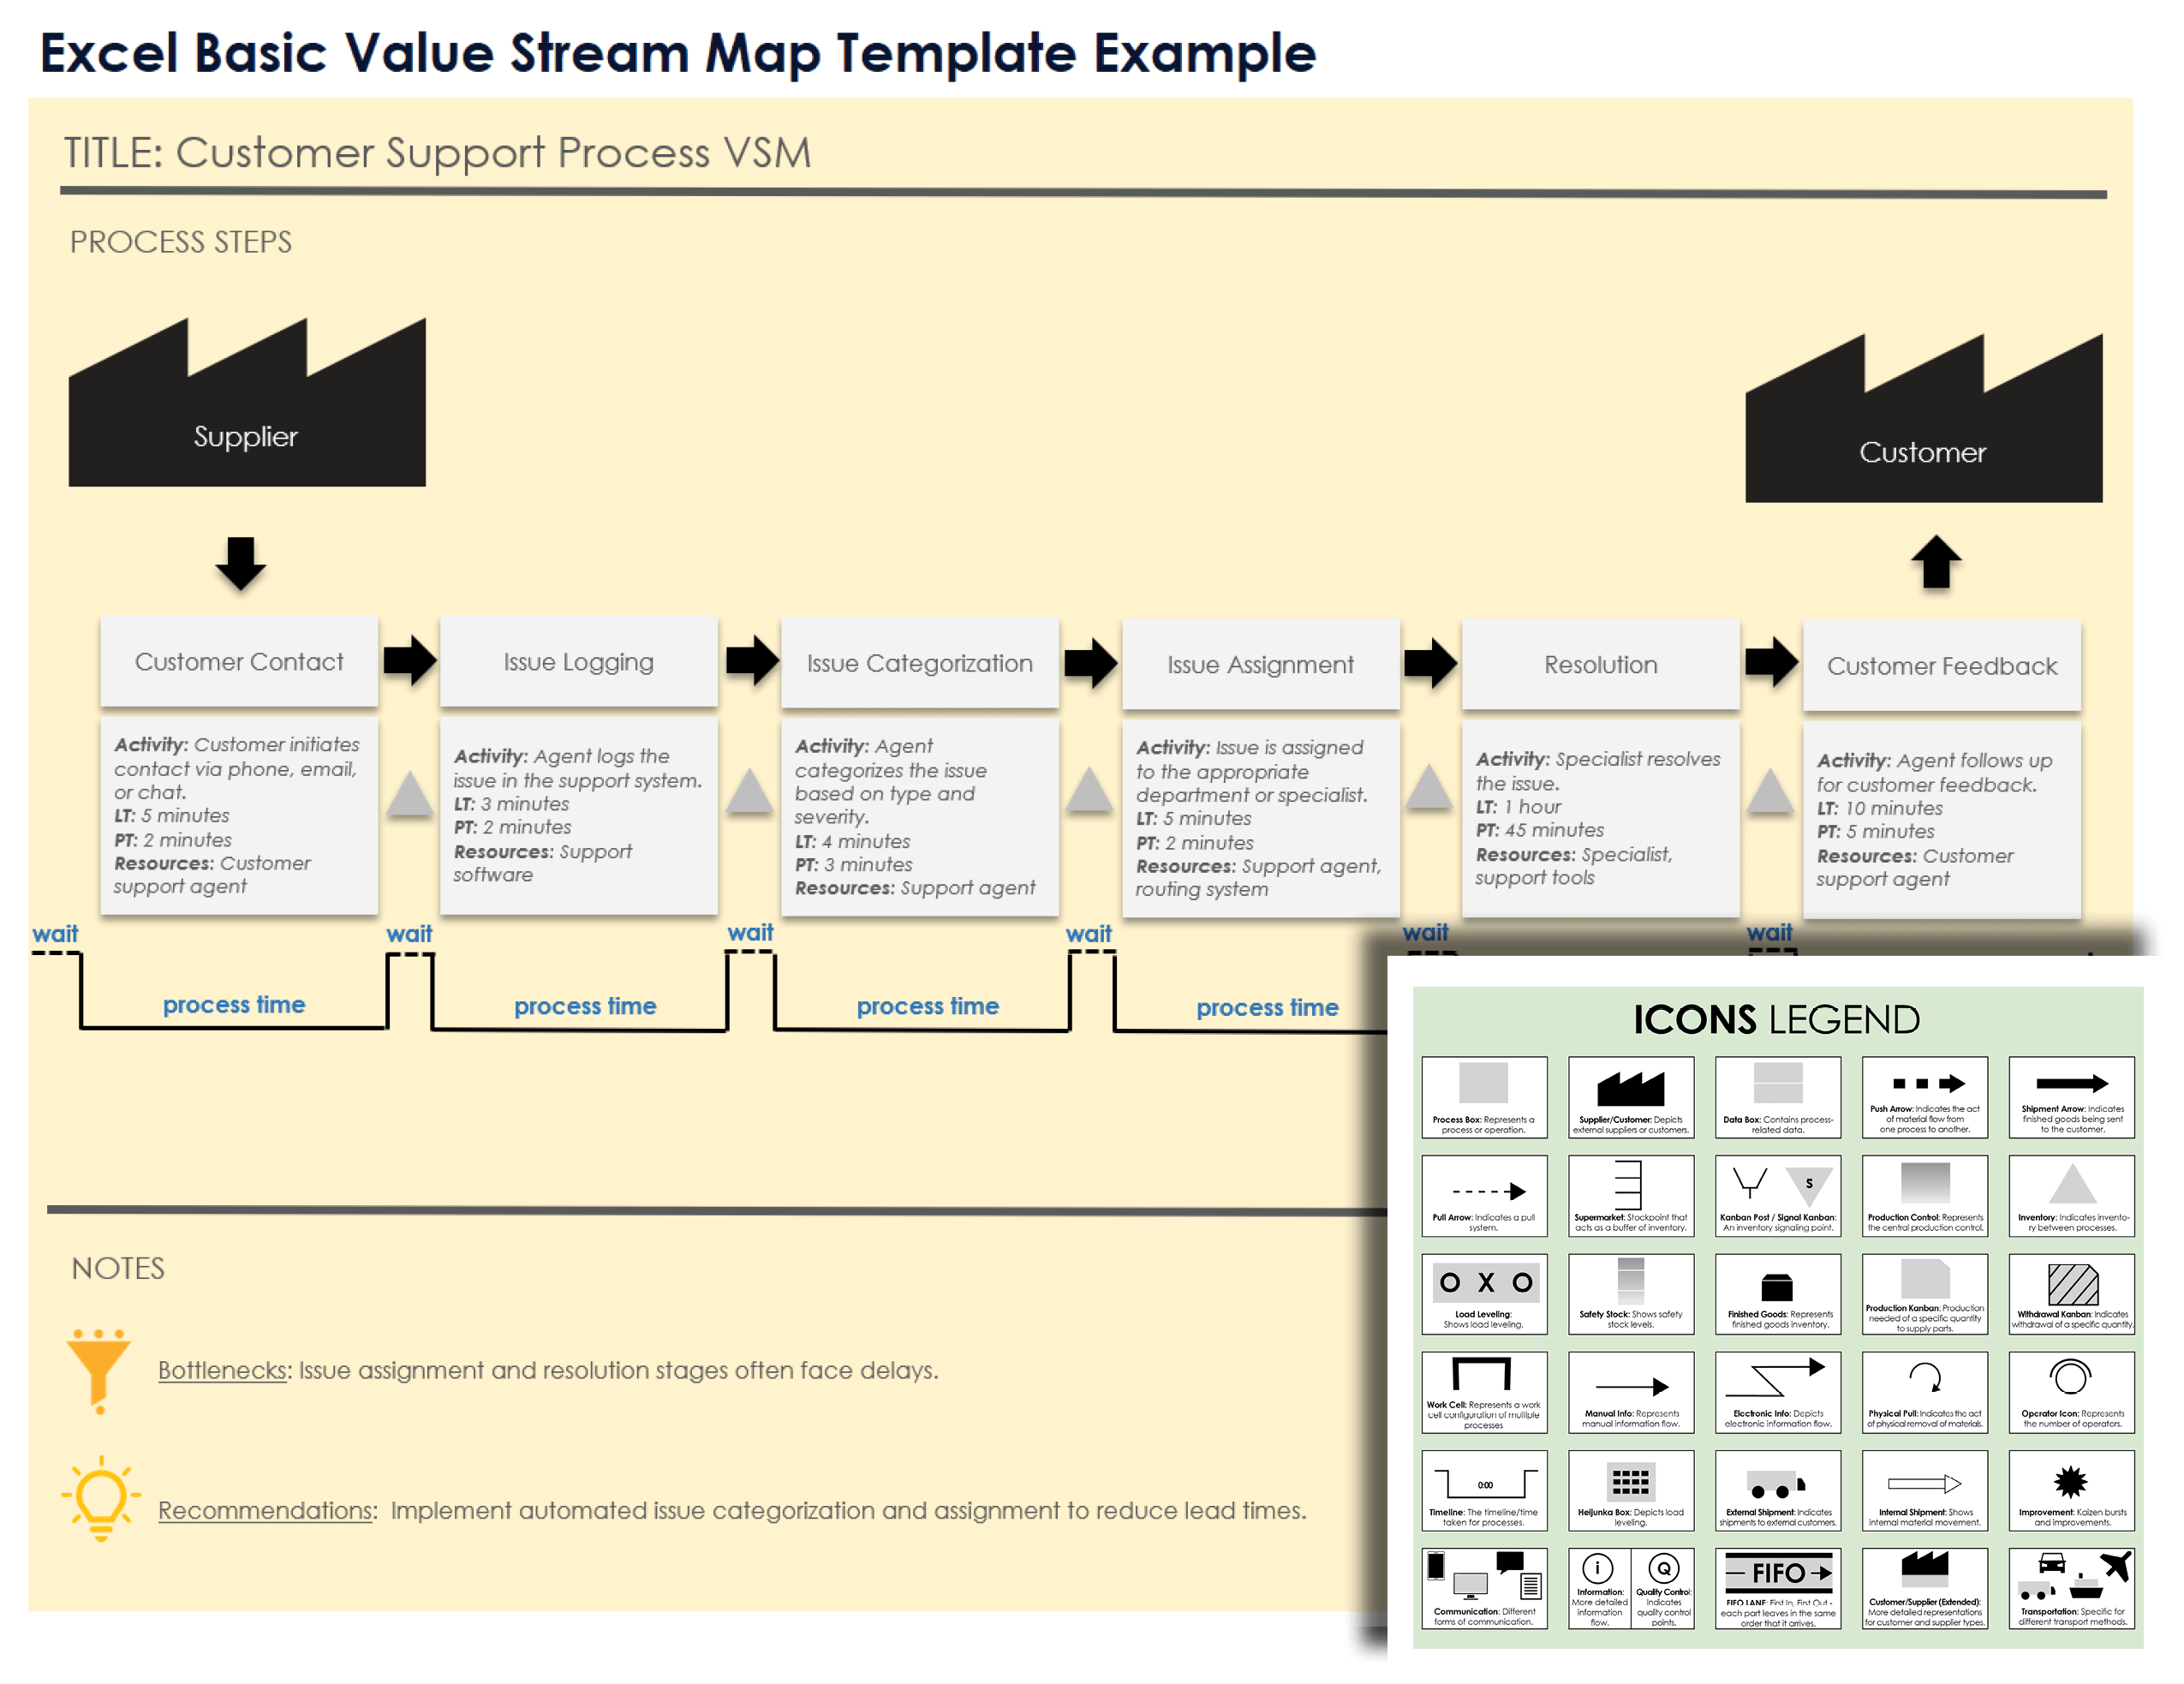
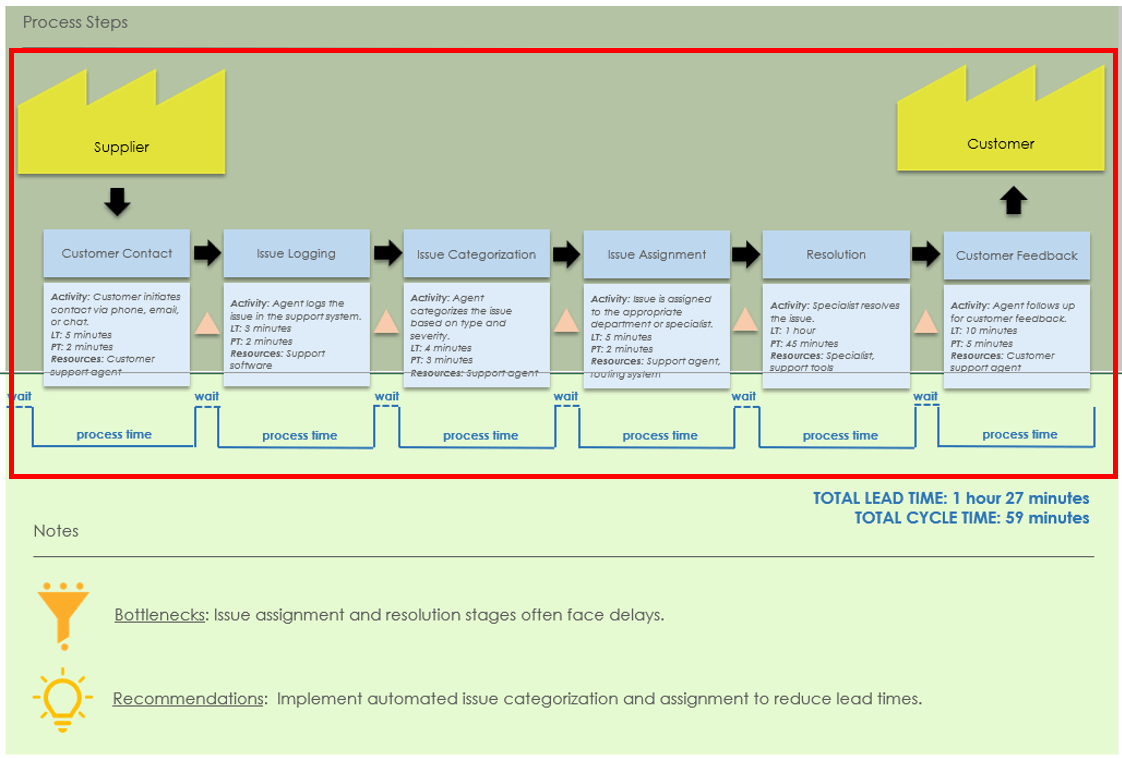
When to Use This Template: Use this basic value stream map template to analyze a process within your organization, identifying bottlenecks and opportunities for improvement. Download the version with sample data to see how value stream mapping can streamline a customer support process and illustrate the flow of customer interactions from initial contact to resolution.
Notable Template Features: This template helps you lay out detailed steps such as issue logging and categorization, highlighting lead time (L/T) and process times (P/T) for each stage. It enables you to see where to implement process enhancements and enhance operations.
Learn more about the VSM process in this comprehensive guide to creating value stream maps.
Excel Value Stream Current State Map Template
Download the Blank Value Stream Current State Map Template for Excel
Download the Sample Value Stream Current State Map Template for Excel
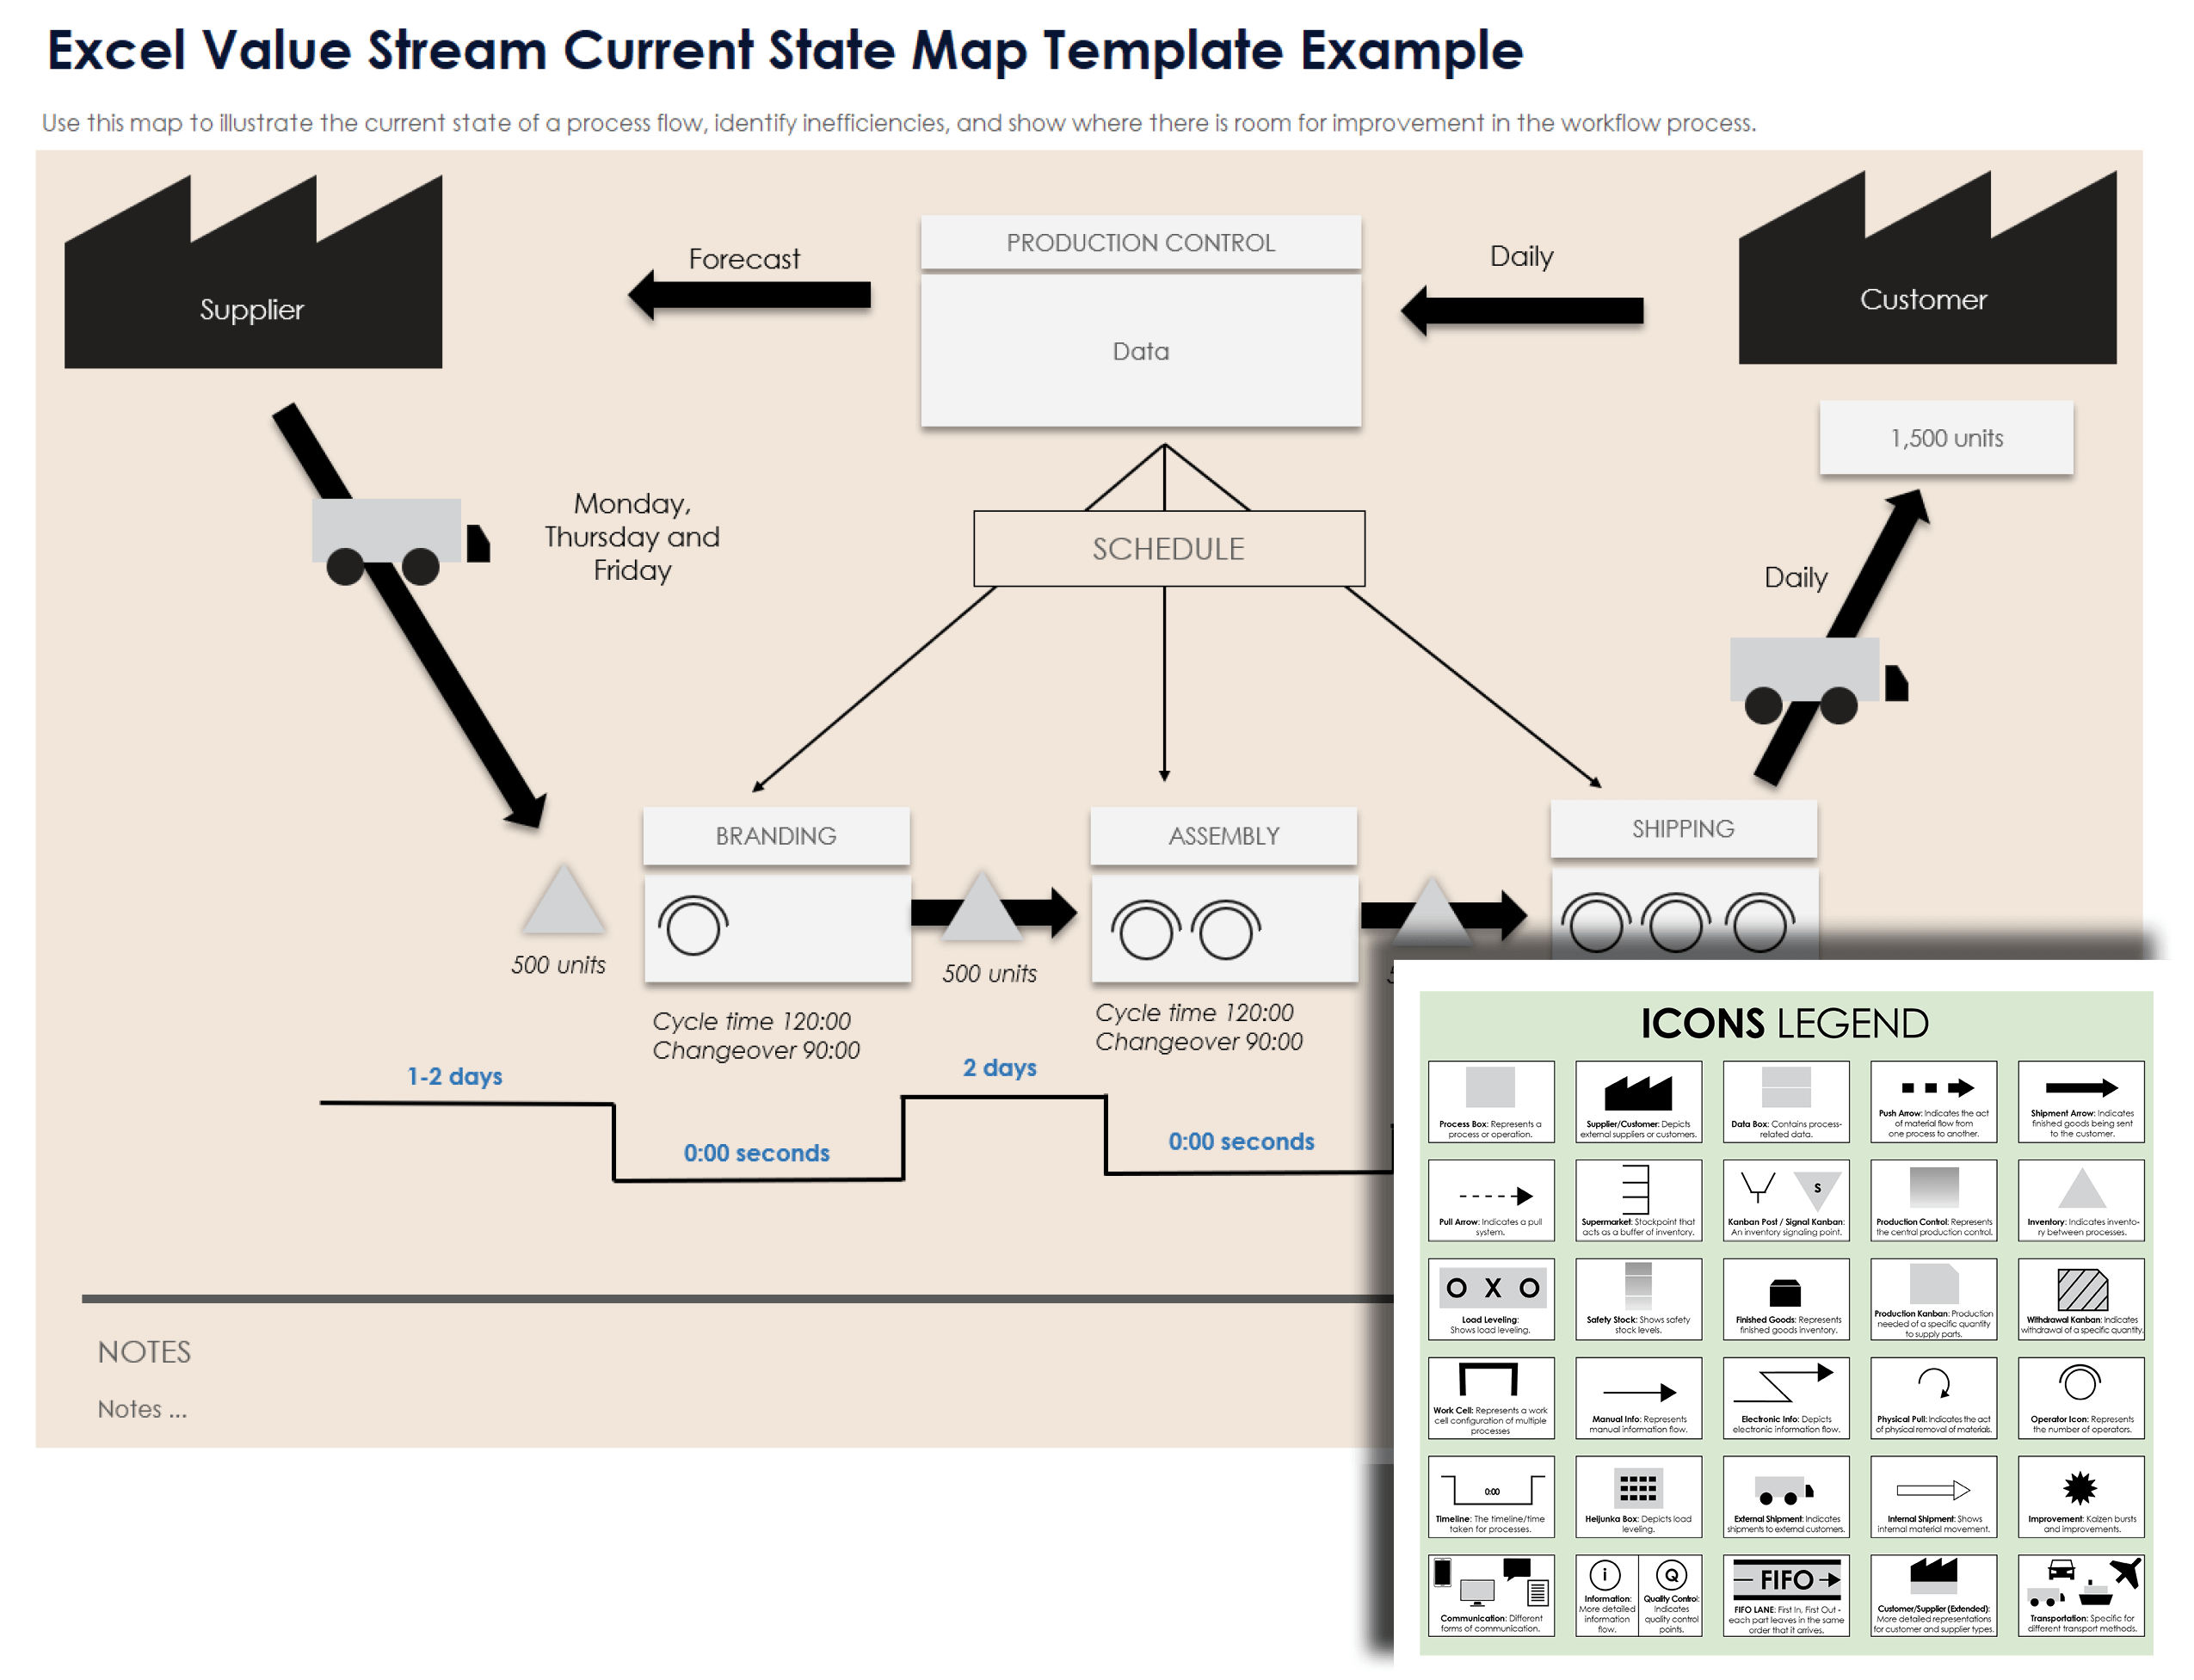
When to Use This Template: Use this value stream current state map template to capture a snapshot of your existing workflow. The template with or without sample data is ideal for creating a baseline visualization of your process and helping you identify inefficiencies and areas for improvement.
Notable Template Features: This template details each process step with specific lead and process times, providing a comprehensive overview of the current workflow. It can be customized for different industries to highlight critical stages and facilitate targeted enhancements.
To explore additional templates in a variety of file formats, see this article with more value stream mapping templates.
Excel Value Stream Future State Map Template
Download the Blank Value Stream Future State Map Template for Excel
Download the Sample Value Stream Future State Map Template for Excel
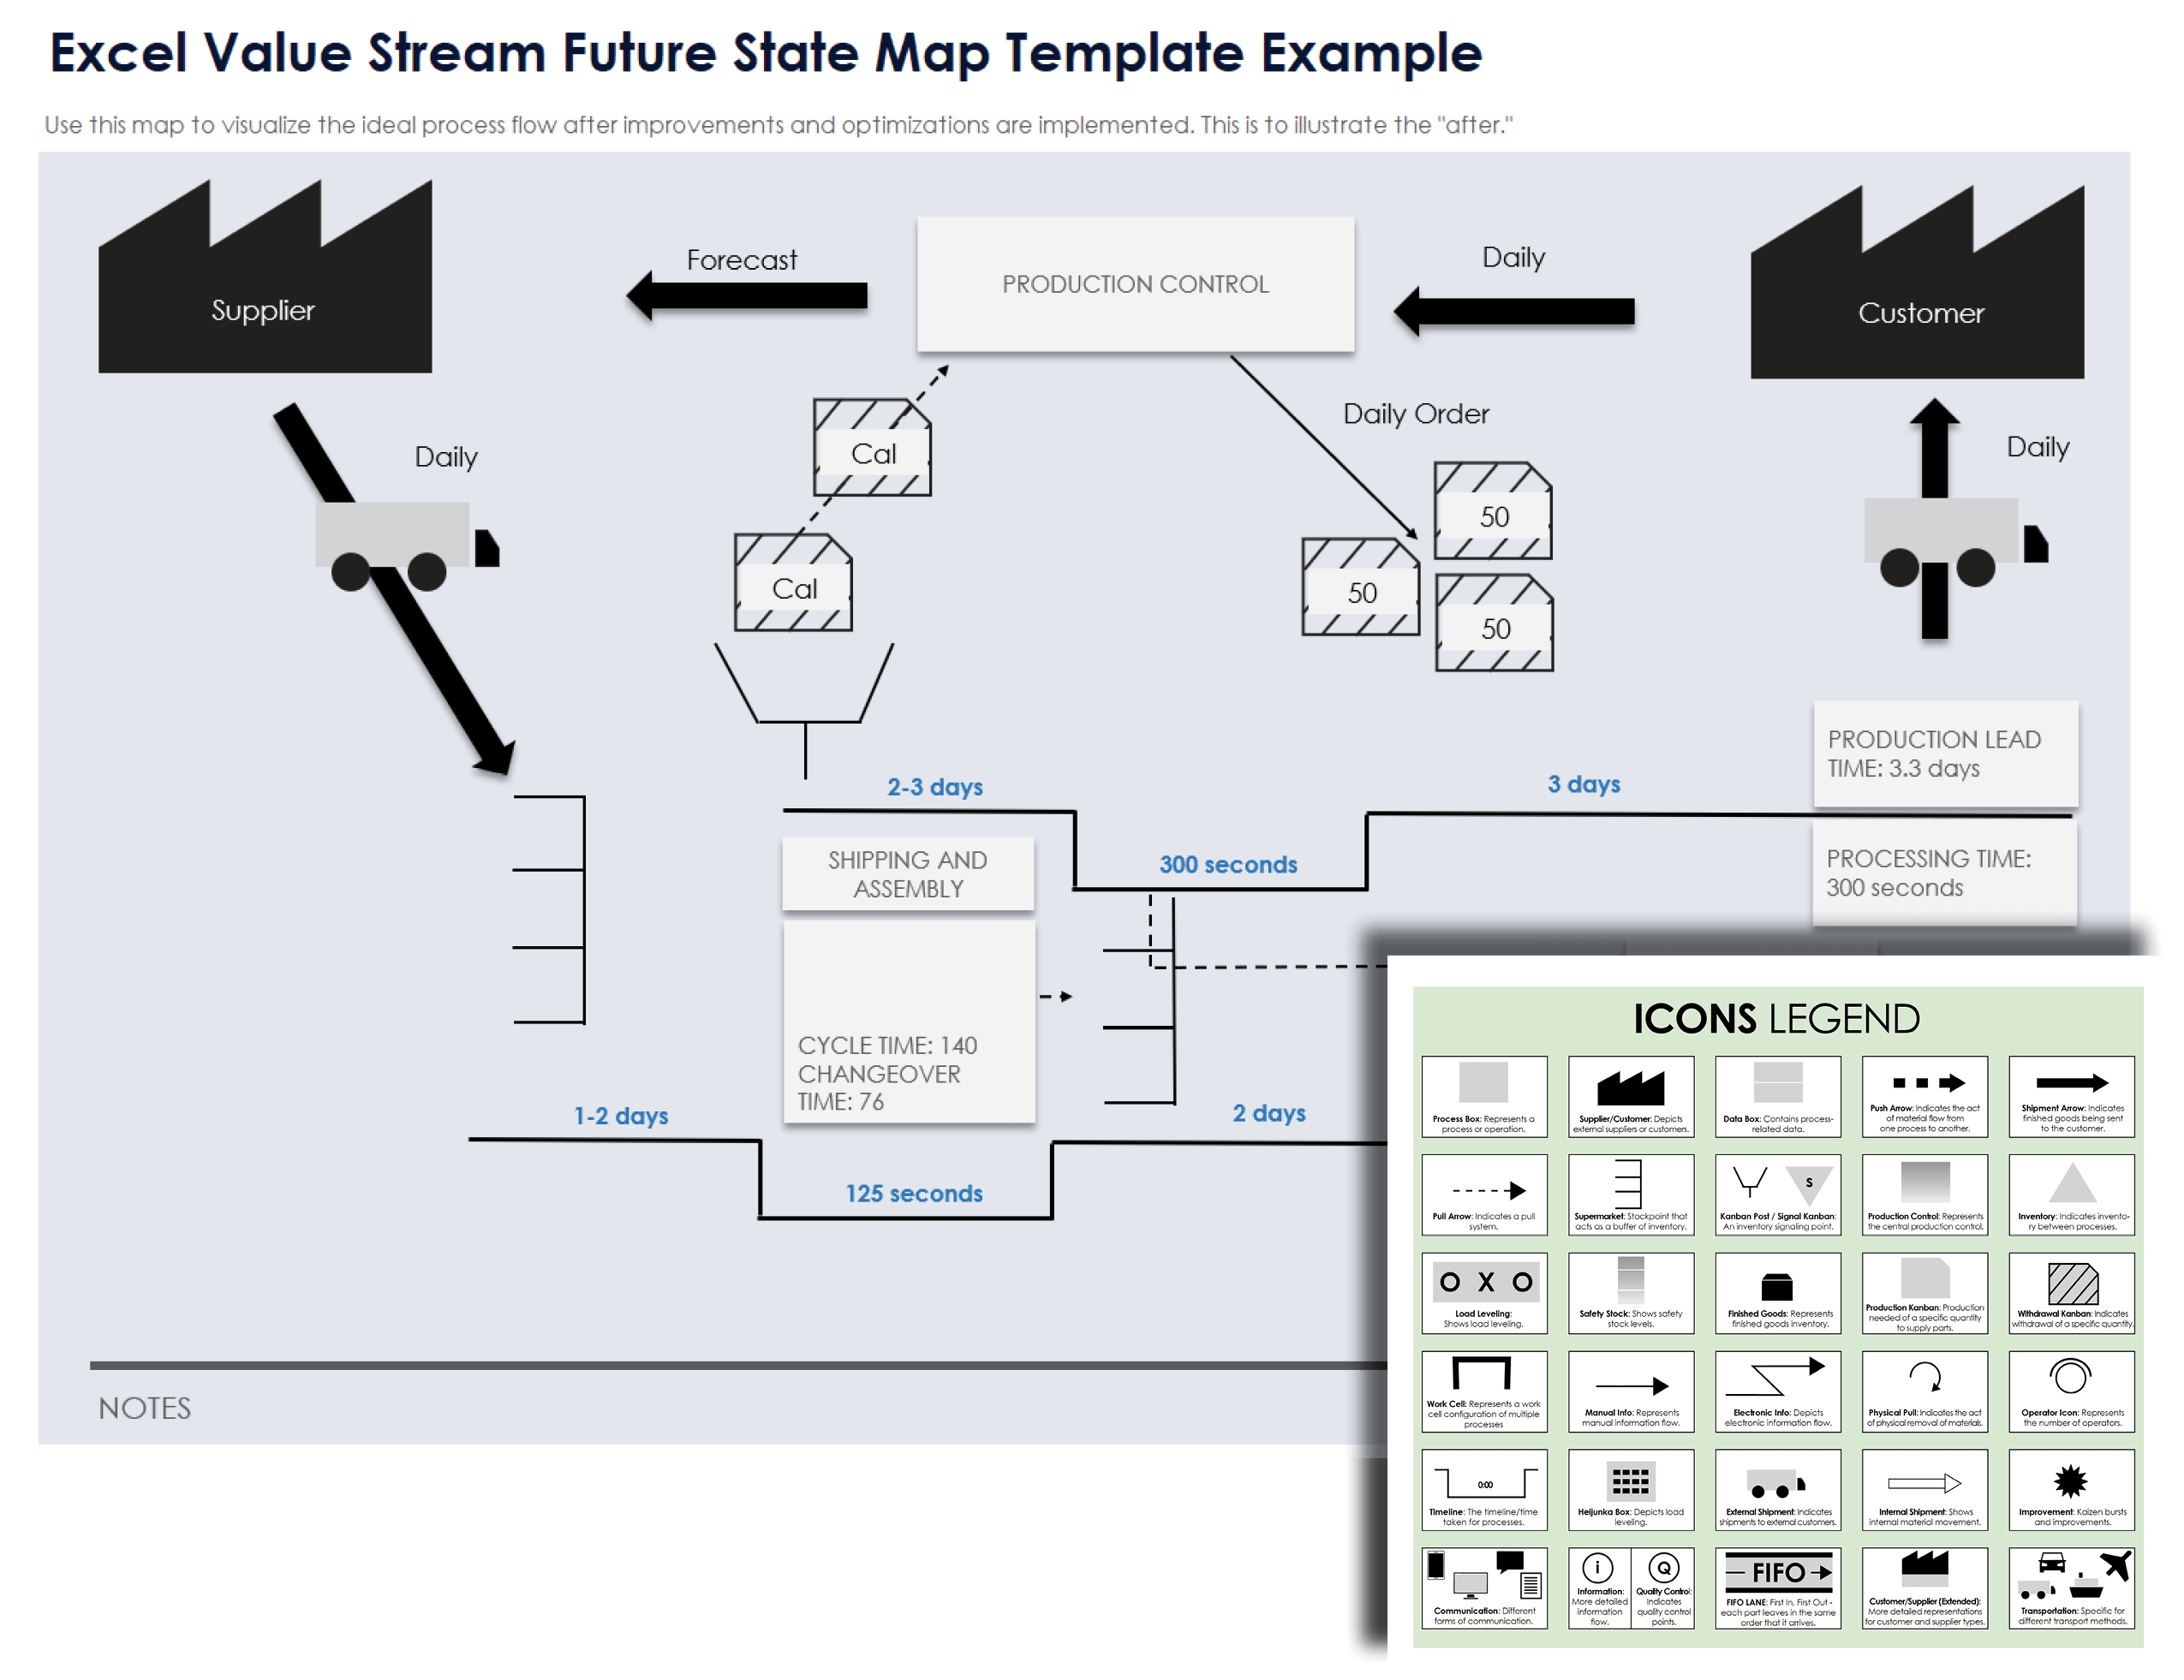
When to Use This Template: Leverage this value stream future state map template to design the optimized version of your production process, aiming to reduce waste and improve efficiency. Download the version with sample data to see how to plan improvements in workflows with stages for stamping, assembly, and shipping.
Notable Template Features: This template incorporates key elements such as forecast, daily orders, and time metrics, offering a detailed framework to guide process enhancements. It enables you to focus on critical aspects such as cycle time, changeover time, and processing time, ensuring comprehensive planning for improvements.
Take a look at this complete workflow mapping toolkit for helpful tips, methods, and examples.
Excel Extended Value Stream Map Template
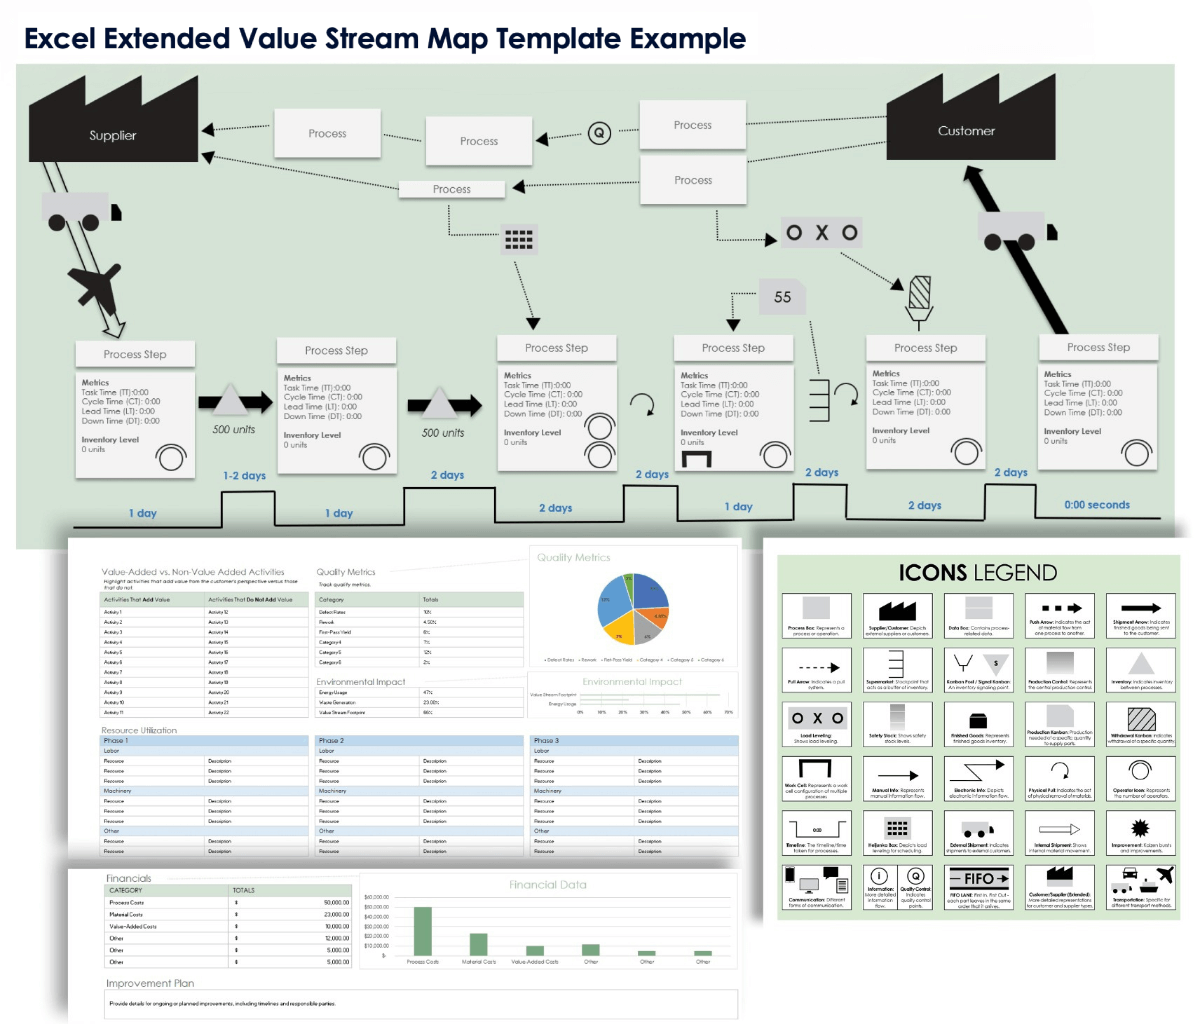
Download the Blank Extended Value Stream Map Template for Excel
Download the Sample Extended Value Stream Map Template for Excel
When to Use This Template: This extended value stream map template is perfect for a comprehensive analysis of complex processes, integrating detailed metrics and multiple layers of information. Available with or without sample data, it's ideal for organizations seeking to map out their entire supply chain, from suppliers to customers.
Notable Template Features: This template helps you evaluate a variety of key metrics, such as cycle time and inventory levels, and covers multiple process layers and extended supply chain interactions. It also highlights value-added versus non-value-added activities, tracks quality metrics, and incorporates financial and environmental data, providing a holistic view of the value stream.
For an in-depth look at how to visualize work processes, check out this essential guide to business process mapping.
Excel SIPOC (Supplier-Input-Process-Output-Customer) Diagram Template
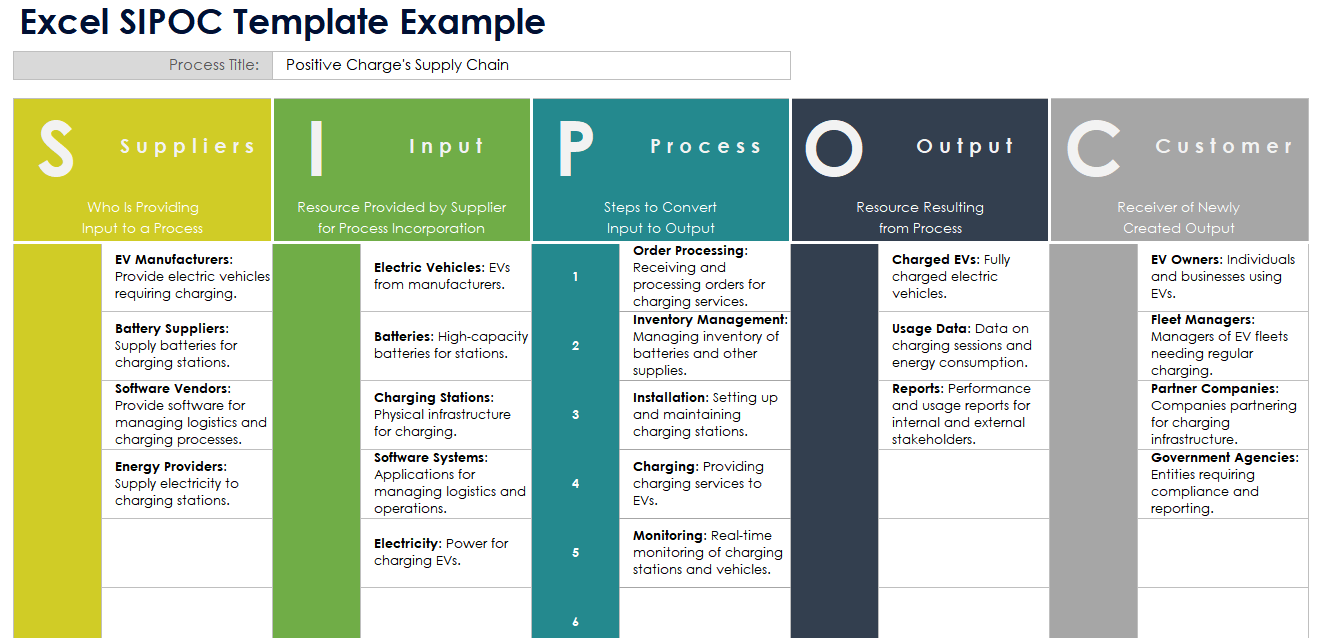
Download the Blank SIPOC Diagram Template for Excel
Download the Sample SIPOC Diagram Template for Excel
When to Use This Template: Employ this template to gain a high-level overview of your business process, detailing the relationships between suppliers, inputs, processes, outputs, and customers (SIPOC). With or without sample data, this diagram is an essential starting point for detailed value stream mapping and enables stakeholders to align on the key components of any supply chain.
Notable Template Features: This template breaks down each segment of the SIPOC model, from suppliers to essential materials and information — and the process steps that transform those materials and get them to customers. It offers space to highlight outputs such as performance reports and customer data, providing insights applicable to any industry.
Excel Value Stream Map Swimlane Diagram Template
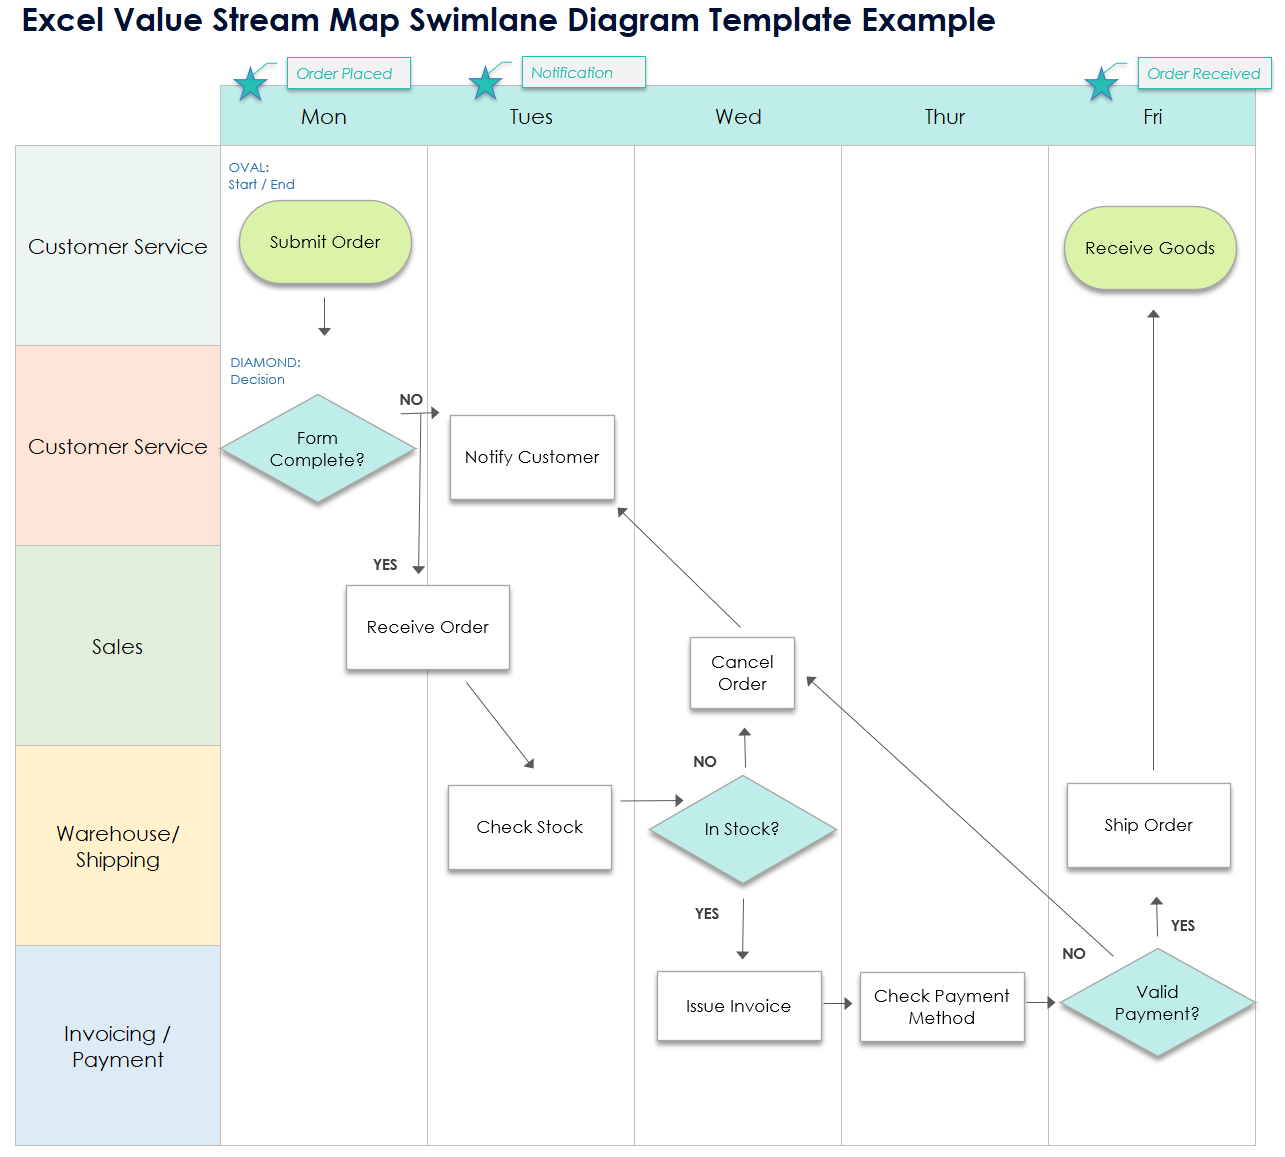
Download the Blank Value Stream Map Swimlane Diagram Template for Excel
Download the Sample Value Stream Map Swimlane Diagram Template for Excel
When to Use This Template: This VSM swimlane diagram template is ideal for organizing process steps across different departments or functions and clarifying roles and responsibilities. This template with or without sample data is particularly useful when processes involve multiple teams, such as customer service, sales, and warehousing.
Notable Template Features: This template includes customizable swimlanes for customer service, sales, shipping, and accounting teams, providing a clear timeline of activities such as "Submit order form" and "Check stock." It helps you map out the flow of tasks and decision points across departments.
Discover ways to improve efficiency by visiting this article on how to streamline your work processes.
Excel Lead Time Ladder Template
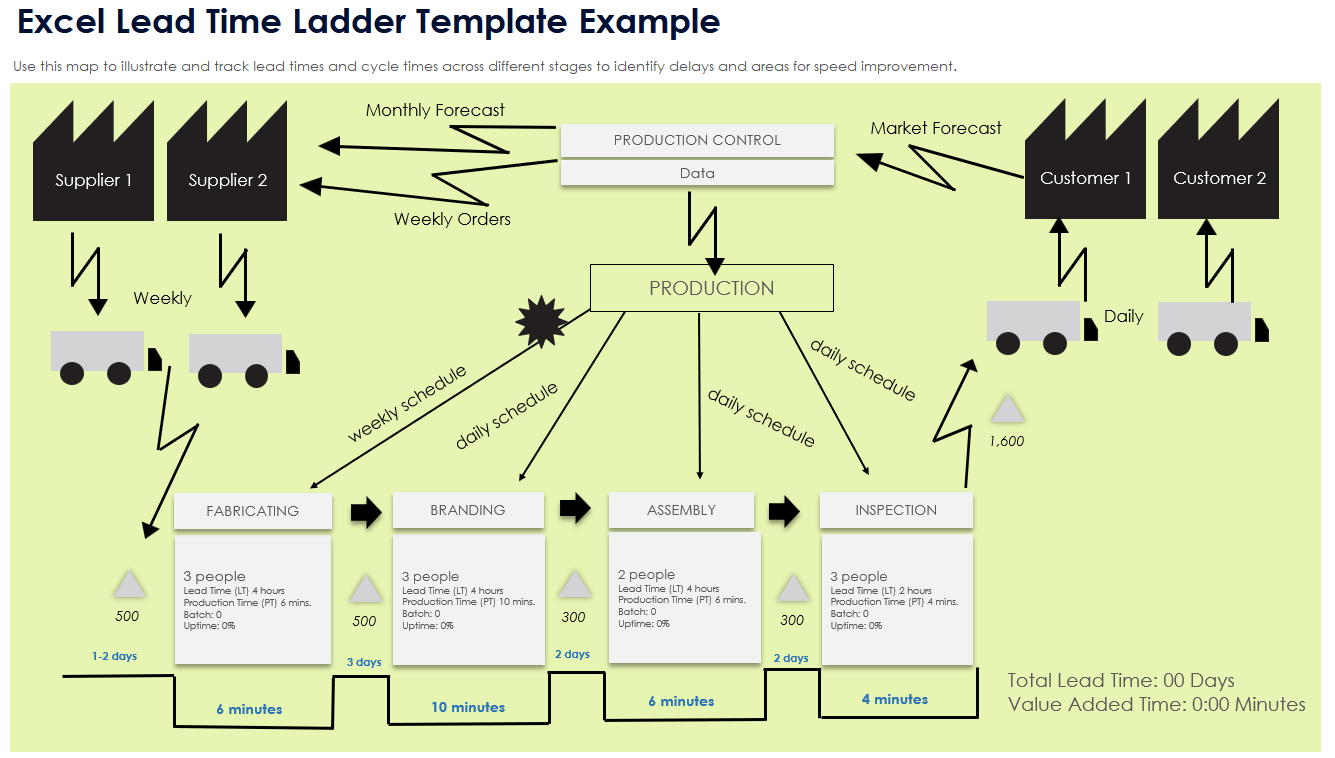
Download the Blank Lead Time Ladder Template for Excel
Download the Sample Lead Time Ladder Template for Excel
When to Use This Template: Use this template with or without sample data to visualize processes involving multiple departments and understand how time is spent — and lost — at each step. Ideal for tracking the flow of orders and deliveries, it highlights lead times across customer service, sales, warehouse, and invoicing.
Notable Template Features: This template focuses on lead time as a key metric for efficiency at each stage of the process, from customer service interactions to the delivery of goods. The template includes swimlanes for different functions, so you can create a detailed timeline for activities such as order submission, stock checking, and invoicing.
Excel Value Stream Mapping Board Template
Download the Blank Value Stream Mapping Board Template for Excel
Download the Sample Value Stream Mapping Board Template for Excel
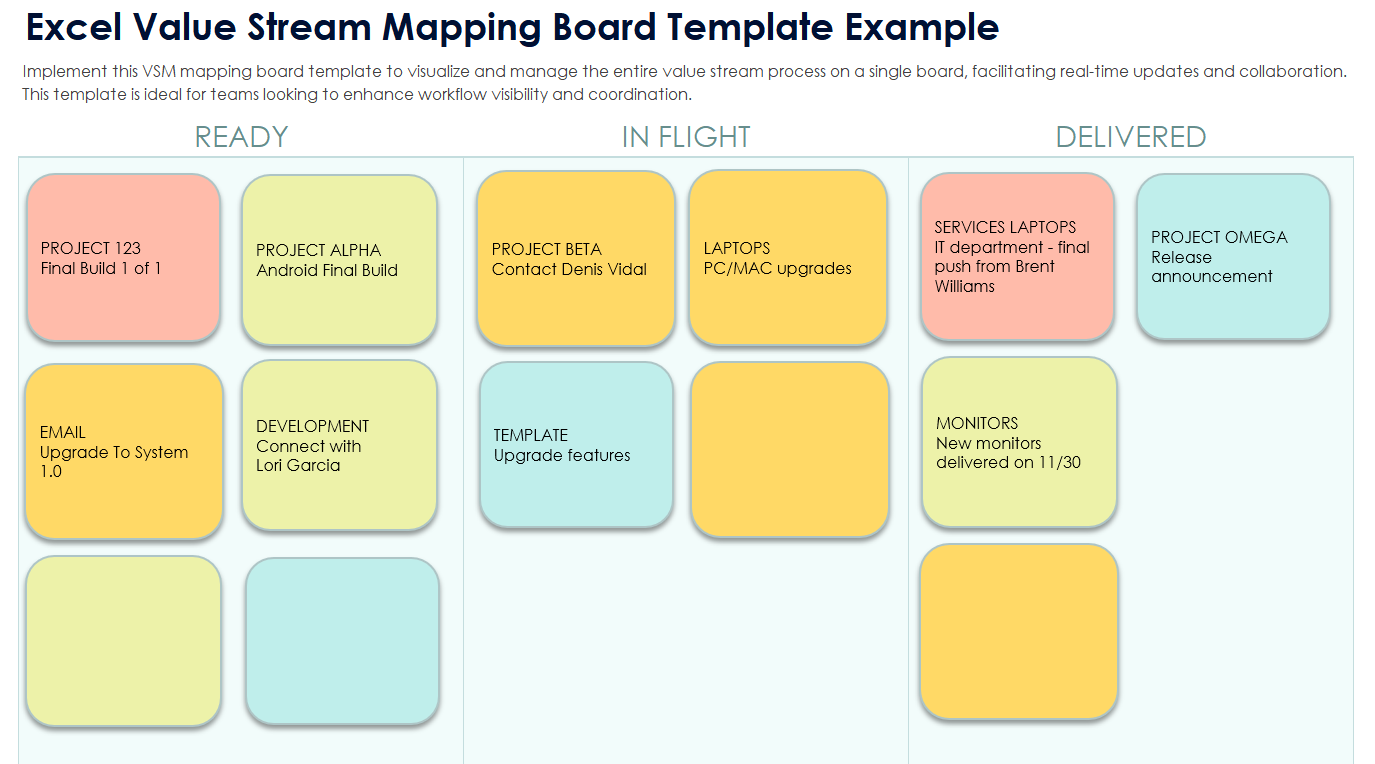
When to Use This Template: Implement this template to manage the entire value stream process on a single board, facilitating real-time updates and collaboration. This template with or without sample data is ideal for teams looking to enhance workflow visibility and coordination.
Notable Template Features: This template enables you to create a comprehensive overview of the value stream and easily track process steps and progress. It includes sections for monitoring key metrics, as well as clear visual cues to highlight bottlenecks and improvements.
How to Create a Value Stream Map in Excel
Create a value stream map to visualize your key business processes. Define your scope, gather data, and download a customizable template that fits your needs. Analyze the flow of your value stream to identify improvement opportunities and facilitate growth planning.
Follow these step-by-step instructions to create an effective value stream map:.
Define Your Scope and Objectives
Identify the process or value stream you want to evaluate, and outline your objectives for creating the value stream map.
Gather Necessary Data
Collect all relevant data, including input and output metrics, process times, and any existing documentation.
Identify Key Components
Determine the key components of your value stream, such as suppliers, inputs, processes, outputs, and customers.
Choose an Existing Template
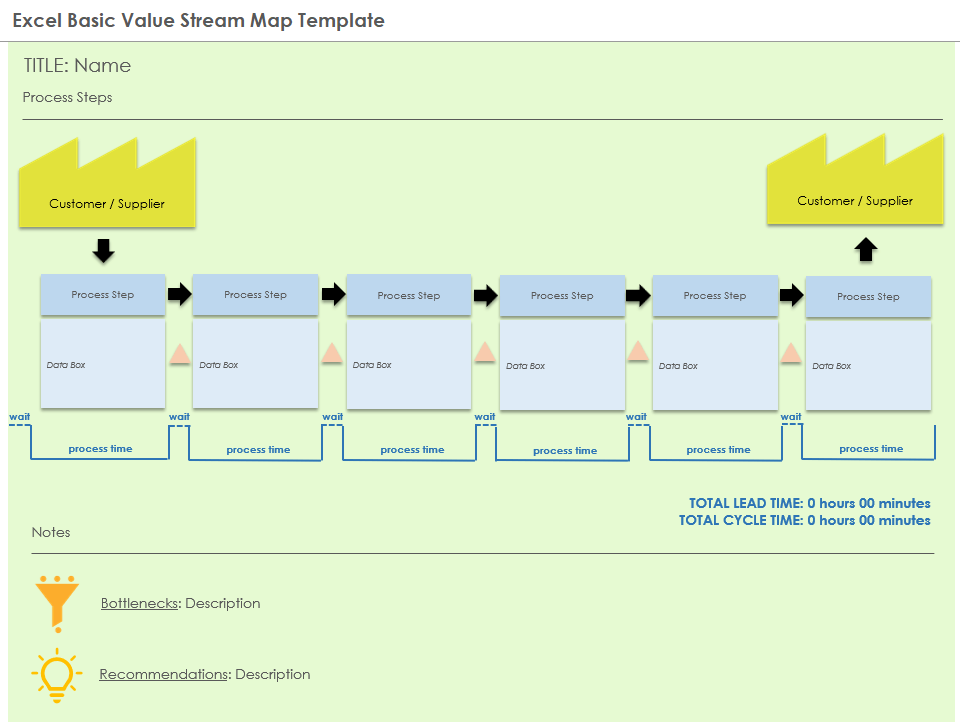
Select a suitable VSM template — such as this Excel basic value stream template — that aligns with your process.
Customize the Template
Customize the selected template to meet your unique requirements by adding, removing, or altering sections to better represent your business’s distinct processes and objectives.
Map the Process
Fill in the sections of the template with the details of each step in the process in sequence, tracking the flow of materials and information.
Start with the Customer or Supplier
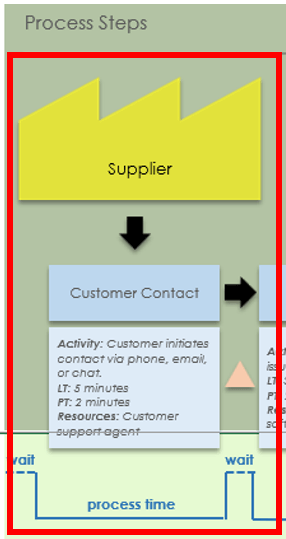
Begin your value stream map by documenting the customer or supplier and their inputs to your operation, establishing a clear starting point for orders or production processes.
Map Out the Remaining Steps
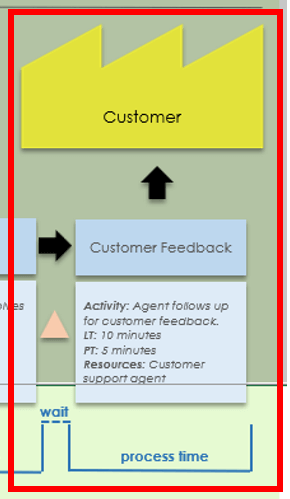
Continue mapping out each subsequent step in the stream, delineating how materials move through each stage of the process and how information is transmitted between departments. Include details about activities, resources, lead times, and process times.
Analyze the Flow
Examine the value stream map to identify inefficiencies, bottlenecks, and opportunities for improvement. Look for steps that are over or under process capacity, potential workflow imbalances, and non-value-added time.
Implement and Monitor Changes
Make adjustments based on your analysis, and continuously monitor the process to ensure improvements are effective.
Review and Update
Regularly review the value stream map, and update it as needed to reflect changes and ongoing improvements in the process.
Streamline Your Business Processes with Real-Time Work Management in Smartsheet
Empower your people to go above and beyond with a flexible platform designed to match the needs of your team — and adapt as those needs change.
The Smartsheet platform makes it easy to plan, capture, manage, and report on work from anywhere, helping your team be more effective and get more done. Report on key metrics and get real-time visibility into work as it happens with roll-up reports, dashboards, and automated workflows built to keep your team connected and informed.
When teams have clarity into the work getting done, there’s no telling how much more they can accomplish in the same amount of time. Try Smartsheet for free, today.
