Six Sigma Tools
Six Sigma is a quality measurement that represents 3.4 Defects Per Million Opportunities. That’s a lofty goal for many business processes, but you can use Six Sigma methods to improve quality and performance in varying degrees based on the needs and objectives of a business or project. Six Sigma tools range from statistical charts, illustrative diagrams, and data collection methods to project management and process analyzation worksheets. These tools may not be exclusive to Six Sigma, but they can be applied in specific ways to focus on process improvement. The tools required depend on the project requirements and team roles. Depending on one’s training and experience, a Six Sigma professional may be involved in improvement initiatives at the White, Yellow, Green, or Black Belt level. White Belts generally have supporting roles, while Yellow Belts act as team members, Green Belts collect and analyze data, and Black Belts serve as project leaders.
In the following sections, you’ll find a number of free, downloadable templates that you can use as Six Sigma tools.
Project Management Guide
Your one-stop shop for everything project management

Ready to get more out of your project management efforts? Visit our comprehensive project management guide for tips, best practices, and free resources to manage your work more effectively.
Project Charter Template
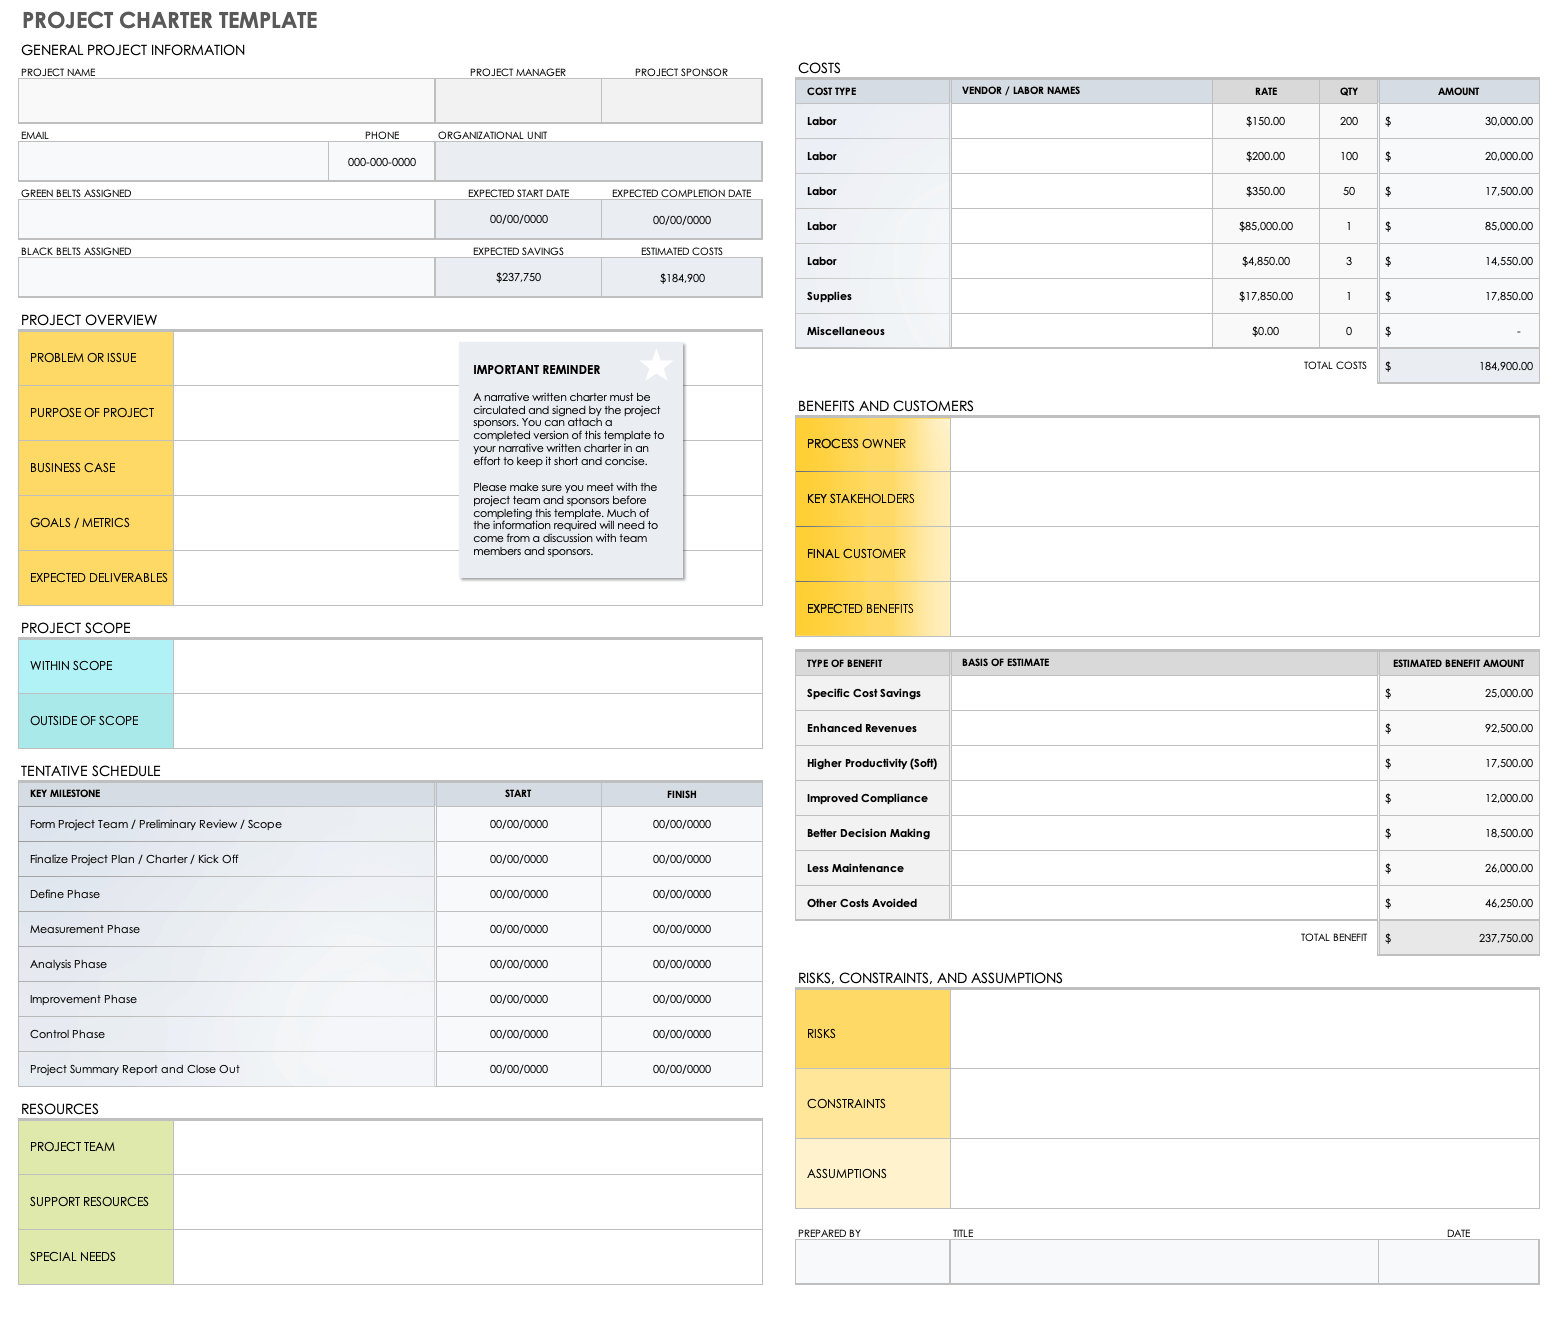
This Six Sigma Excel template is designed to help you create a project charter that will serve as an agreement between management and your team. A project charter provides an overview of a project including team roles and responsibilities, financial information, goals, and constraints. Creating a detailed project charter will help define your project and its expected outcome, and provide a high-level roadmap to follow.
Download Project Charter Template
Excel | Word | Smartsheet
Implementation Plan Template
It’s important to refer to previous research and planning to help create an effective action plan. Once you know what actions to take, this implementation plan template helps you organize them by priority, assign ownership, track progress, and update the plan as needed. This is an important Six Sigma tool for taking concrete actions toward achieving measurable objectives.
Download Implementation Plan Template
Stakeholder Analysis Template
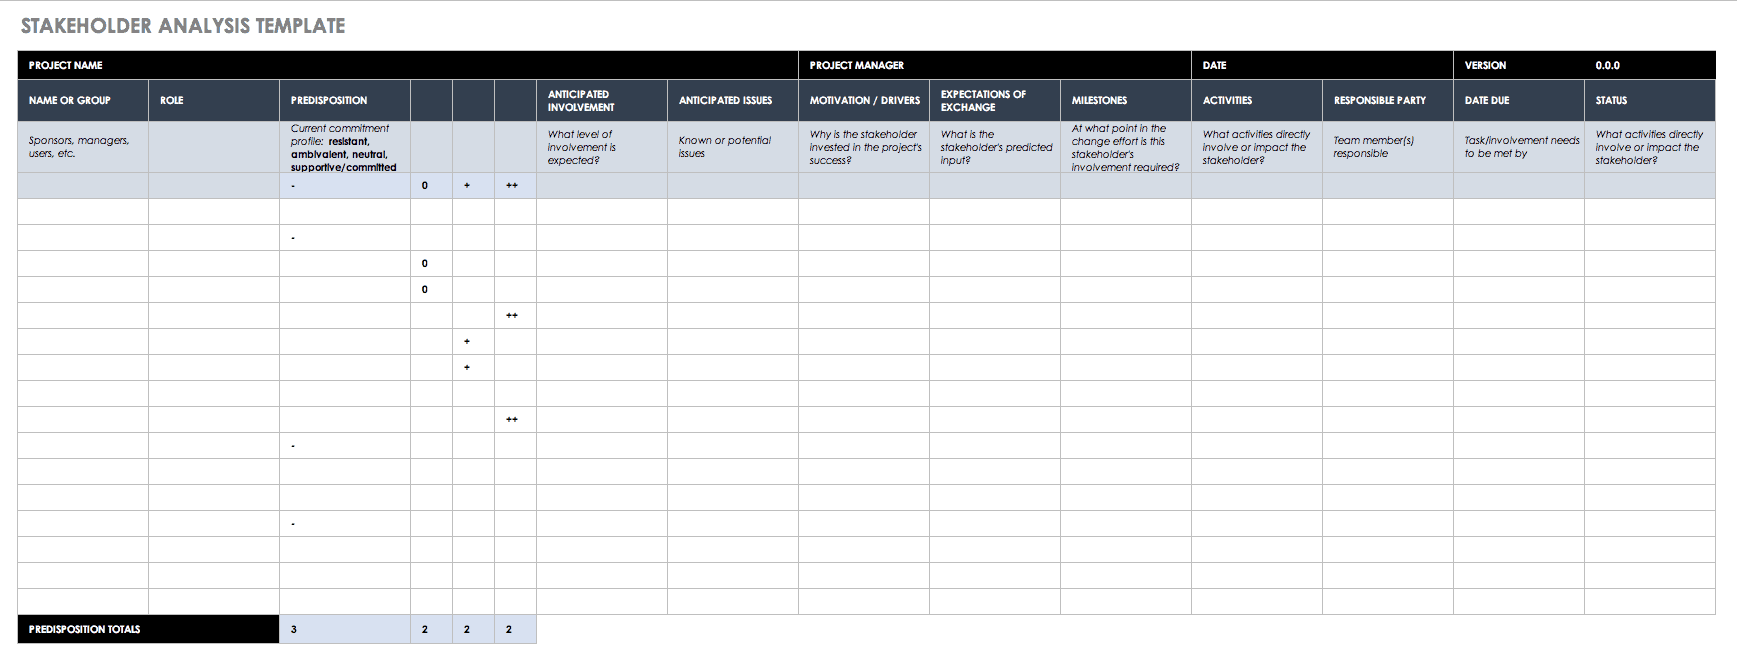
You can use this template to identify and analyze stakeholders in order to enlist support for a project. The template allows you to closely examine important factors such as issues that may be influencing stakeholders, their vested interest in a project, or the level of influence and support. Understanding the views and expectations of stakeholders can help you anticipate and address issues in advance and move your project toward success.
Download Stakeholder Analysis Template
SWOT Analysis Template
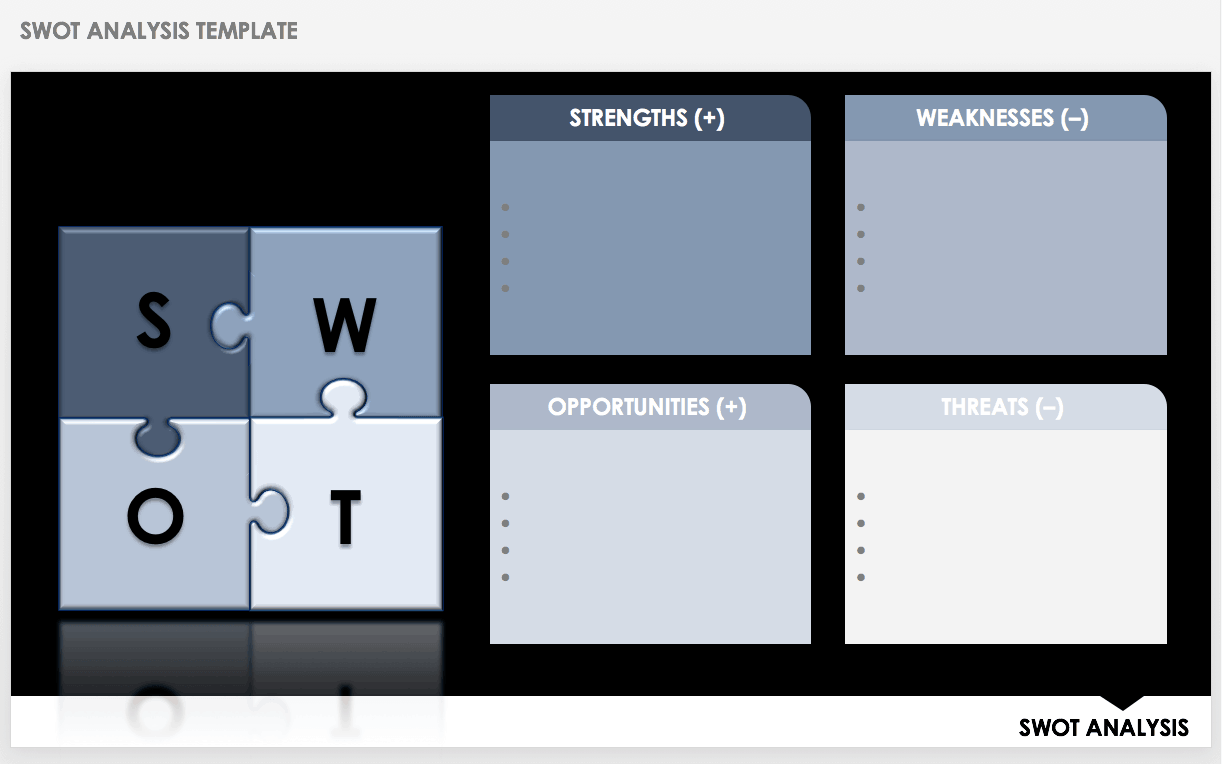
Use this SWOT analysis template for strategic planning and to create dynamic PowerPoint presentations. List the strengths, weaknesses, opportunities, and threats related to an idea, process, or organization, and use this information for strategic analysis. Easily add this PowerPoint slide to any presentation for visual communication with project team members or other stakeholders.
Download SWOT Analysis Template - PPT
Fishbone Diagram Template
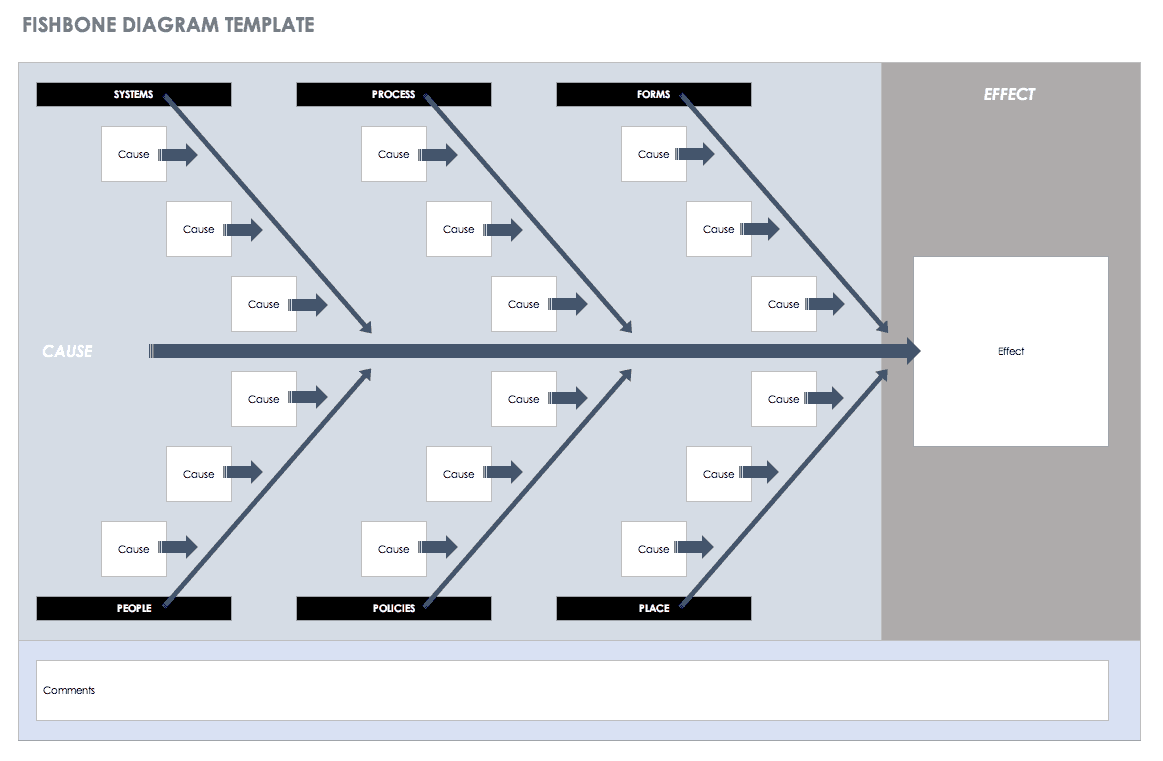
A fishbone diagram, also known as a cause and effect diagram or Ishikawa diagram, helps teams brainstorm the causes of a certain event. Use this Six Sigma tool along with the 5 Whys template to determine root causes. One of the benefits of using a fishbone diagram is the visual layout, which makes it easy to compile and view information, and see the relationships between different elements.
Download Fishbone Diagram Template - Excel
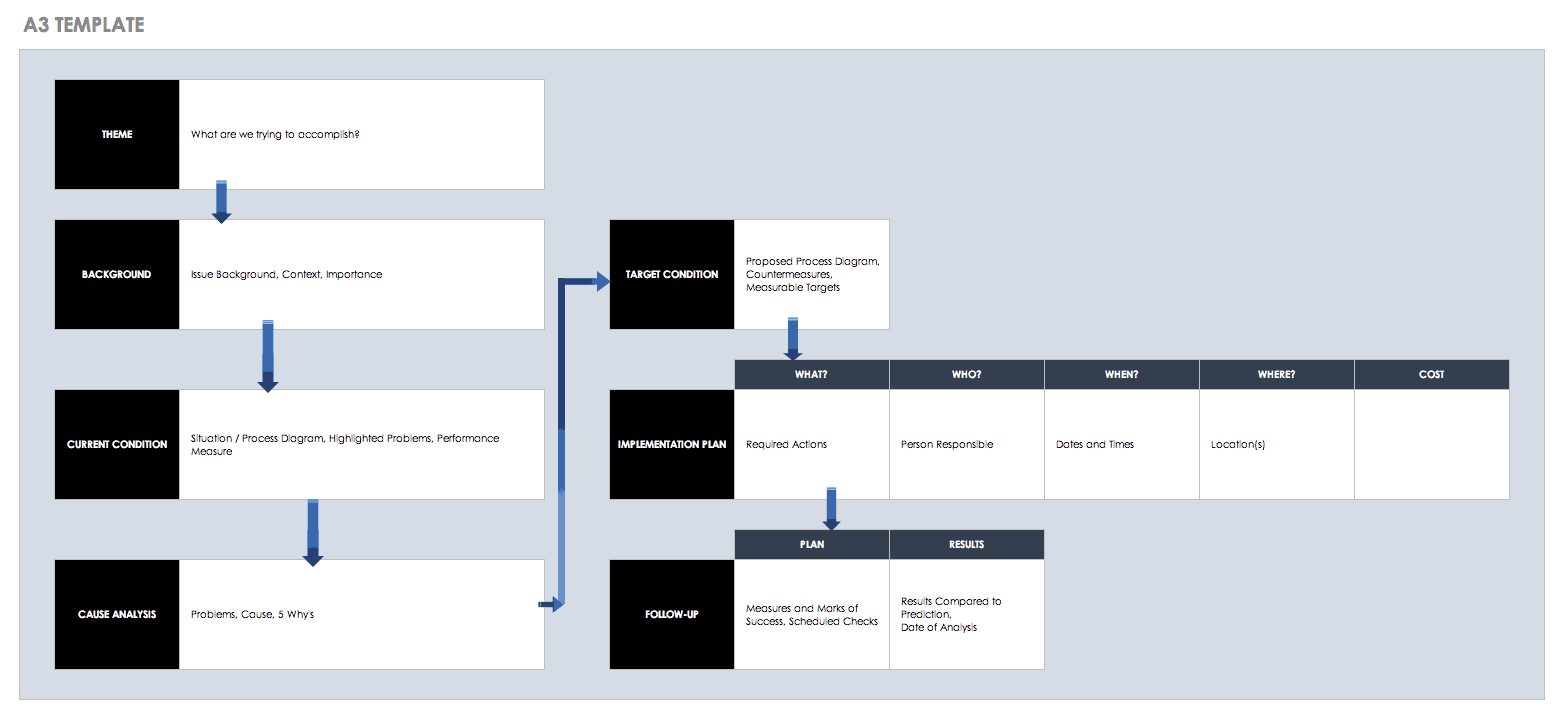
A3 Template
A3 is an approach to problem solving that grew out of Lean Manufacturing at Toyota. The A3 report condenses project information onto a single page in an easy-to-read, graphical format. This A3 template provides sections for describing background information, current conditions, root cause analysis, target conditions, implementation plan, and follow-up.
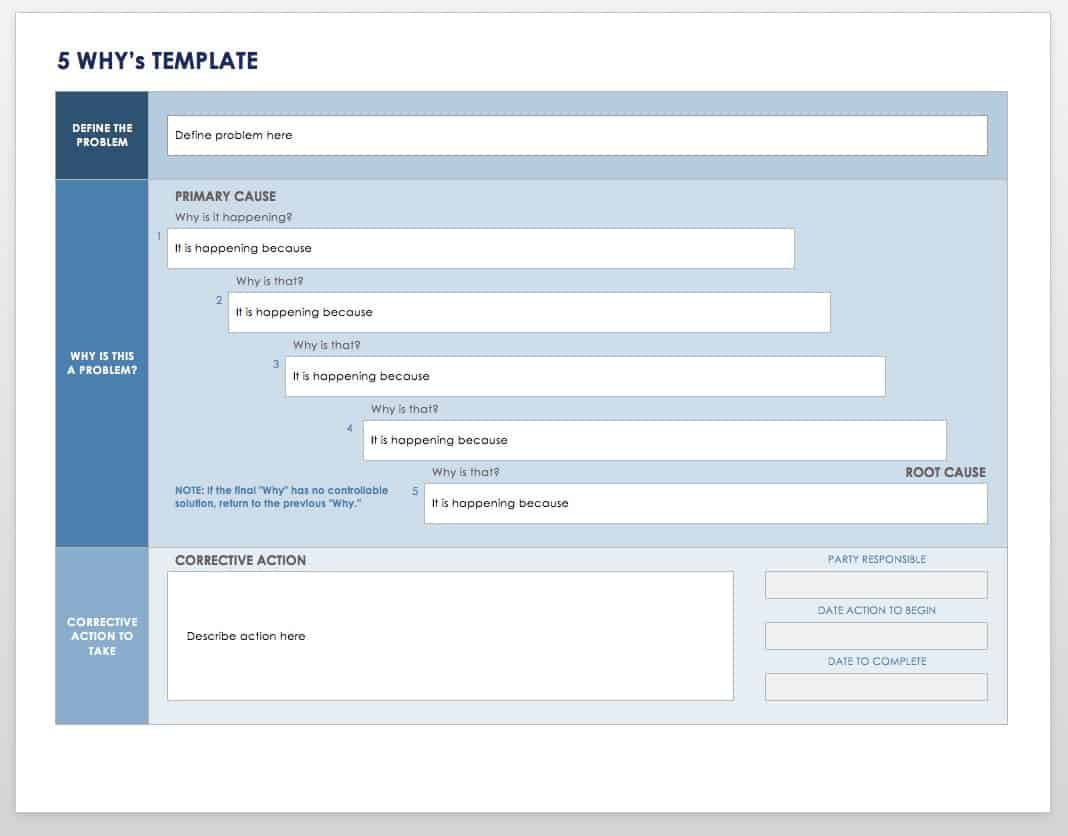
5 Whys Template
A 5 Whys worksheet can help you undertake a root cause analysis to determine the sources of defects or performance issues. After defining the problem, you ask five questions to drill down into why the problem is happening, and track the issue back to its root cause. The final step is to determine what action you should take to eliminate that root cause.
Download 5 Whys Template
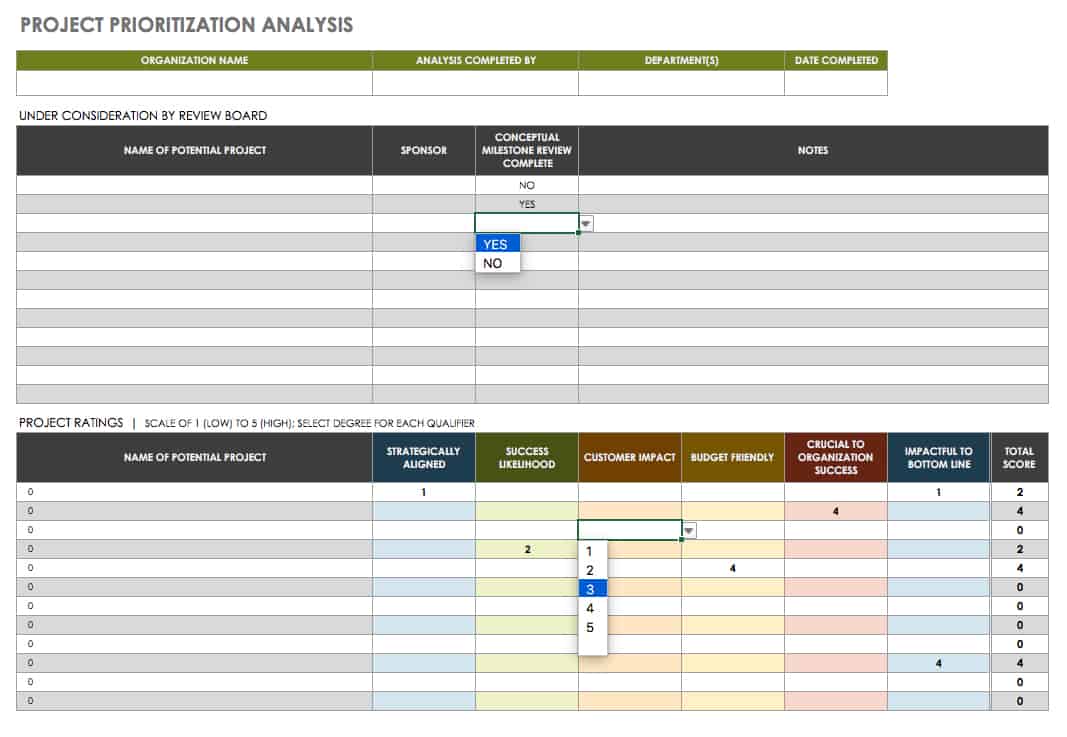
Project Prioritization Analysis
This template can help you prioritize and select projects based on various factors, such as likeliness to succeed, cost, and how critical a project is to business processes. Once you collect your data, you can also use a Pareto chart to get a visual representation of the results. This Six Sigma project template is a simple tool that can have a big impact on decision making.
Download Project Prioritization Analysis - Excel
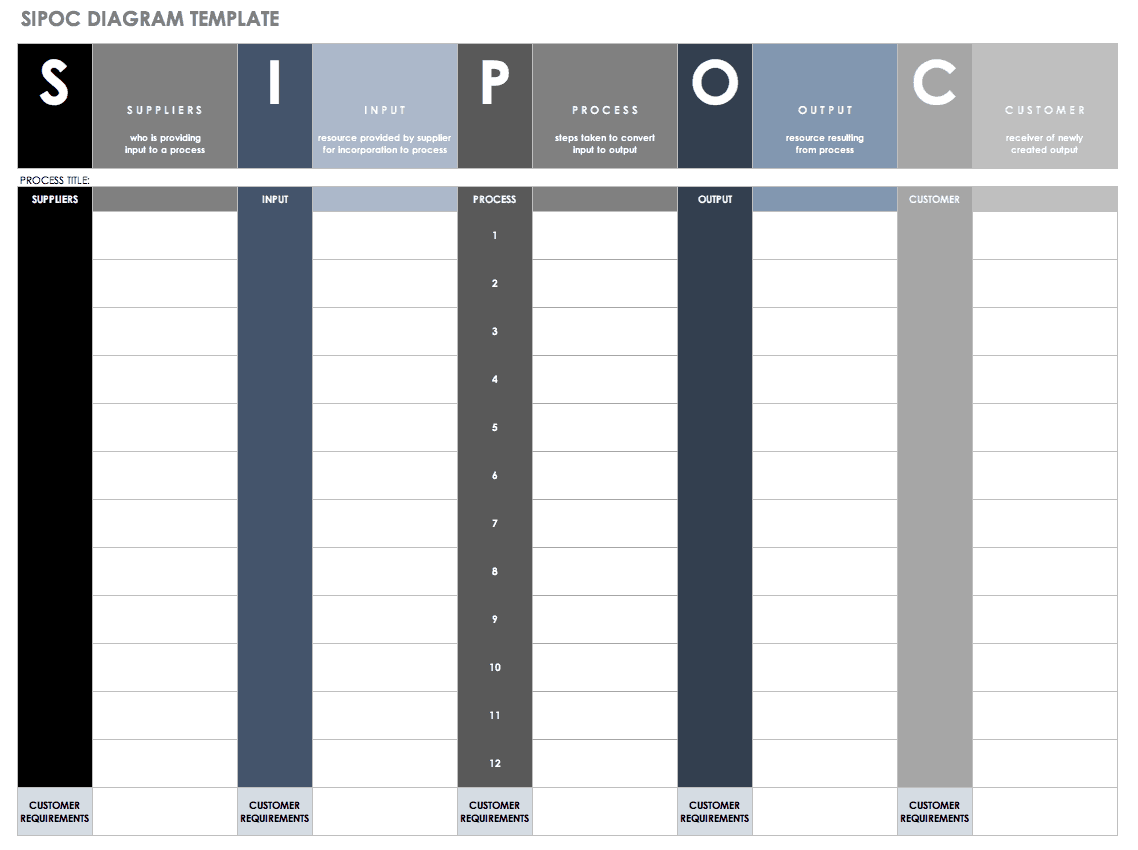
SIPOC Diagram Template
SIPOC stands for Suppliers, Inputs, Process, Outputs, and Customers. A SIPOC diagram provides a high-level, visual overview of a business process, which is helpful for identifying and summarizing all of the elements in a process improvement project from start to finish. This Excel template provides five columns to create a simple, easy-to-read diagram.
Communication Plan Template
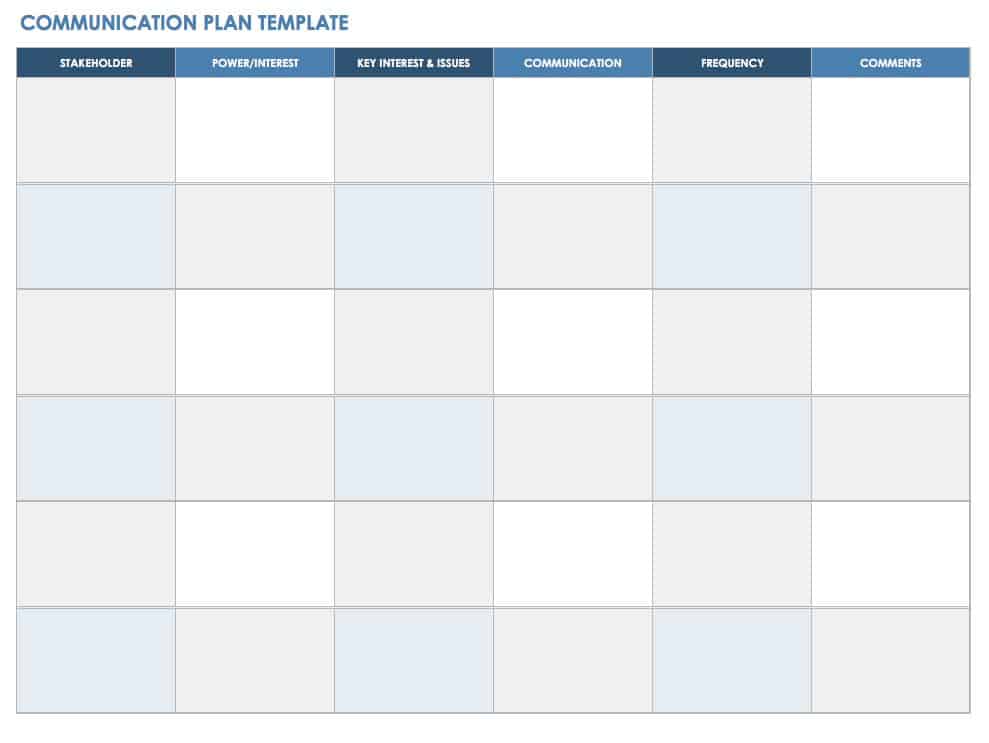
A communication plan outlines how and when you will communicate a project to stakeholders. Effective messaging is important for securing buy-in as well as ensuring continued support for the duration of a project. Consistent reporting on project progress and milestones can help keep stakeholders informed and engaged.
Download Communication Plan Template
Voice of Customer (VOC) Six Sigma Template
Use this VOC template to gather information about customer expectations and needs. Gaining insight into customer requirements can inform your improvement process and help ensure a successful end product. This template is designed to help you document the voice of the customer and translate those messages into measurable requirements.
Data Collection Plan Template
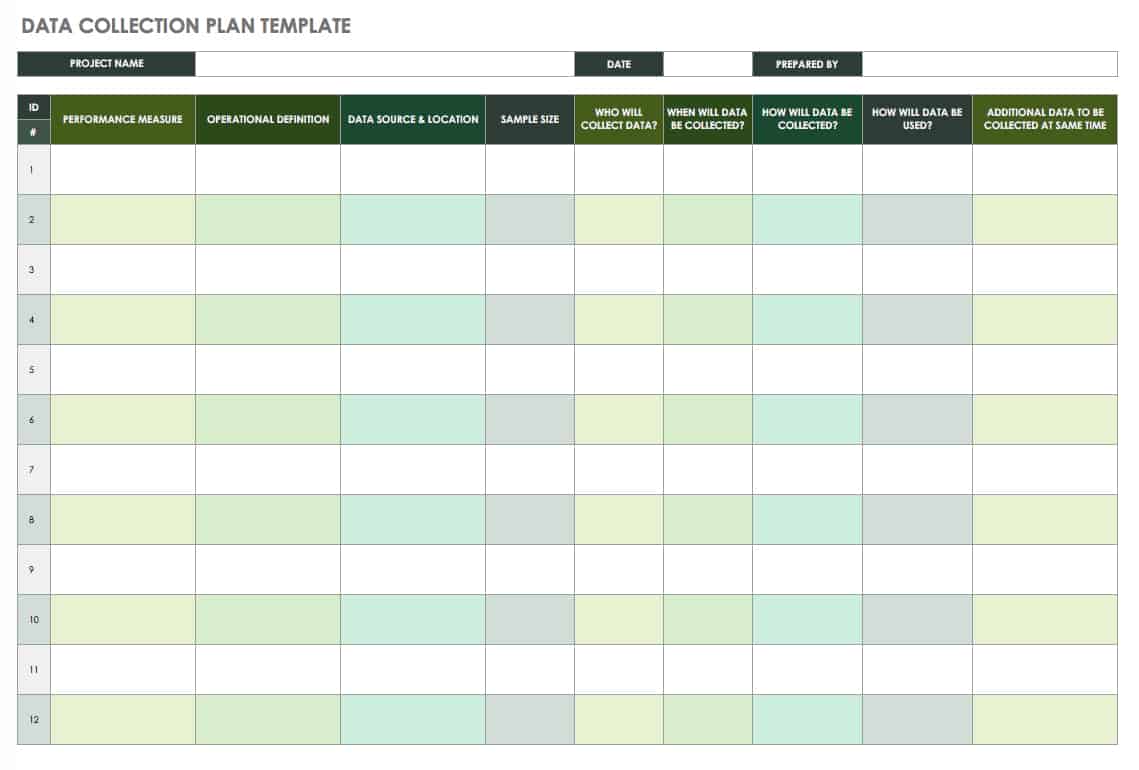
During the “measure” phase of DMAIC, you can use a data collection plan template as a framework for describing what type of data to collect, how to gather it, when, and by whom. This spreadsheet template provides columns for entering data sources and locations, operational definitions, what statistical tools to use, and more. You can also edit the template to include any additional information that is relevant for your project.
Download Data Collection Plan Template - Excel
FMEA Template
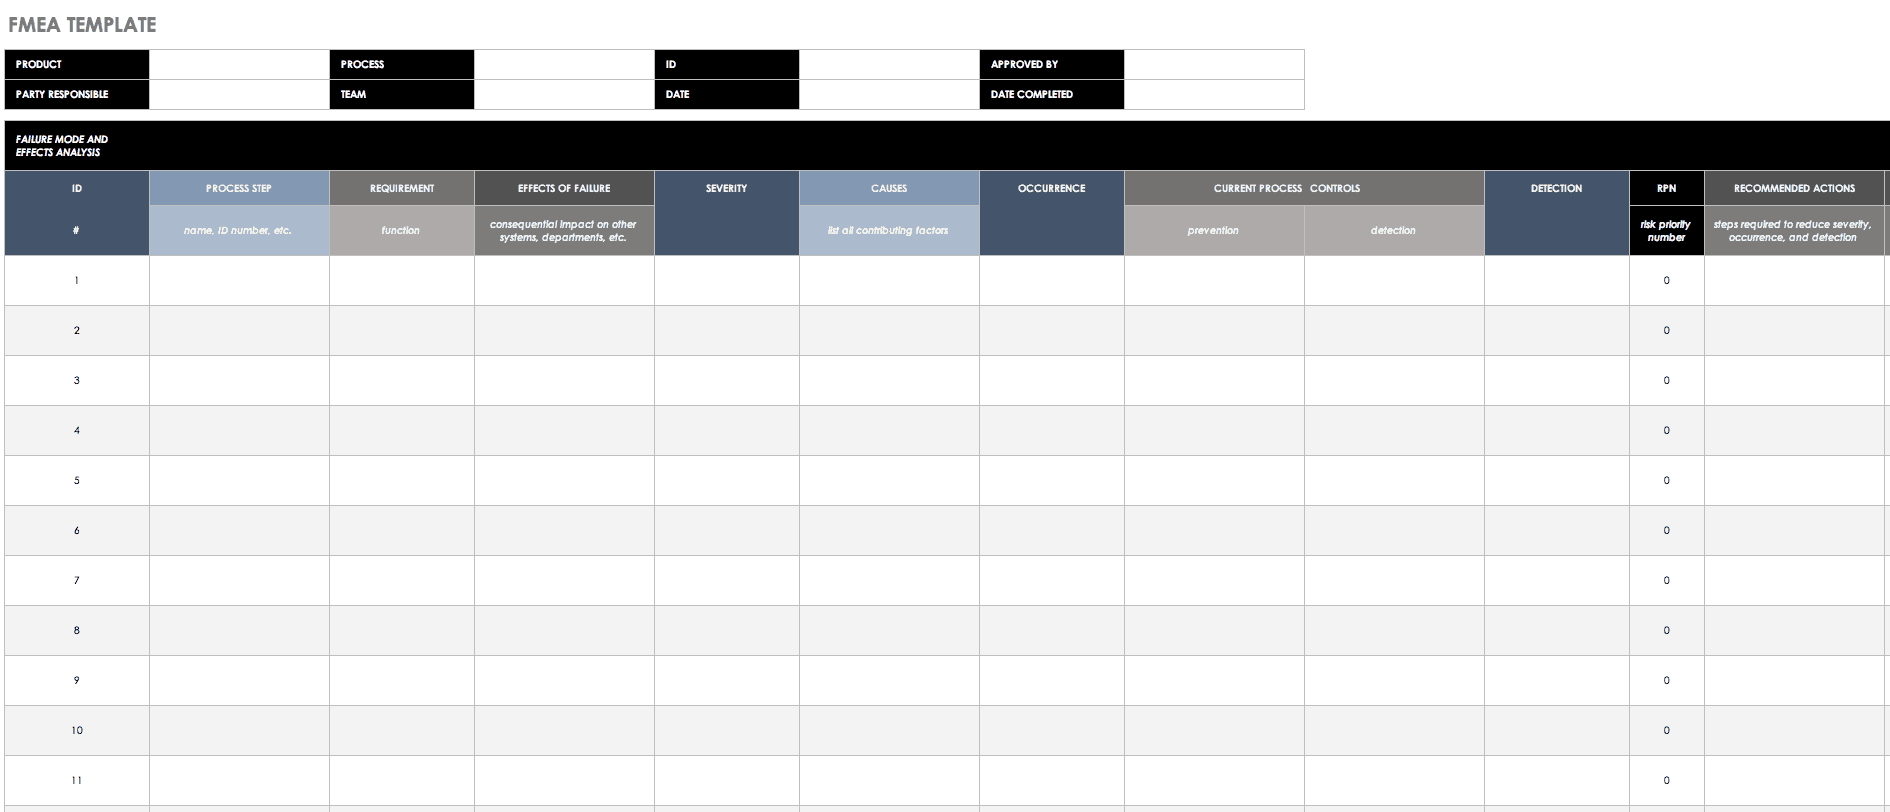
A Failure Modes and Effects Analysis (FMEA) seeks to prevent possible failures in a design or process. This FMEA template is designed to help you follow a systematic approach to identifying, understanding, and preventing failures. The template includes a section for recording what actions were taken to address each issue, as well as the completion date.
Control Plan Template
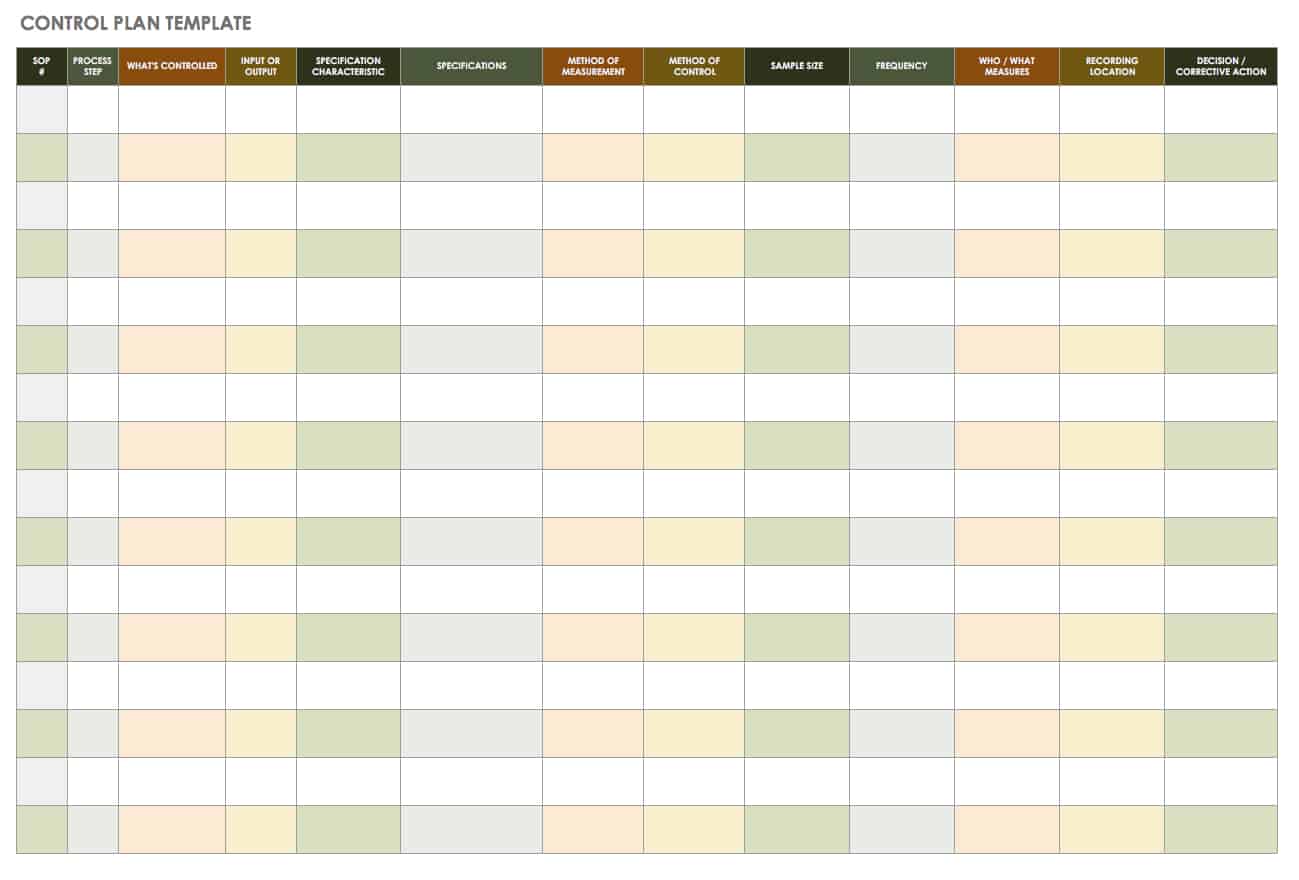
During the “control” phase, an effective plan serves as a guide for monitoring process and sustaining improvements. In this simple spreadsheet template, you can document process control activities to help ensure that quality standards continue to be met. Customize the template as needed to create a control plan for your specific project.
Download Control Plan Template - Excel
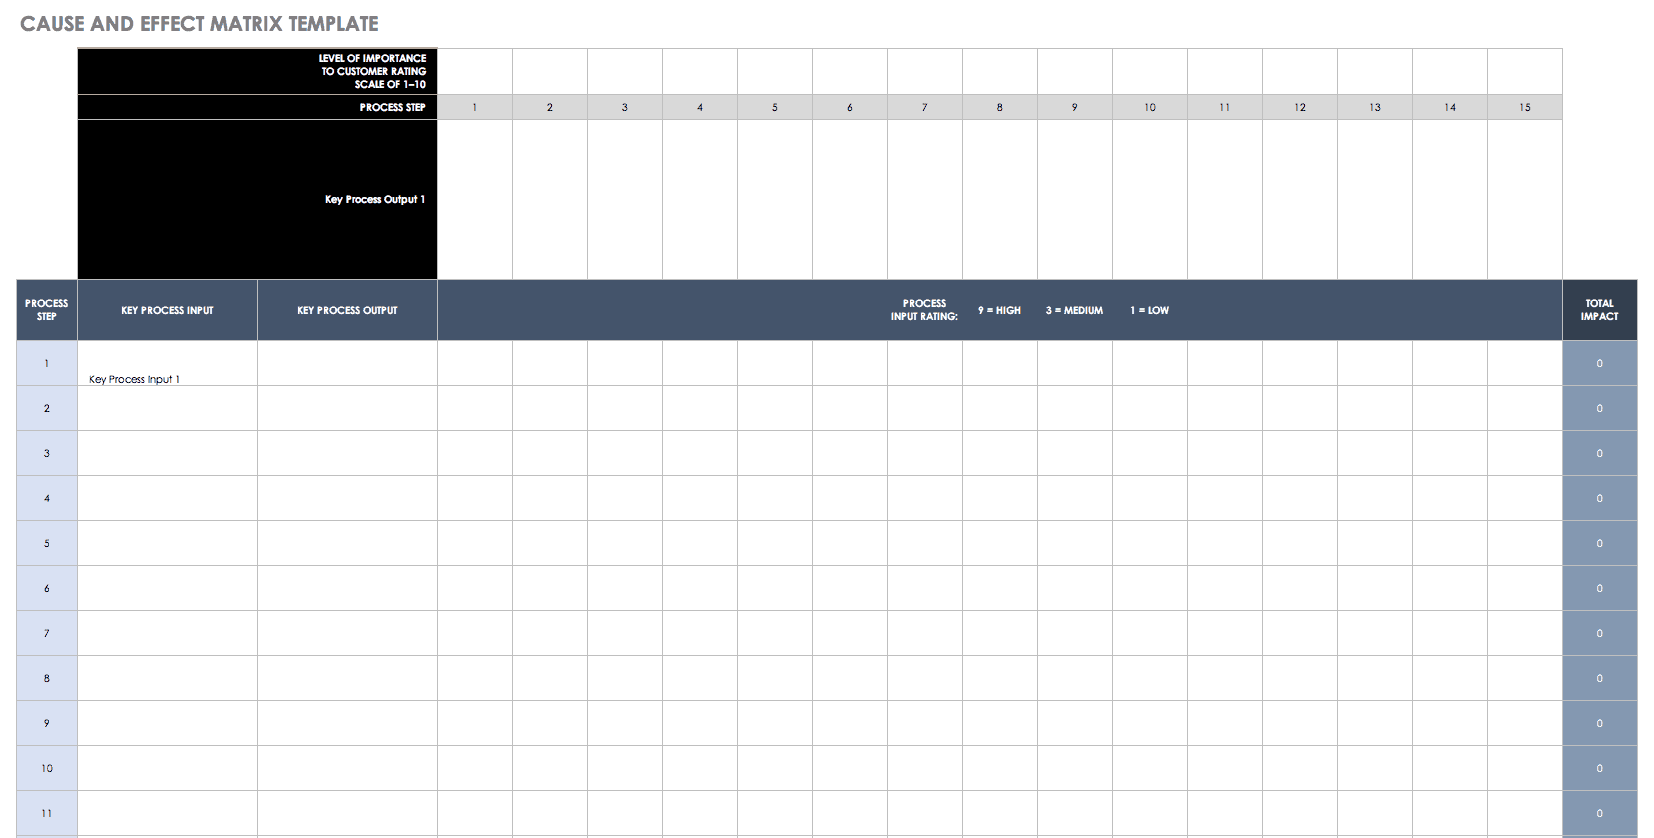
Cause and Effect Matrix
A cause and effect matrix allows you to evaluate and quantify the relationships between process inputs and outputs. Use the matrix to prioritize process inputs based on the level of impact each one has on outputs. Once you collect your data in the matrix, you can also represent the results in a Pareto chart.
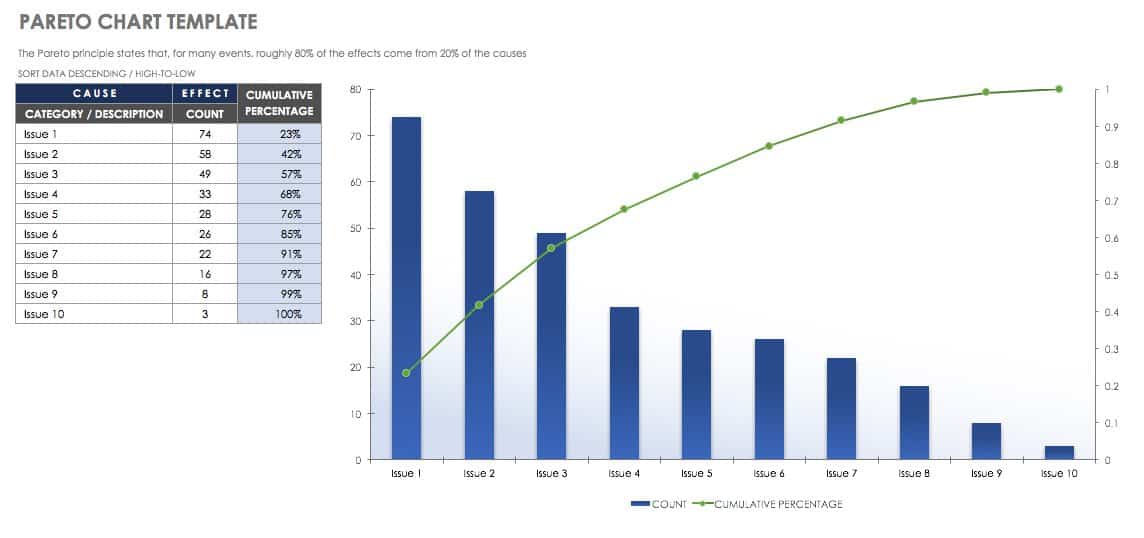
Pareto Chart Template
Use this template to perform a Pareto analysis of your data to determine the frequency of problems or defects occurring in a process. The template provides a typical Pareto diagram, with a bar chart representing whatever issues you want to analyze, and a line graph showing the cumulative percentage of occurrences.
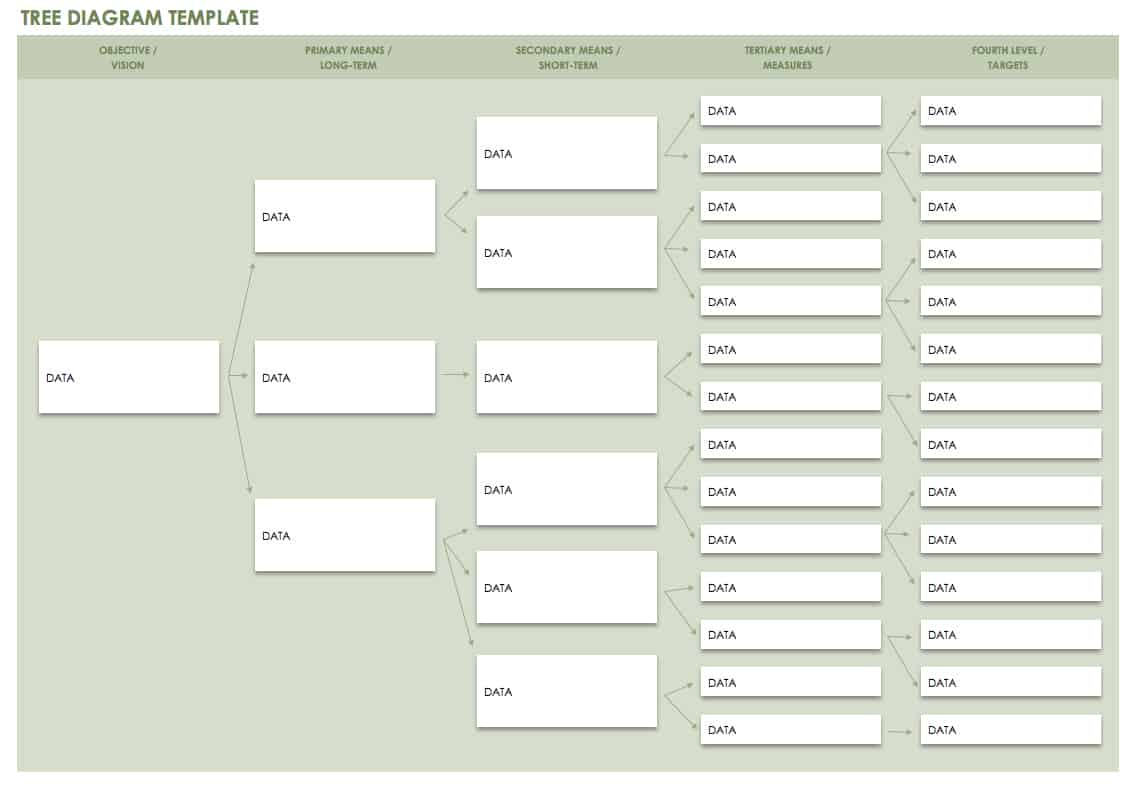
Tree Diagram Template
A tree diagram breaks down a central concept, issue, or activity into increasingly smaller components. In Six Sigma, tree diagrams are used for determining root causes, brainstorming ideas related to a central topic, understanding a process from top to bottom, and approaching issues systematically. This is a useful tool for teams at many levels.
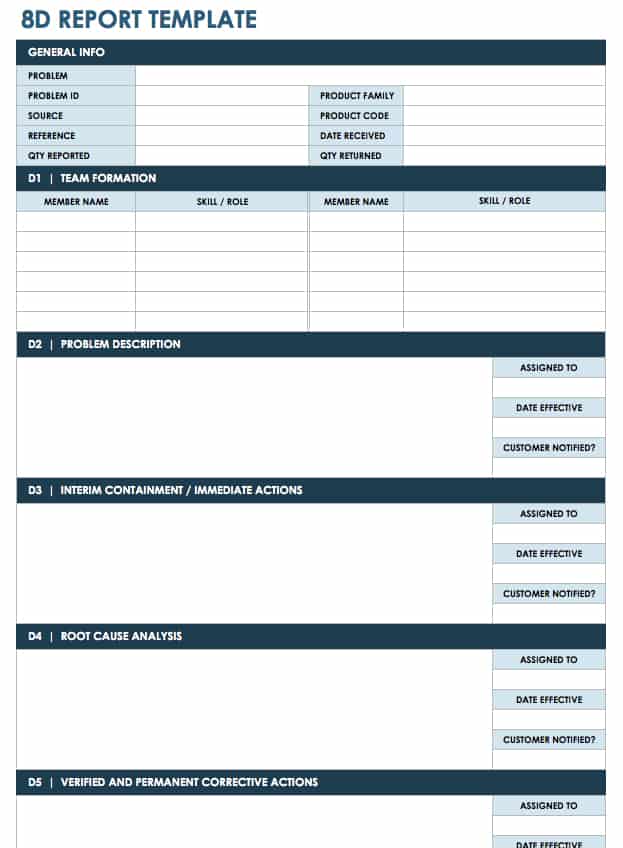
8D Report Template
This template guides you through the 8D (eight disciplines) approach to problem solving and process improvement. The 8D report includes separate sections for each step, from describing the problem and root causes to identifying corrective actions and ways to prevent reoccurrence. This is a systematic way to help organizations attain their Lean Six Sigma goals.
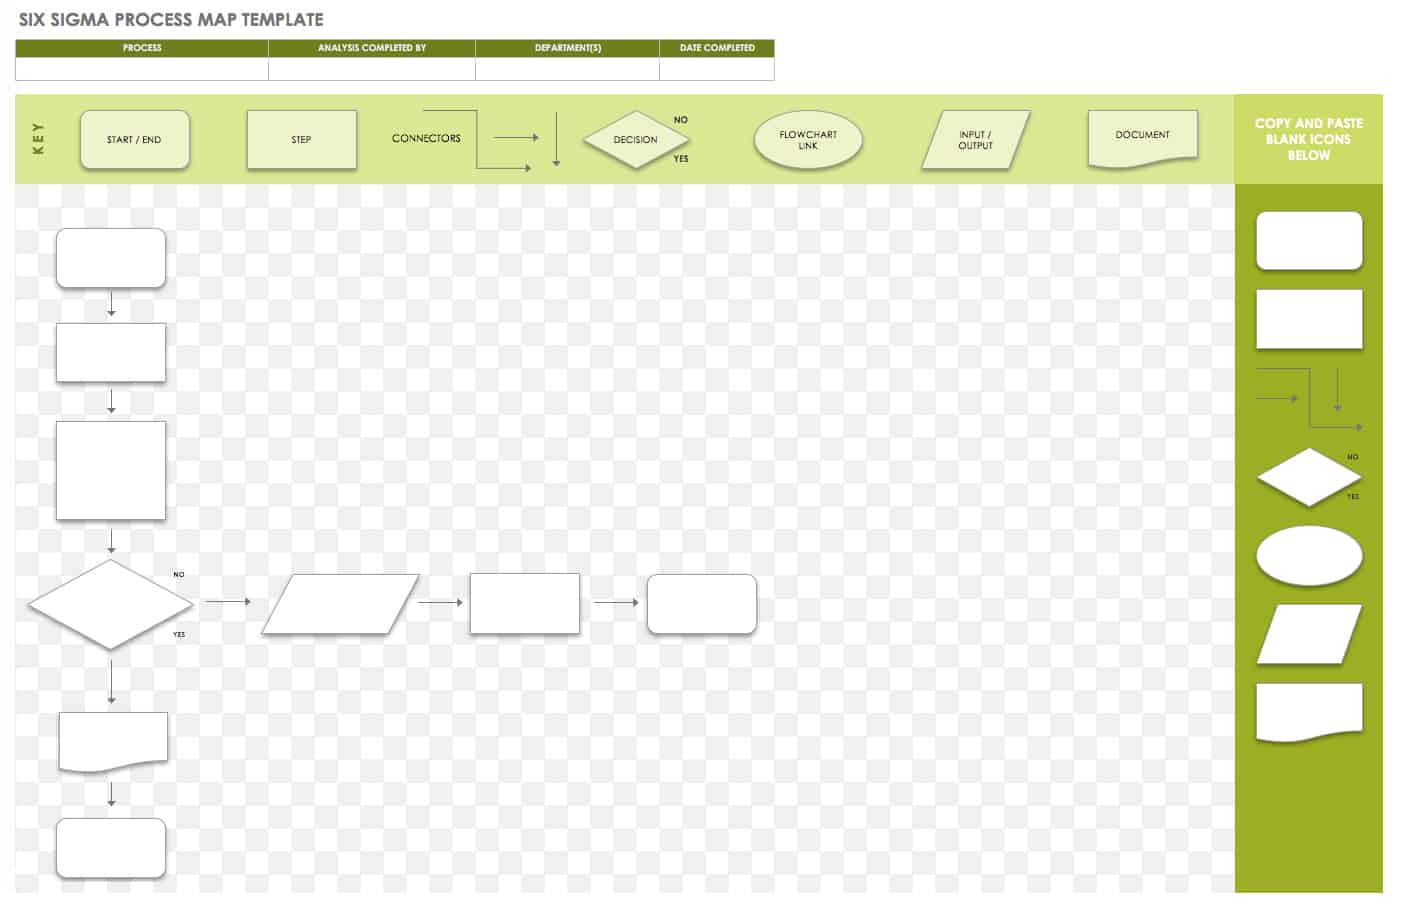
Six Sigma Process Map Template
Create a process flow diagram using flowchart symbols to show each step in a Six Sigma process. This provides a visual representation of process flow with a map that is easy to understand and modify. As a Six SIgma tool, you can use this template for analyzing and revising a process, and as a communication tool for stakeholders.
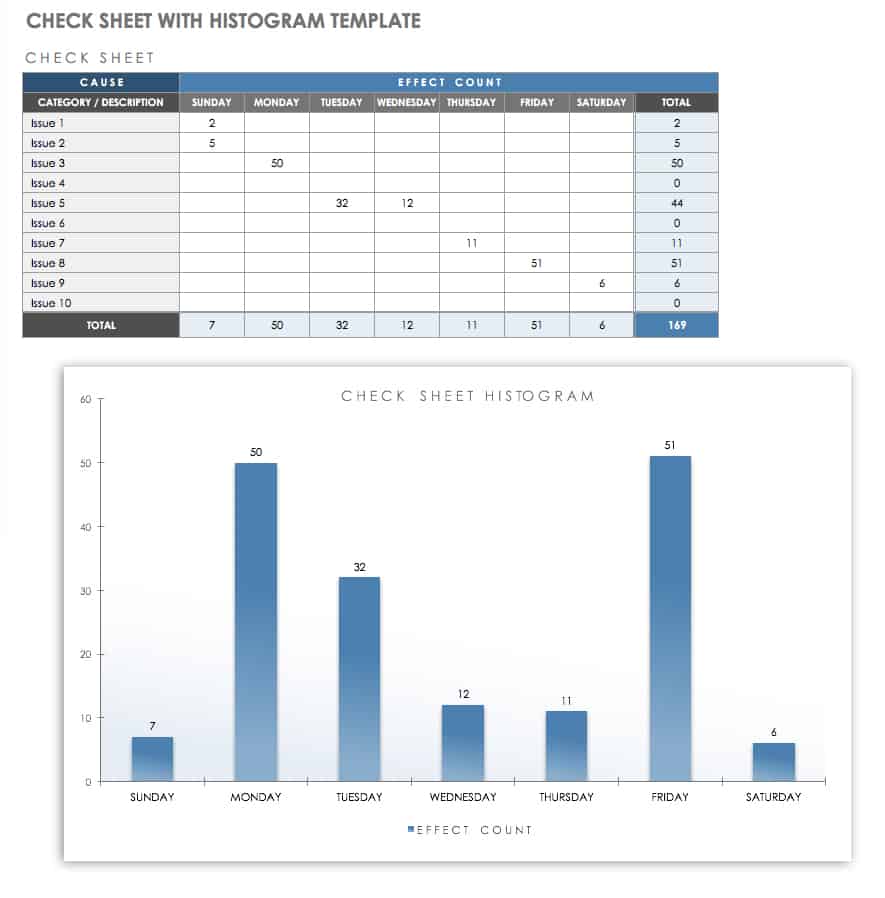
Check Sheet with Histogram Template
This template combines a weekly check sheet with a histogram for a graphical representation of defects or issues occurring over time. Enter your data on the check sheet, and the template will automatically create the histogram for your analysis. You can also print the check sheet to collect data by hand.
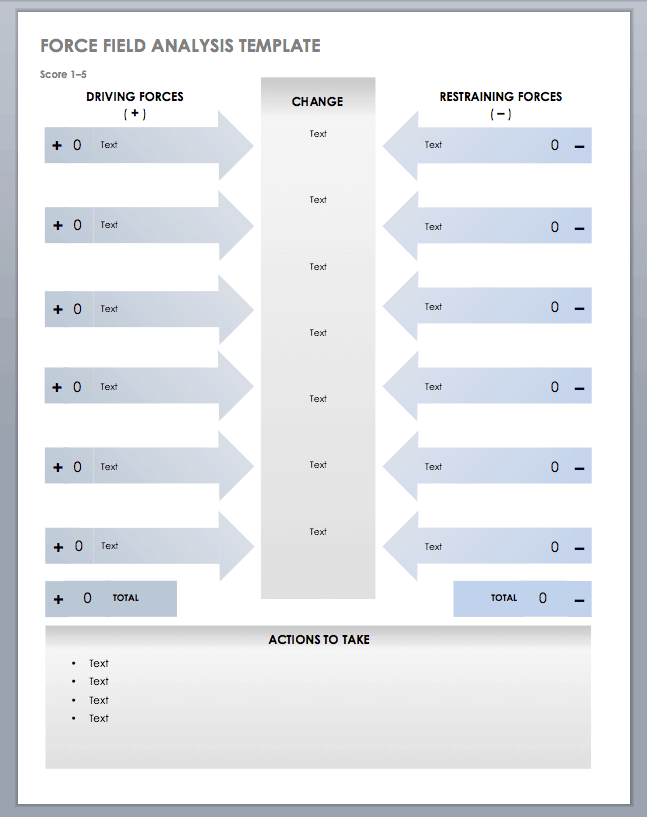
Force Field Analysis Template
A force field analysis helps determine what factors are driving or inhibiting efforts to reach a goal. Identifying these forces and rating the strength of each can provide insight on how to maximize the driving forces and reduce inhibiting forces. On the template, list the desired change along with acting forces, then use your analysis to create an action plan.
Download Force Field Analysis Template
How Lean and Six Sigma Work Together
While both Lean and Six Sigma aim to reduce waste, they are distinct methodologies. Six Sigma focuses on reducing defects by limiting variation within a process, while Lean removes unnecessary steps for a more efficient process. Combining these two methodologies can improve business performance by emphasizing both quality improvement and profitability. Learn more about Lean Six Sigma by reading Everything You Need to Know About Lean Six Sigma.
The acronym “DMAIC” represents a key aspect of Lean Six Sigma. DMAIC stands for the five phases of an improvement cycle: Define, Measure, Analyze, Improve, Control. You can use these steps as a roadmap for resolving issues with a Six Sigma approach:
- Define the project goals or problem to be addressed, internal and external customer requirements, and project boundaries.
- Measure the current performance of the process and describe the process in quantifiable terms.
- Analyze the process and identify the root causes of defects and sources of variation.
- Improve performance by resolving the root causes of issues and eliminating defects.
- Control future process performance by maintaining improvements.
Another version of this process is DMADV (Define, Measure, Analyze, Design, and Verify). The DMADV framework is typically applied to new products or services, rather than improving an existing process, or when an existing process has been improved but is not meeting a Six Sigma level. The process is similar to DMAIC but focuses on product or process design and how to implement that design effectively.
