What Is a Customer Relationship Management (CRM) Dashboard?
Companies use CRM dashboards to monitor sales, overall business opportunities, processes, and performance. They are relevant to businesses of any size or type, from the smallest start-up to an international enterprise. The visual representations of CRM dashboards enable viewers to quickly and easily get a snapshot of the KPIs and data that drive success (or lack of it). You can also use a the metrics surfaced in a dashboard to perform a deep dive investigation of the underlying processes and/or problems. Often set to provide information in real time, CRM dashboards offer business intelligence to help professionals measure, analyze, and act on meaningful, actionable data.
To Keserwani, it’s all about the relationships that increase sales: “The greatest benefit of CRM dashboards is that they help identify exactly where and how opportunities are being lost,” he says.
See how Smartsheet can help you be more effective
Watch the demo to see how you can more effectively manage your team, projects, and processes with real-time work management in Smartsheet.
CRM Dashboard Adoption Considerations
The very ability of CRM dashboards to easily identify what’s going wrong and who’s responsible may be one of the greatest barriers to adoption. While every organization wants to understand its customers, how its actions affect customers and profits, and the quality of customer experience it’s providing, there can be some resistance to dashboards.
There are two main obstacles to dashboard adoption: First, the power of the dashboard to obtain hard facts in real time regarding finance, sales, customer service, or marketing can make executives and their team members feel threatened. With data so readily available, changes come swiftly, and, as a result, team members become guarded. Second, using budget, personnel, and time to set up dashboards and train people can seem like an unattractive, commitment-laded prospect.
However, these impediments may be a thing of the past. In an increasingly competitive business world, putting an emphasis on customer-focused metrics simply pays off in the long term. In fact, with new tools and apps, it doesn’t need to take more than a few days (or, in some cases, hours) to set up CRM dashboards of all types.
The Benefits of Dashboards to You and Your Customers
Keserwani says that the primary purpose of a CRM dashboard is clear: “CRM Dashboards today are action enablers. An informative dashboard is a thing of the past. Organizations are demanding CRM dashboards that help them quickly decide what actions to take. If the dashboard tells me that my lead conversion ratio is falling because the customer satisfaction score is going down, I can quickly act to improve the score and eventually see improved sales.”
From his experience in the finance sector, Keserwani highlights other benefits of CRM dashboards that also apply to any organization:
- Dashboards Are Crucial to Effective Decision Making: Keserwani says that dashboards can answer key questions about why and how sales are lagging:
- Why aren’t the leads converting into sales?
- Which geographical area/customer segment/sales team represents the least growth in sales and, hence, demands more investigation?
- Which services have seen the most service-level agreement (SLA) breaches and why? Are we losing potential business because of them?
- Manage Interactions with Past, Present, and Future Customers: CRM dashboards tie customer satisfaction to sales KPIs by monitoring turnaround time (TAT) and SLA adherence. Essentially, CRM information highlights where and how you are delivering value, which offers are working and with whom, and overall operational threats.
- Spot Trends: Visualization using graphs and charts based on past and present data instantly shows the direction of business activity, customer relationships, and sales.
- Increase Efficiency: CRM dashboards keep tabs on whether you are maintaining focus on the target areas.
- Control Costs: By reducing manual inputs or separate reporting, the company can concentrate its efforts on the highest-need areas. It’s also easy to see where you’re spending (or potentially wasting) money.
- Support Collaboration: CRM dashboards enable the sales team to focus on closing sales rather than following up.
- Create Transparency: By providing almost instant visibility into business activities, dashboards leave no questions about where and how things are currently going and how you can improve them.
The net effect of CRM dashboards should be higher customer satisfaction and sales with less effort. To generate all these benefits, you need to take advantage of a CRM dashboard that’s well designed from the start.
CRM Dashboard Design Considerations and Features
Carefully weighing your CRM dashboard options in advance helps to ensure team member adoption. Whether you decide to use a free or purchased app, or design one yourself using Excel templates, your CRM dashboard should save you time, build relationships, and increase profits.
Keserwani offers three key tips for CRM design:
- Base the Design on a Causal Relationship Among KPIs: To take an example from the credit card industry, you should place issuance, activation, and transaction activity KPIs together because they have causal relationships to each other.
- Display the Five Most Important KPIs: Since a human mind cannot process more than seven ideas at a time, you should never flout this rule.
- Align the Dashboard With the Business Strategy: The best CRM dashboards are the ones that you can convert quickly in order to alter reporting in accordance with changing business strategy.
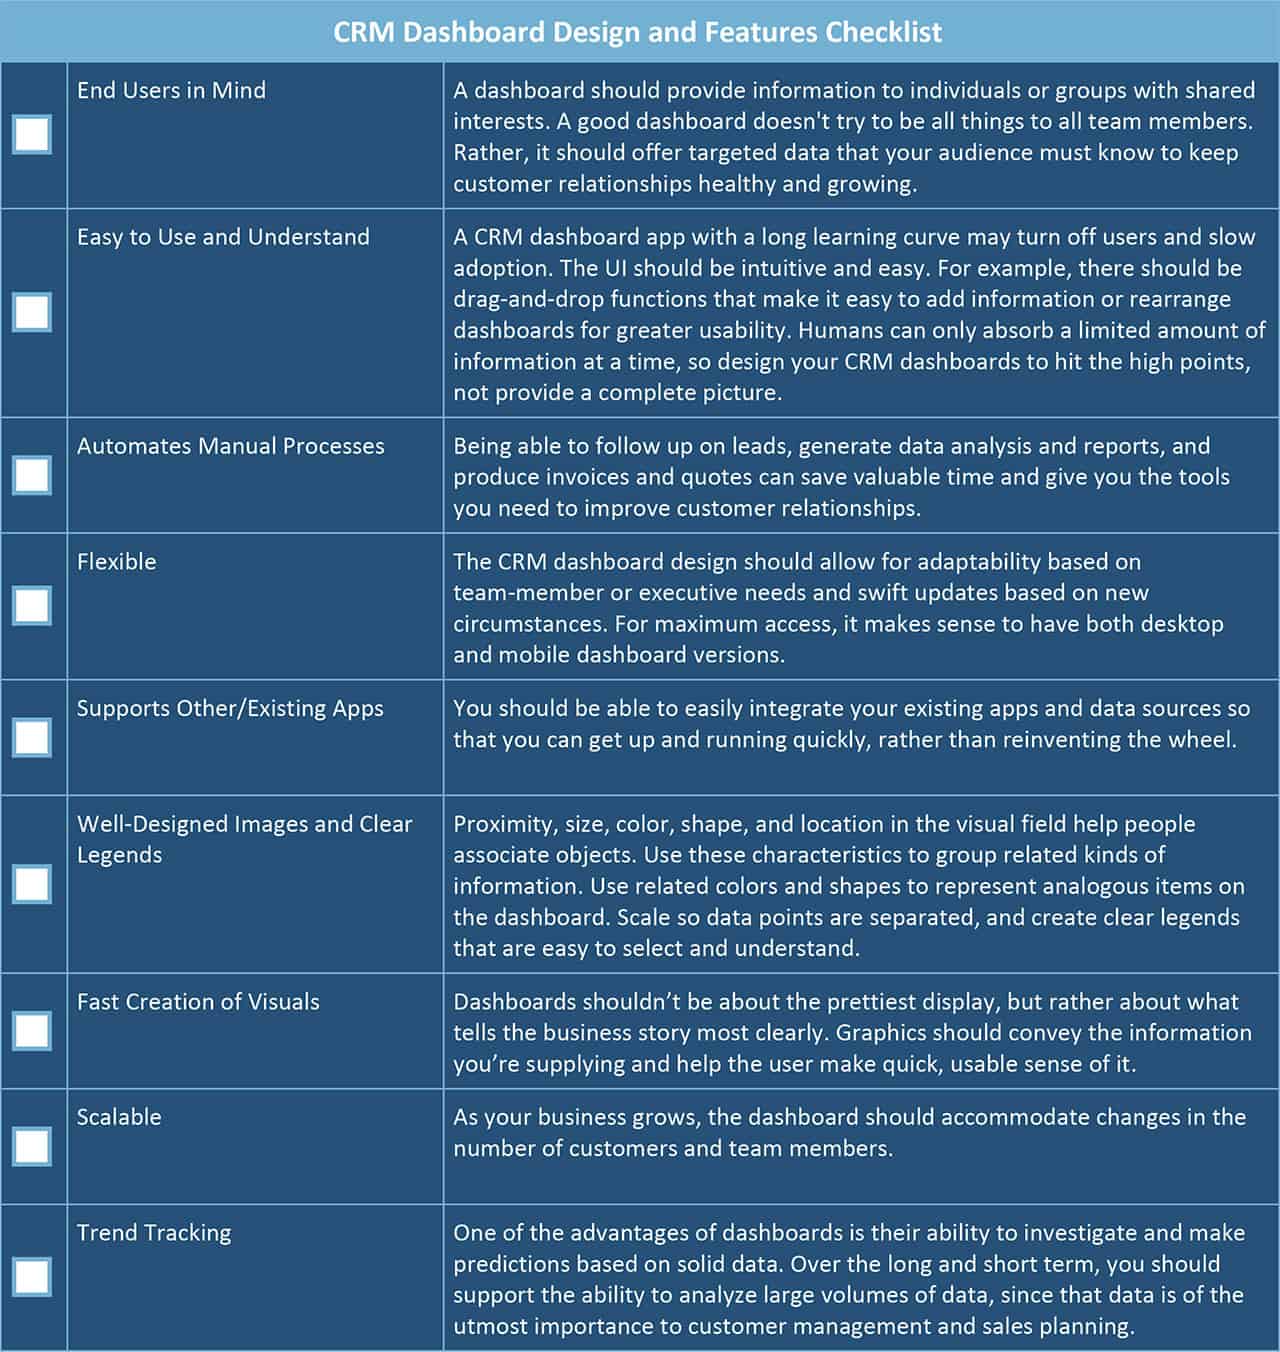
In the market for a CRM Dashboard? Here’s a checklist to guide the design or purchase of your CRM app:
Download CRM Dashboard Design and Features Checklist
Once you have adopted a purchased dashboard app, keep checking in with other users and keep testing. As you build up more data and get used to using a CRM dashboard, it may be tempting to add more KPIs and look in the rear view mirror. Nevertheless, try to keep historical data to a necessary minimum.
Examples of CRM Dashboard Types, Templates, and Metrics
Today, information is the lifeblood of business. But in order for you to make customer relationship data useful, you need to present it in a comprehensible and actionable way, and also consider scale and access. Before we get into specifics, however, here are some general categories of dashboards to consider:
- System and User Dashboards: An administrator usually creates system dashboards so that an entire organization can see them. They generally design user dashboards for a specific area such as sales, service, or marketing. As a rule, you share them only within the team.
- Dashboards for Small, Mid-Size, and Enterprise Businesses: Small businesses need dashboards as much as larger organizations do. Dashboards are a matter of scale, not necessarily content. You also need to think about the ability to scale up. The whole point of leveraging data is to grow your business to the next level.
Examples of CRM Dashboard Metrics/KPIs
What exactly should you measure to better manage your customer relationships? How often should you measure and analyze? How often should data update?
The perfect KPI is actionable, accessible, transparent, and easy to interpret. While every company has to contextualize those qualities to match their particular circumstances, here are some broad KPI ideas to get you started.
Sales and Marketing KPIs to Monitor with Your CRM Dashboard | |
|---|---|
Category | Metric Examples/What to Track in Your CRM |
Leads |
|
Sales Opportunities |
|
Sales and Account Team Activities |
|
Marketing Activities [Email and Social Media] |
|
Marketing Activities/Website [Google Analytics KPIs] |
|
CRM Dashboard Templates
You can opt to buy a CRM dashboard app, or create your own. Either way, you should be open to adapting based on needs, and the app should be easier for everyone to use. Below are some free, downloadable dashboard templates to get you started.
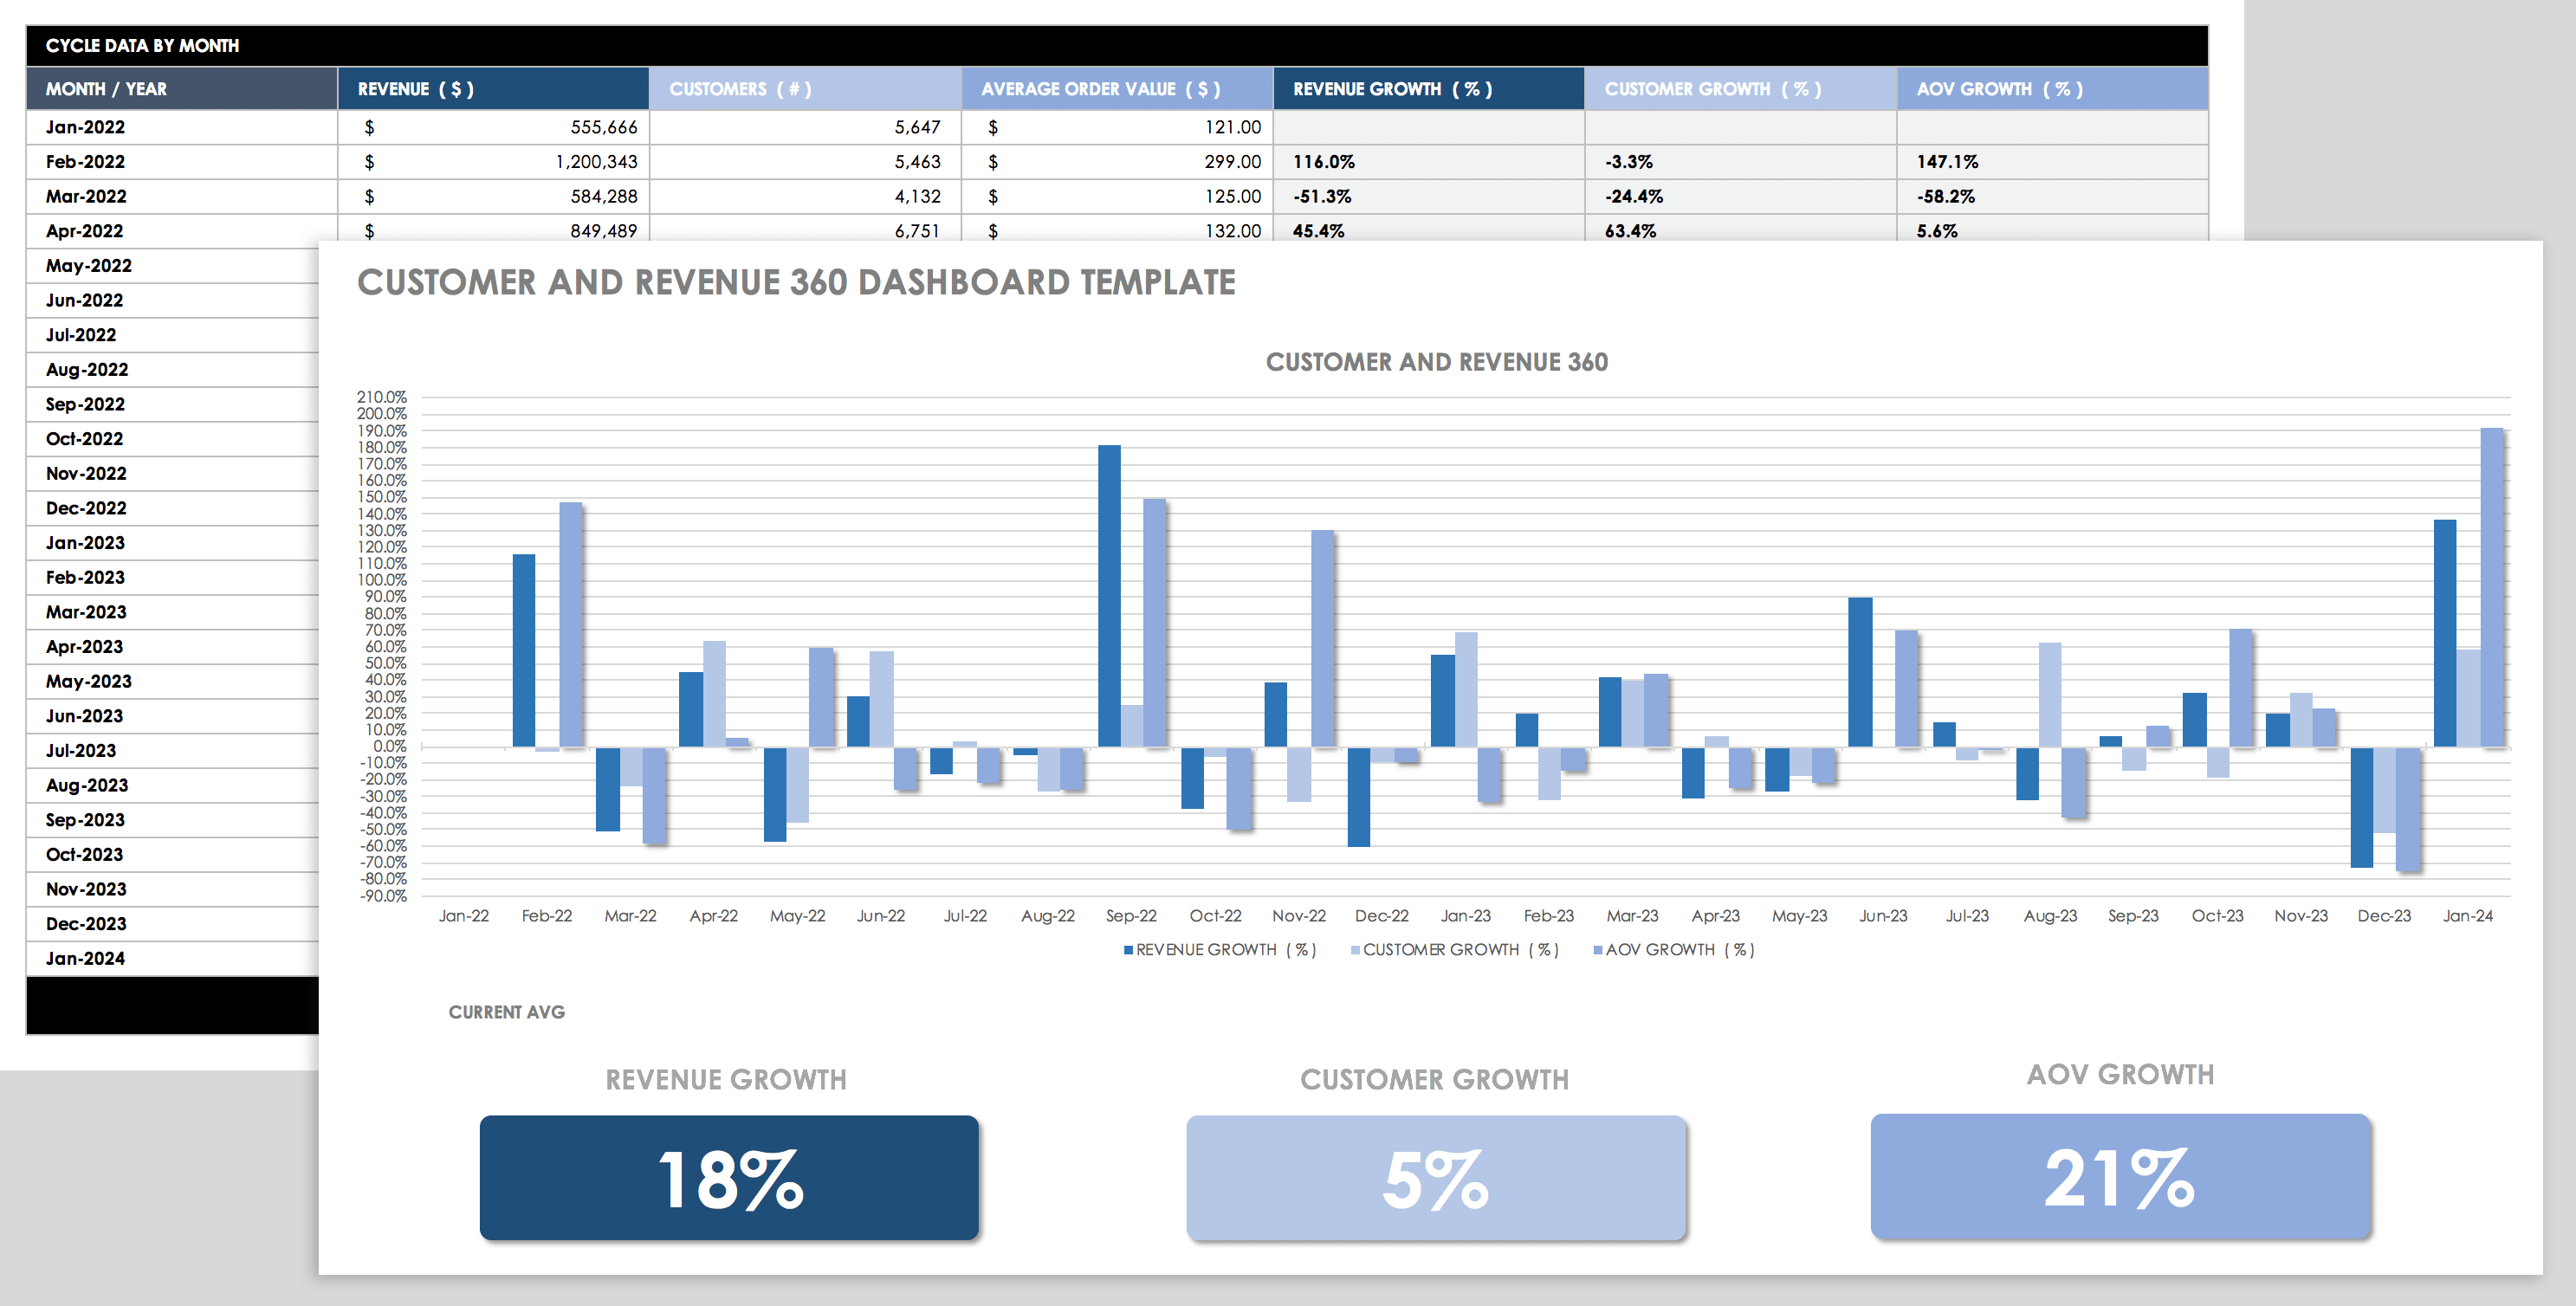
Customer 360° Dashboard Template - Excel
Use big data to accrue powerful insights into your brand, products, services, and, most importantly, buyers. Explore customer acquisition costs, revenue per customer, revenue vs. targets, and the total number of new customers in any time frame.
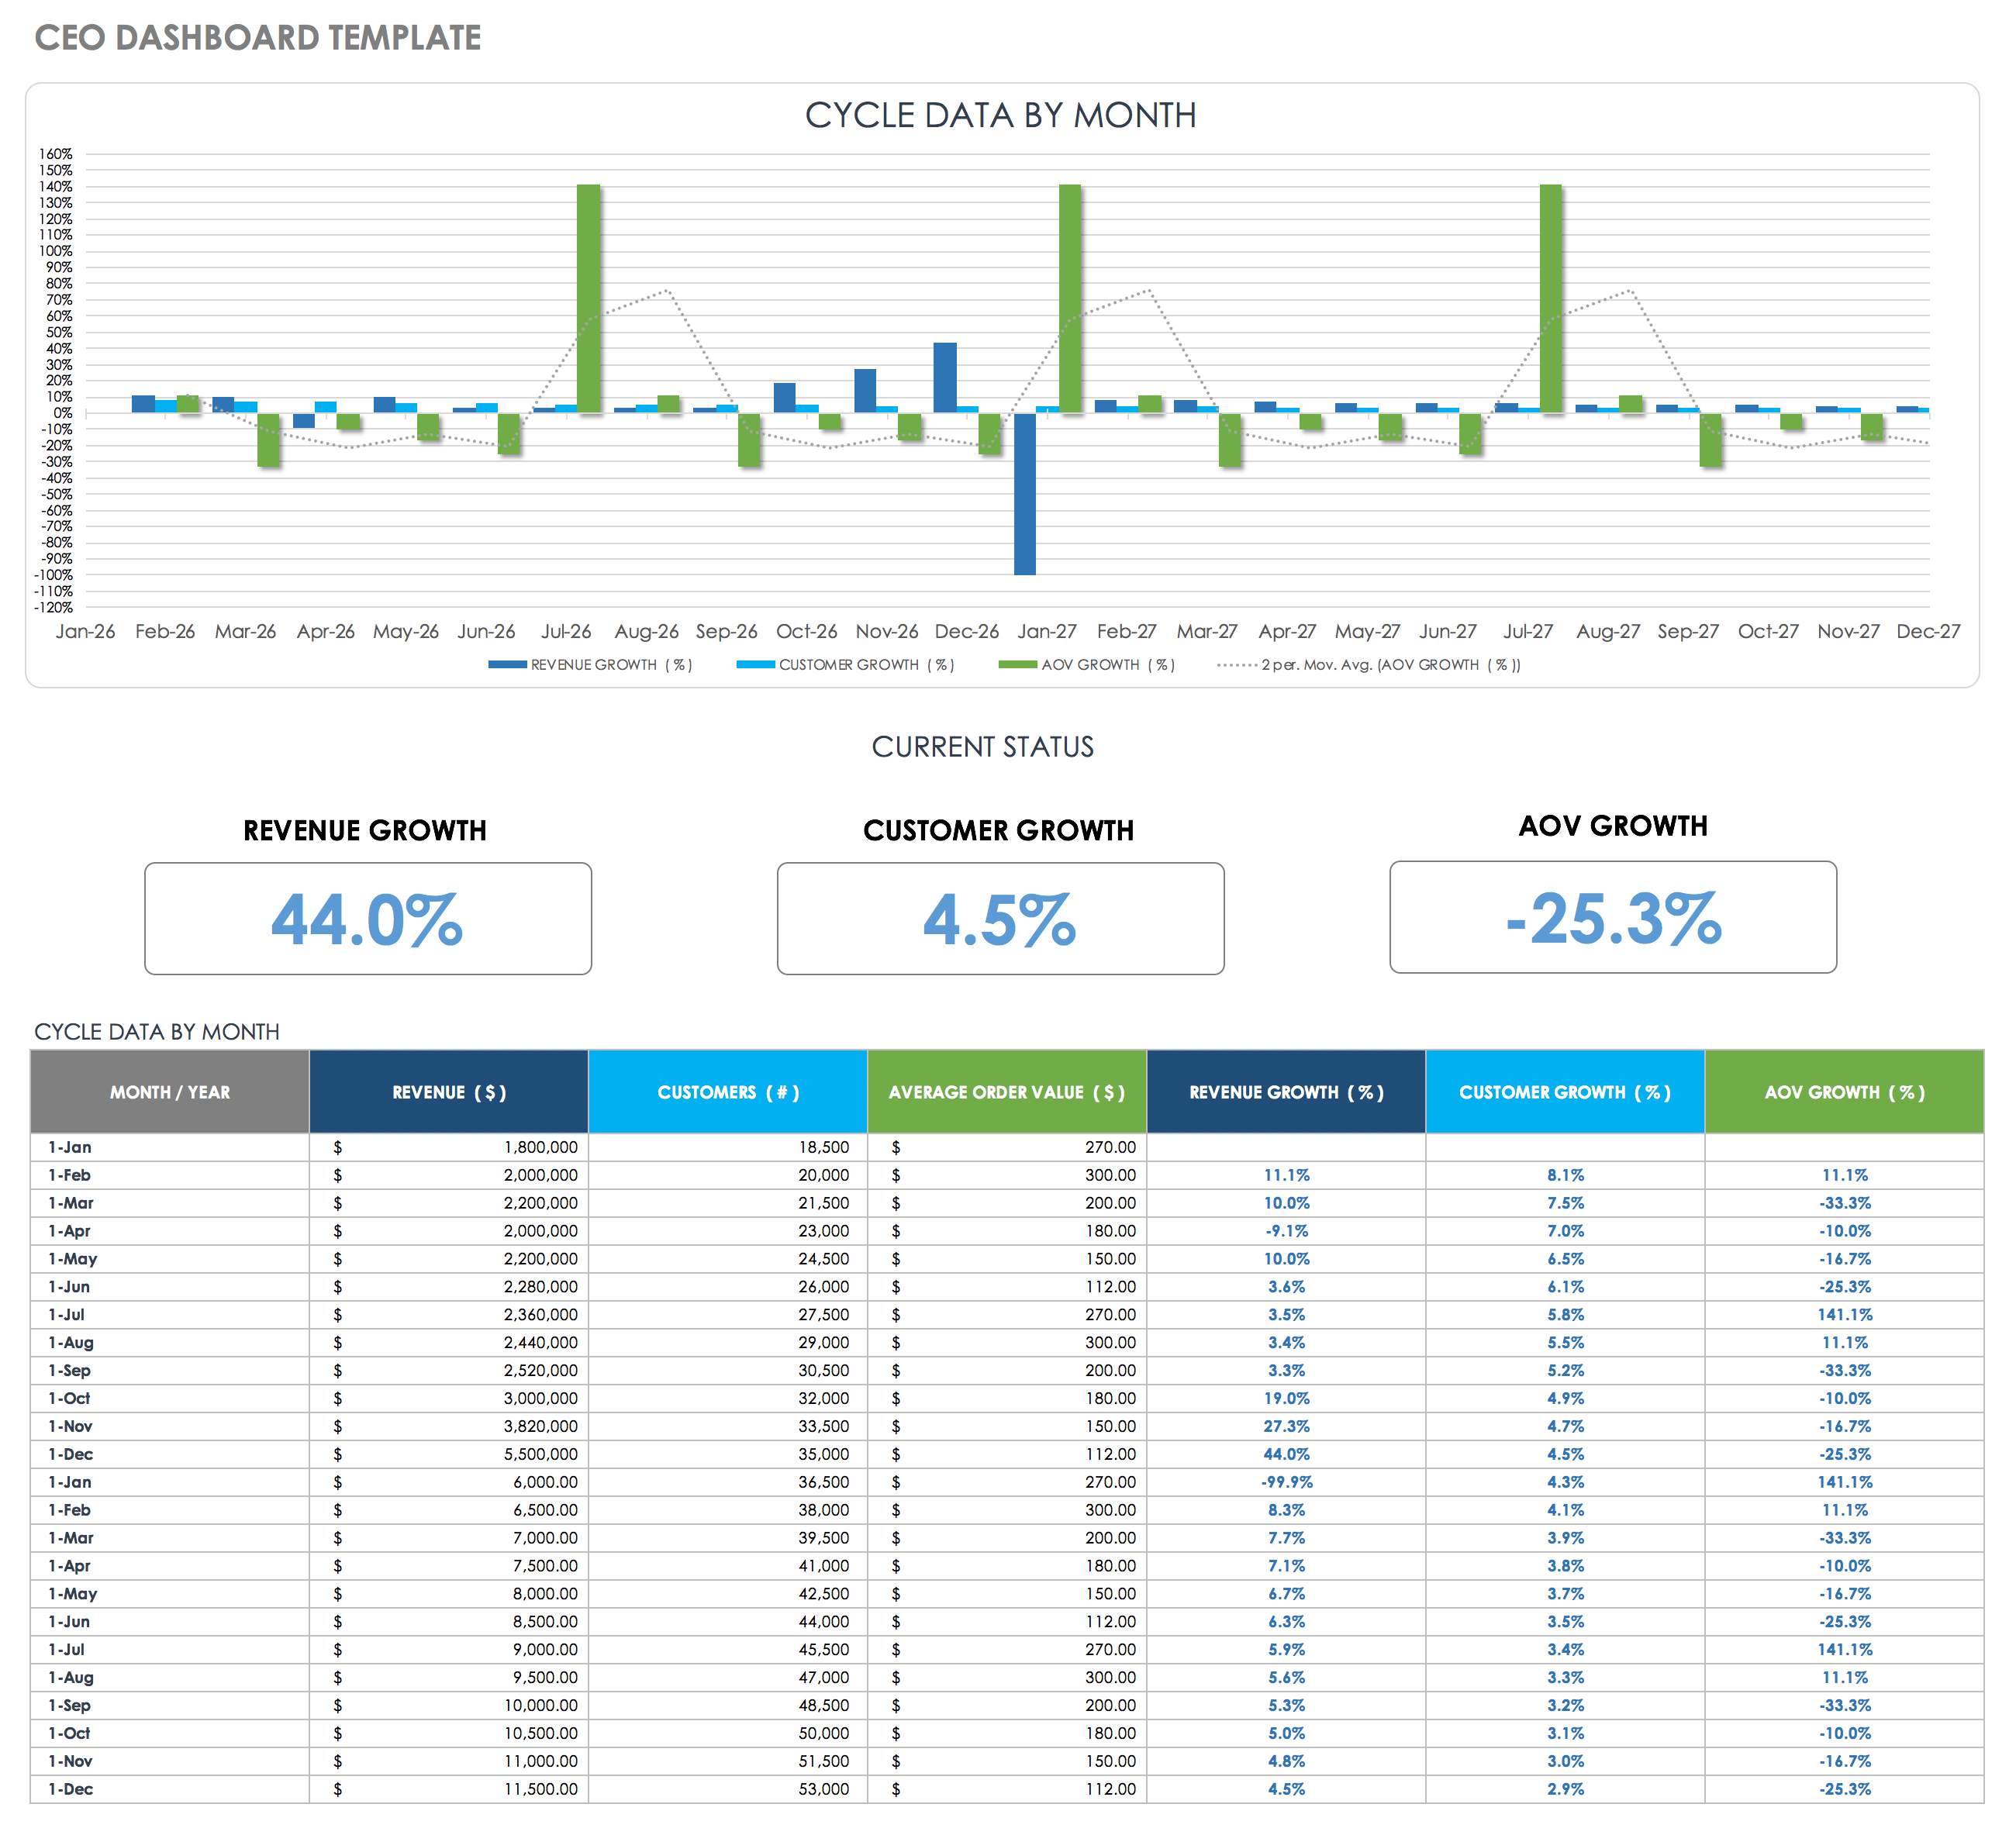
CEO Dashboard Template - Excel
A big-picture view of an organization is a necessity for CEOs. With this easy-to-read report that visualizes KPIs, you can see quantifiable success measurements. Learn all about executive dashboards here.
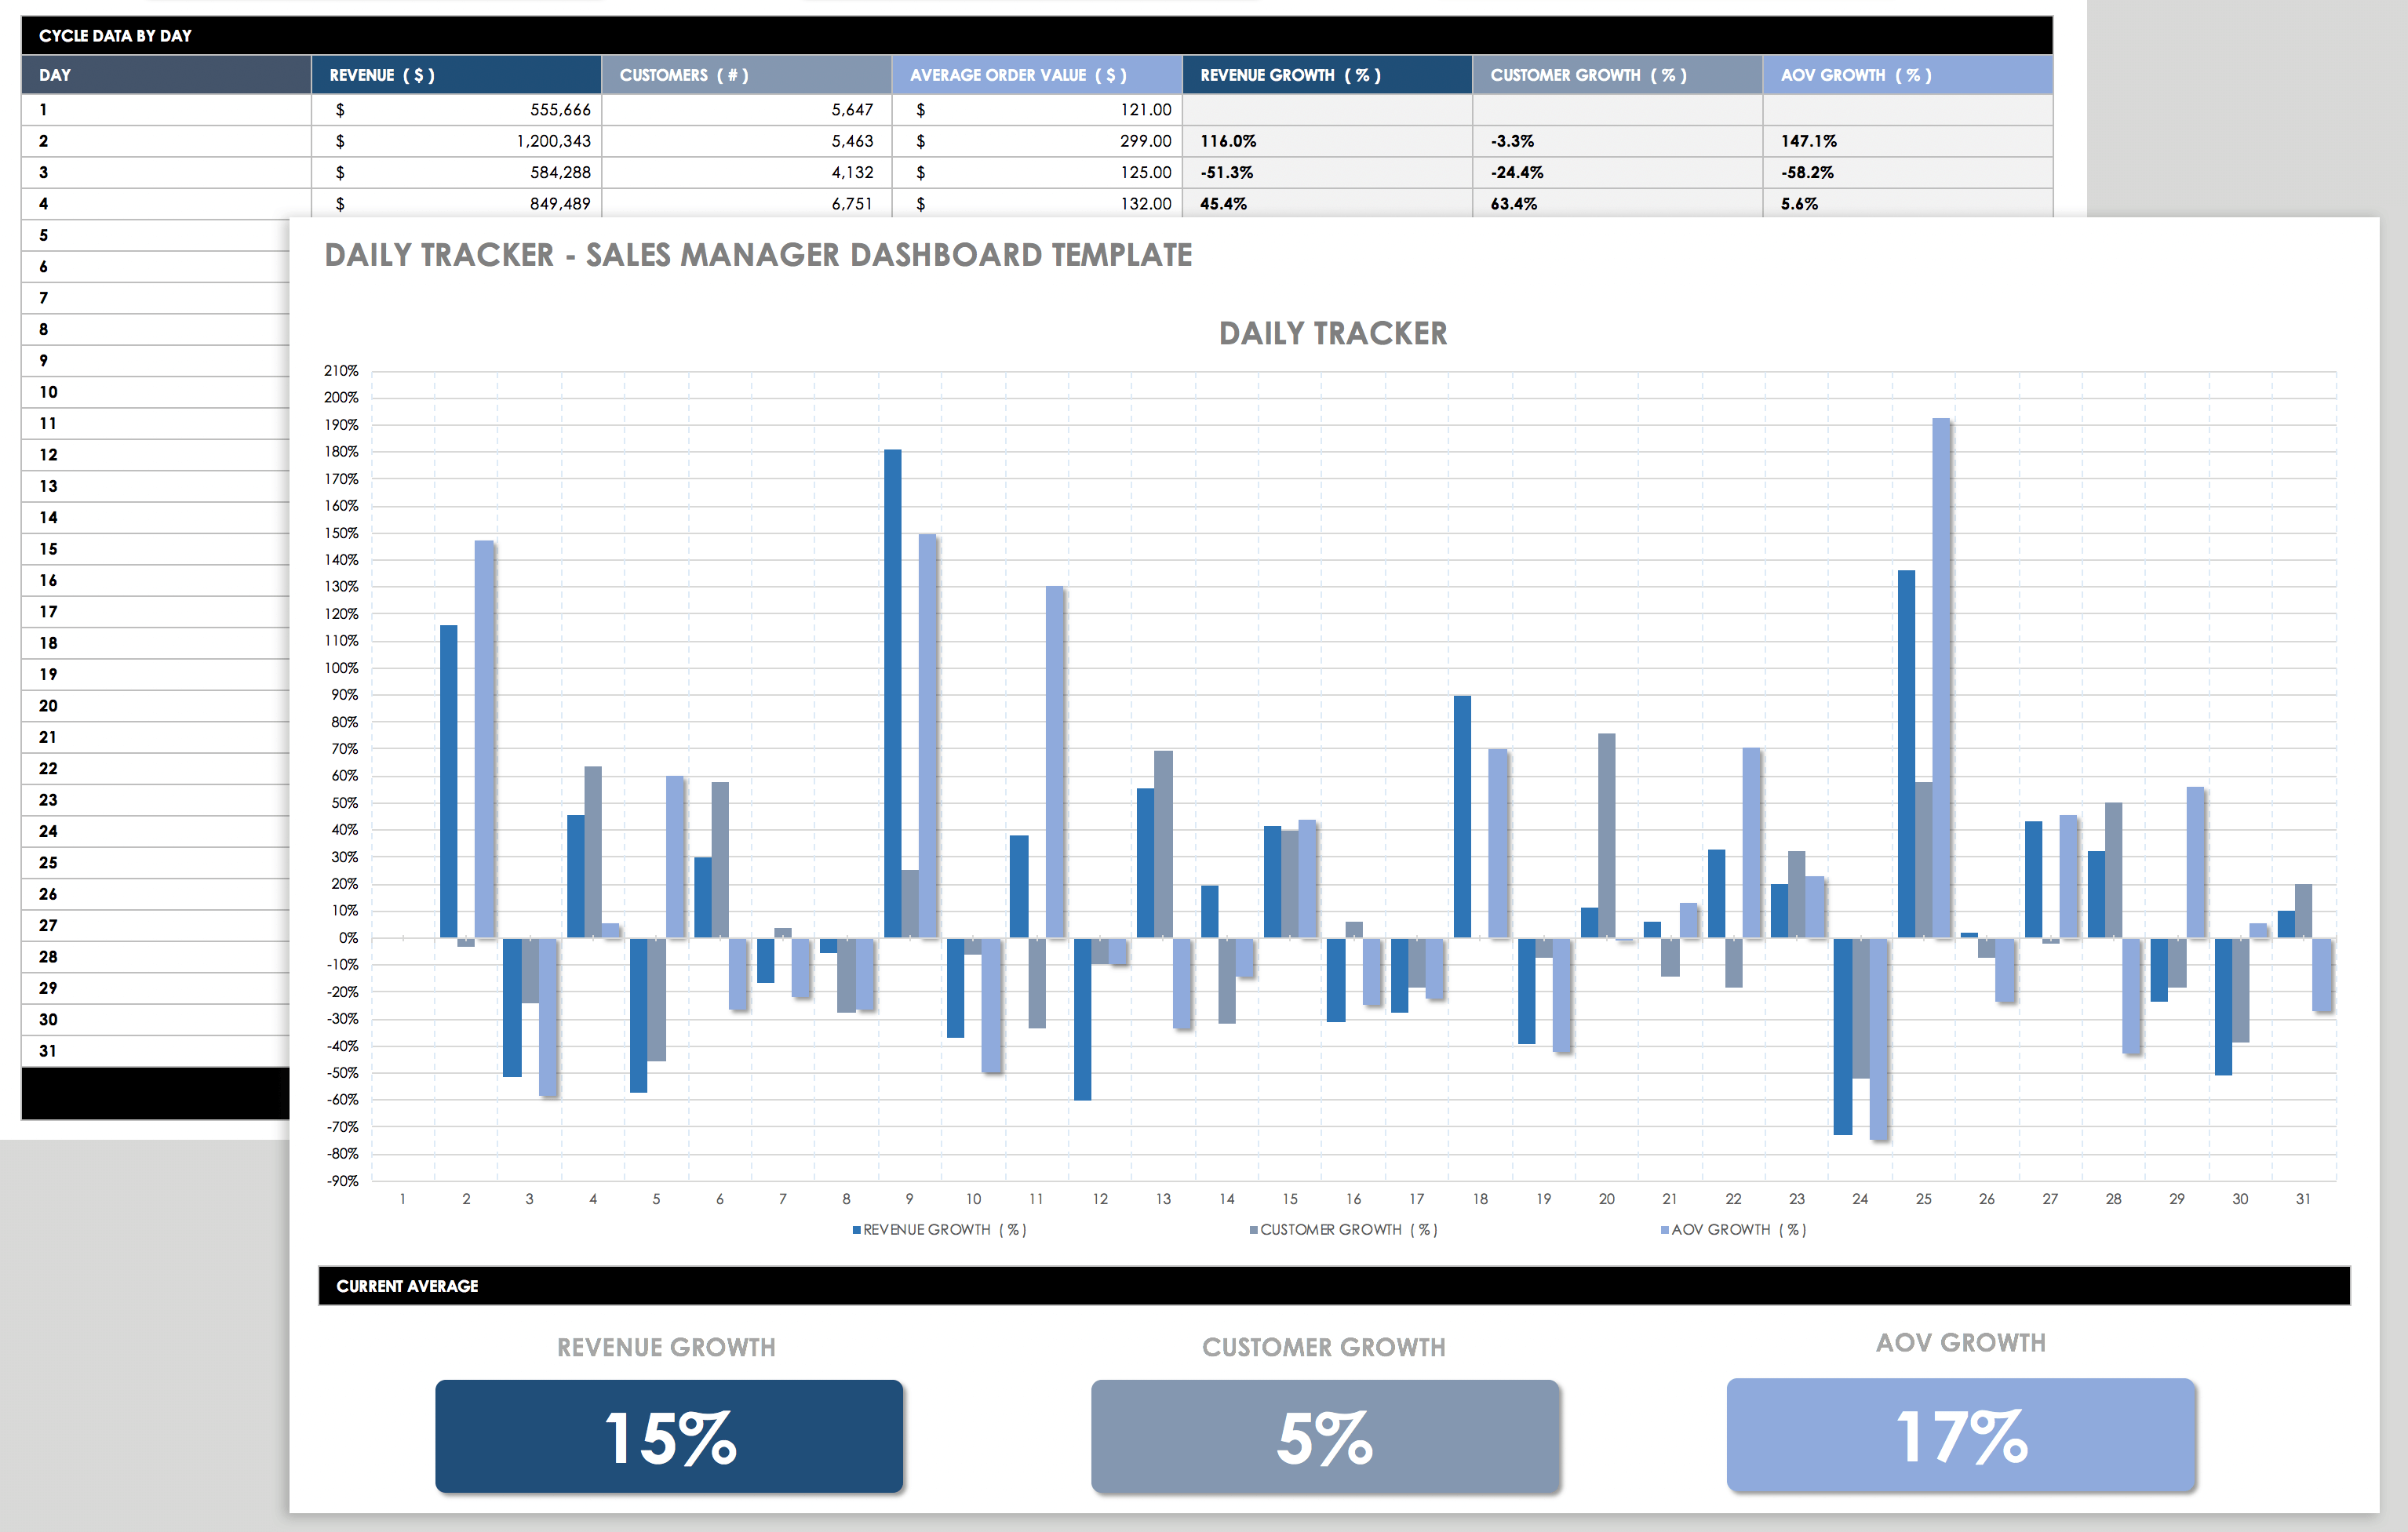
Daily Tracker: Sales Manager Dashboard Template - Excel
Don’t miss any update your team’s progress and activity, and identify what needs your attention immediately. Easily discover how sales are progressing in a given time period, what opportunities have been lost or won, how the pipeline has altered, and which team members should be recognized for their achievements.
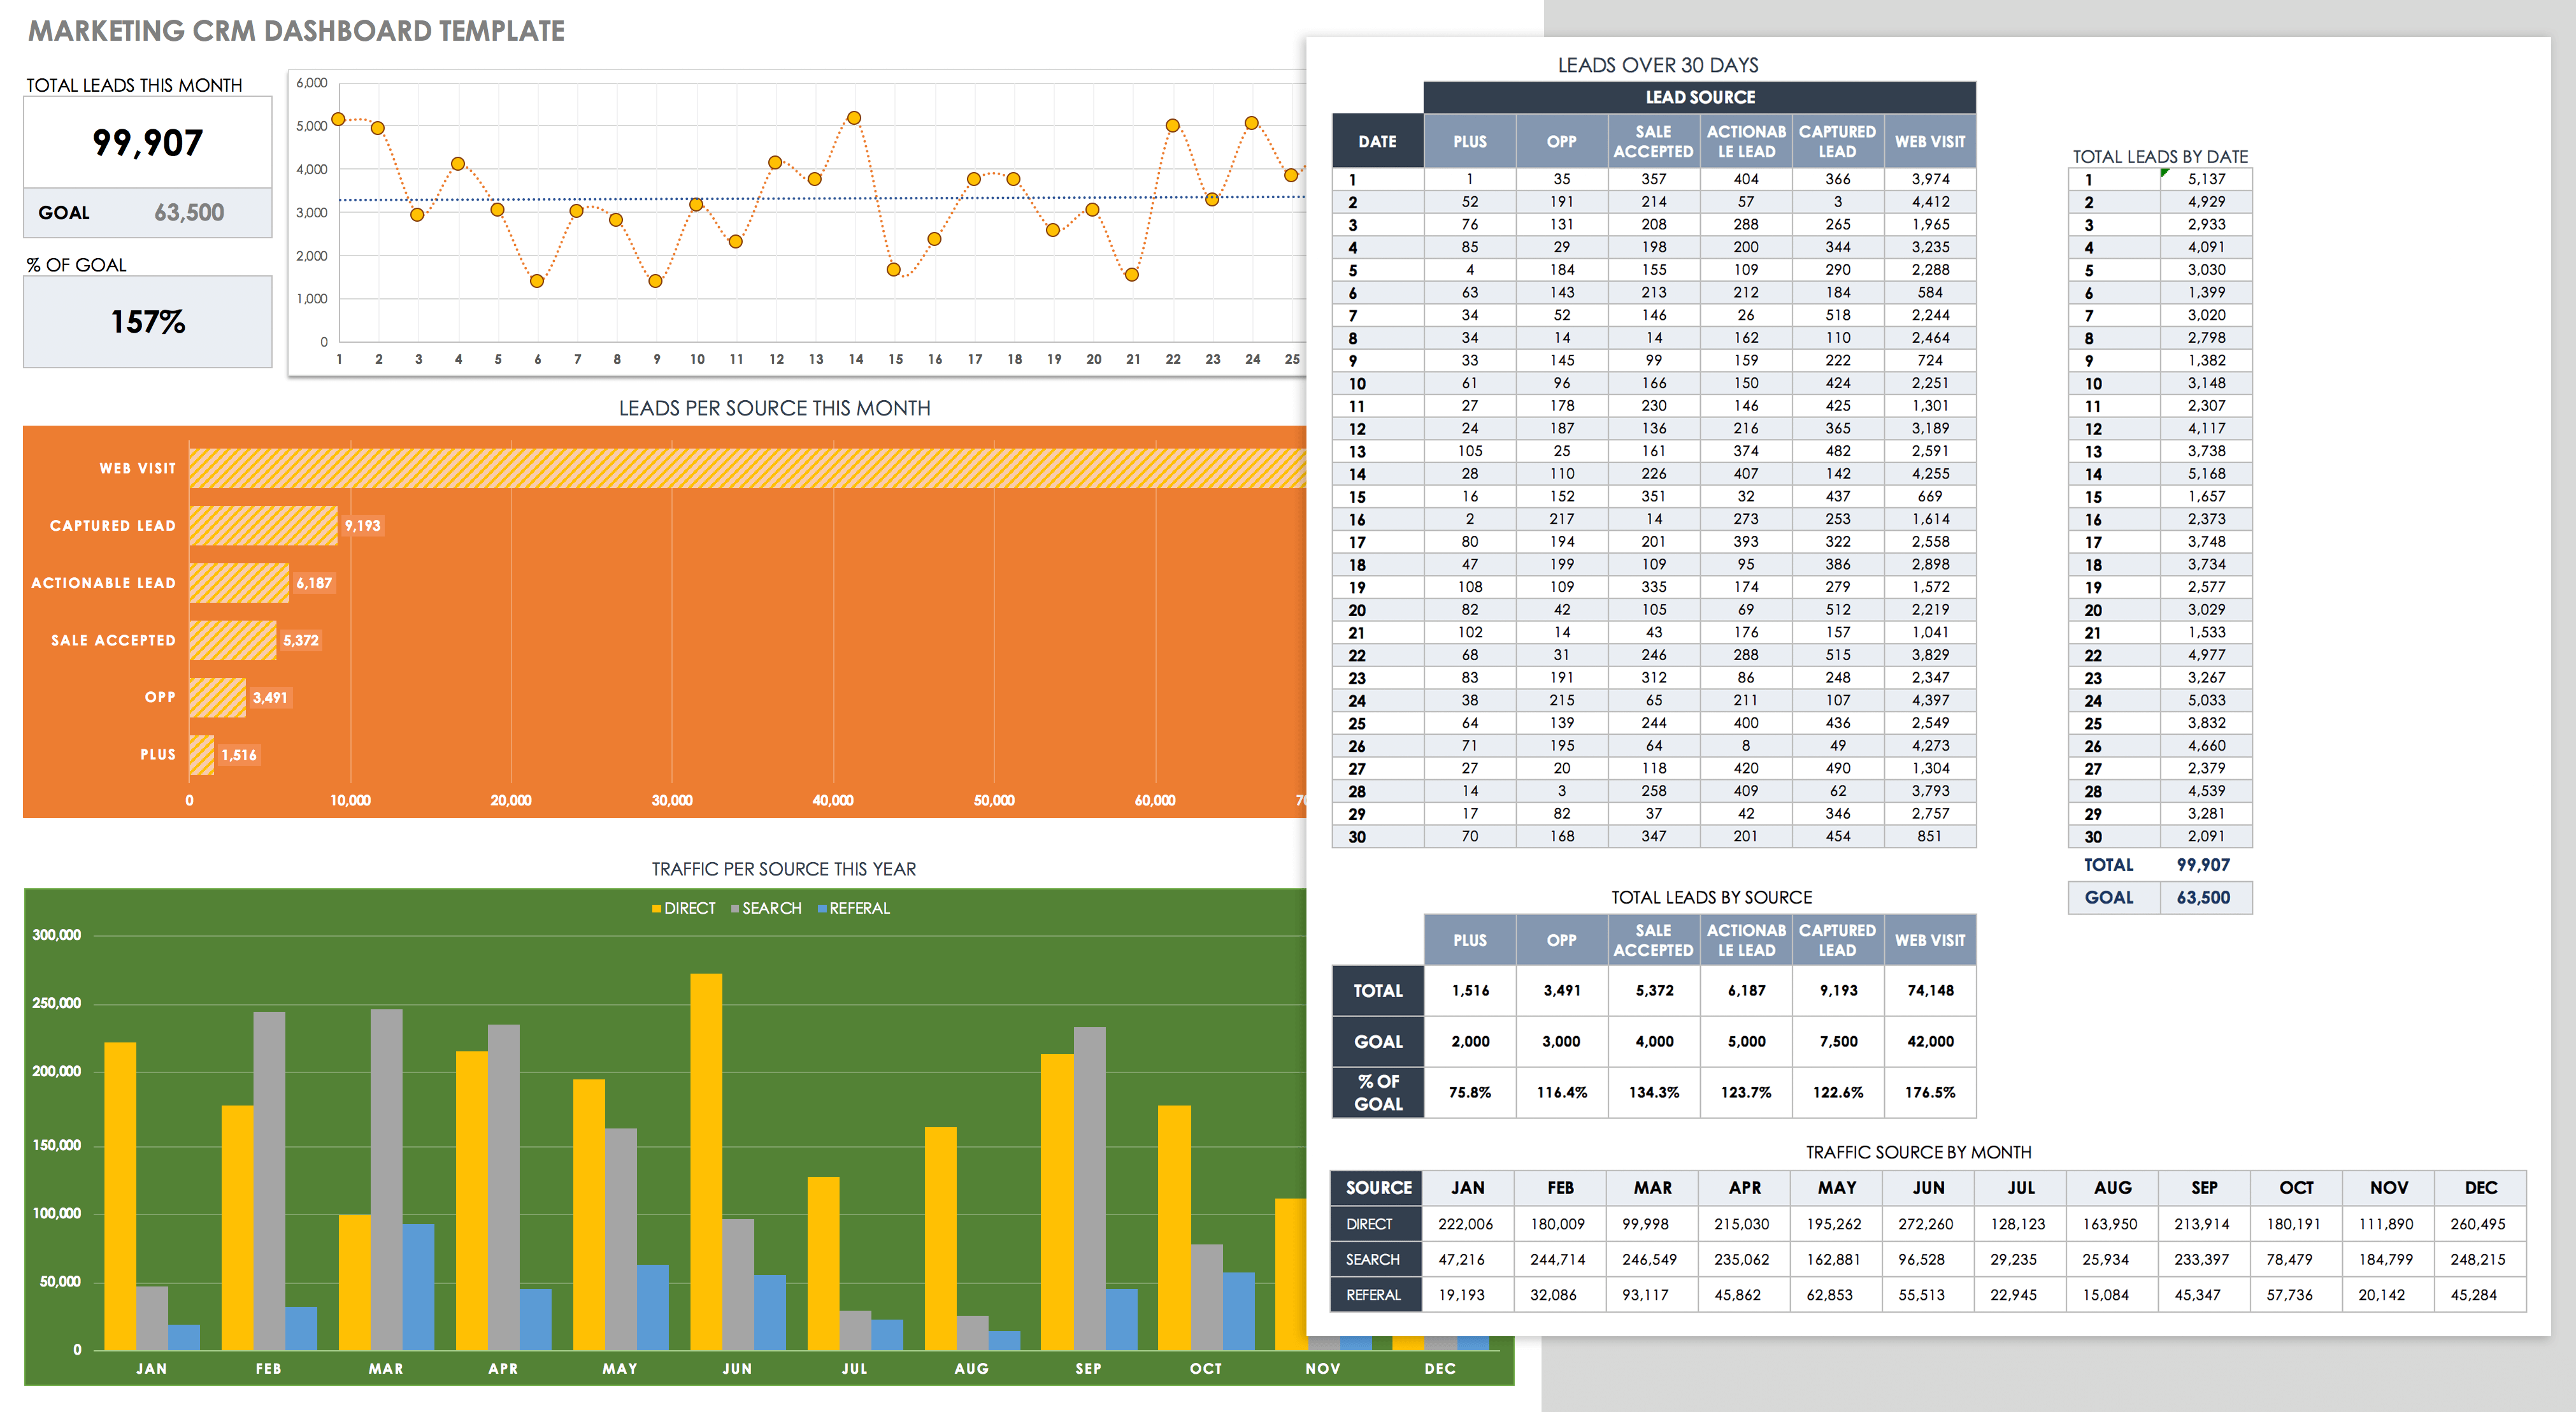
Marketing CRM Dashboard Template - Excel
This easy-to-use template provides great visuals to help you monitor marketing KPIs at a glance. This tool will allow you to evaluate campaign success and determine where you need to make adjustments to improve customer relationships and achieve goals.
Sales Management Dashboard Template - Excel
Track performance by salesperson, region, product, and more. This template is flexible, so you can adjust different fields and use important KPIs to gain insight into factors that drive sales and success.
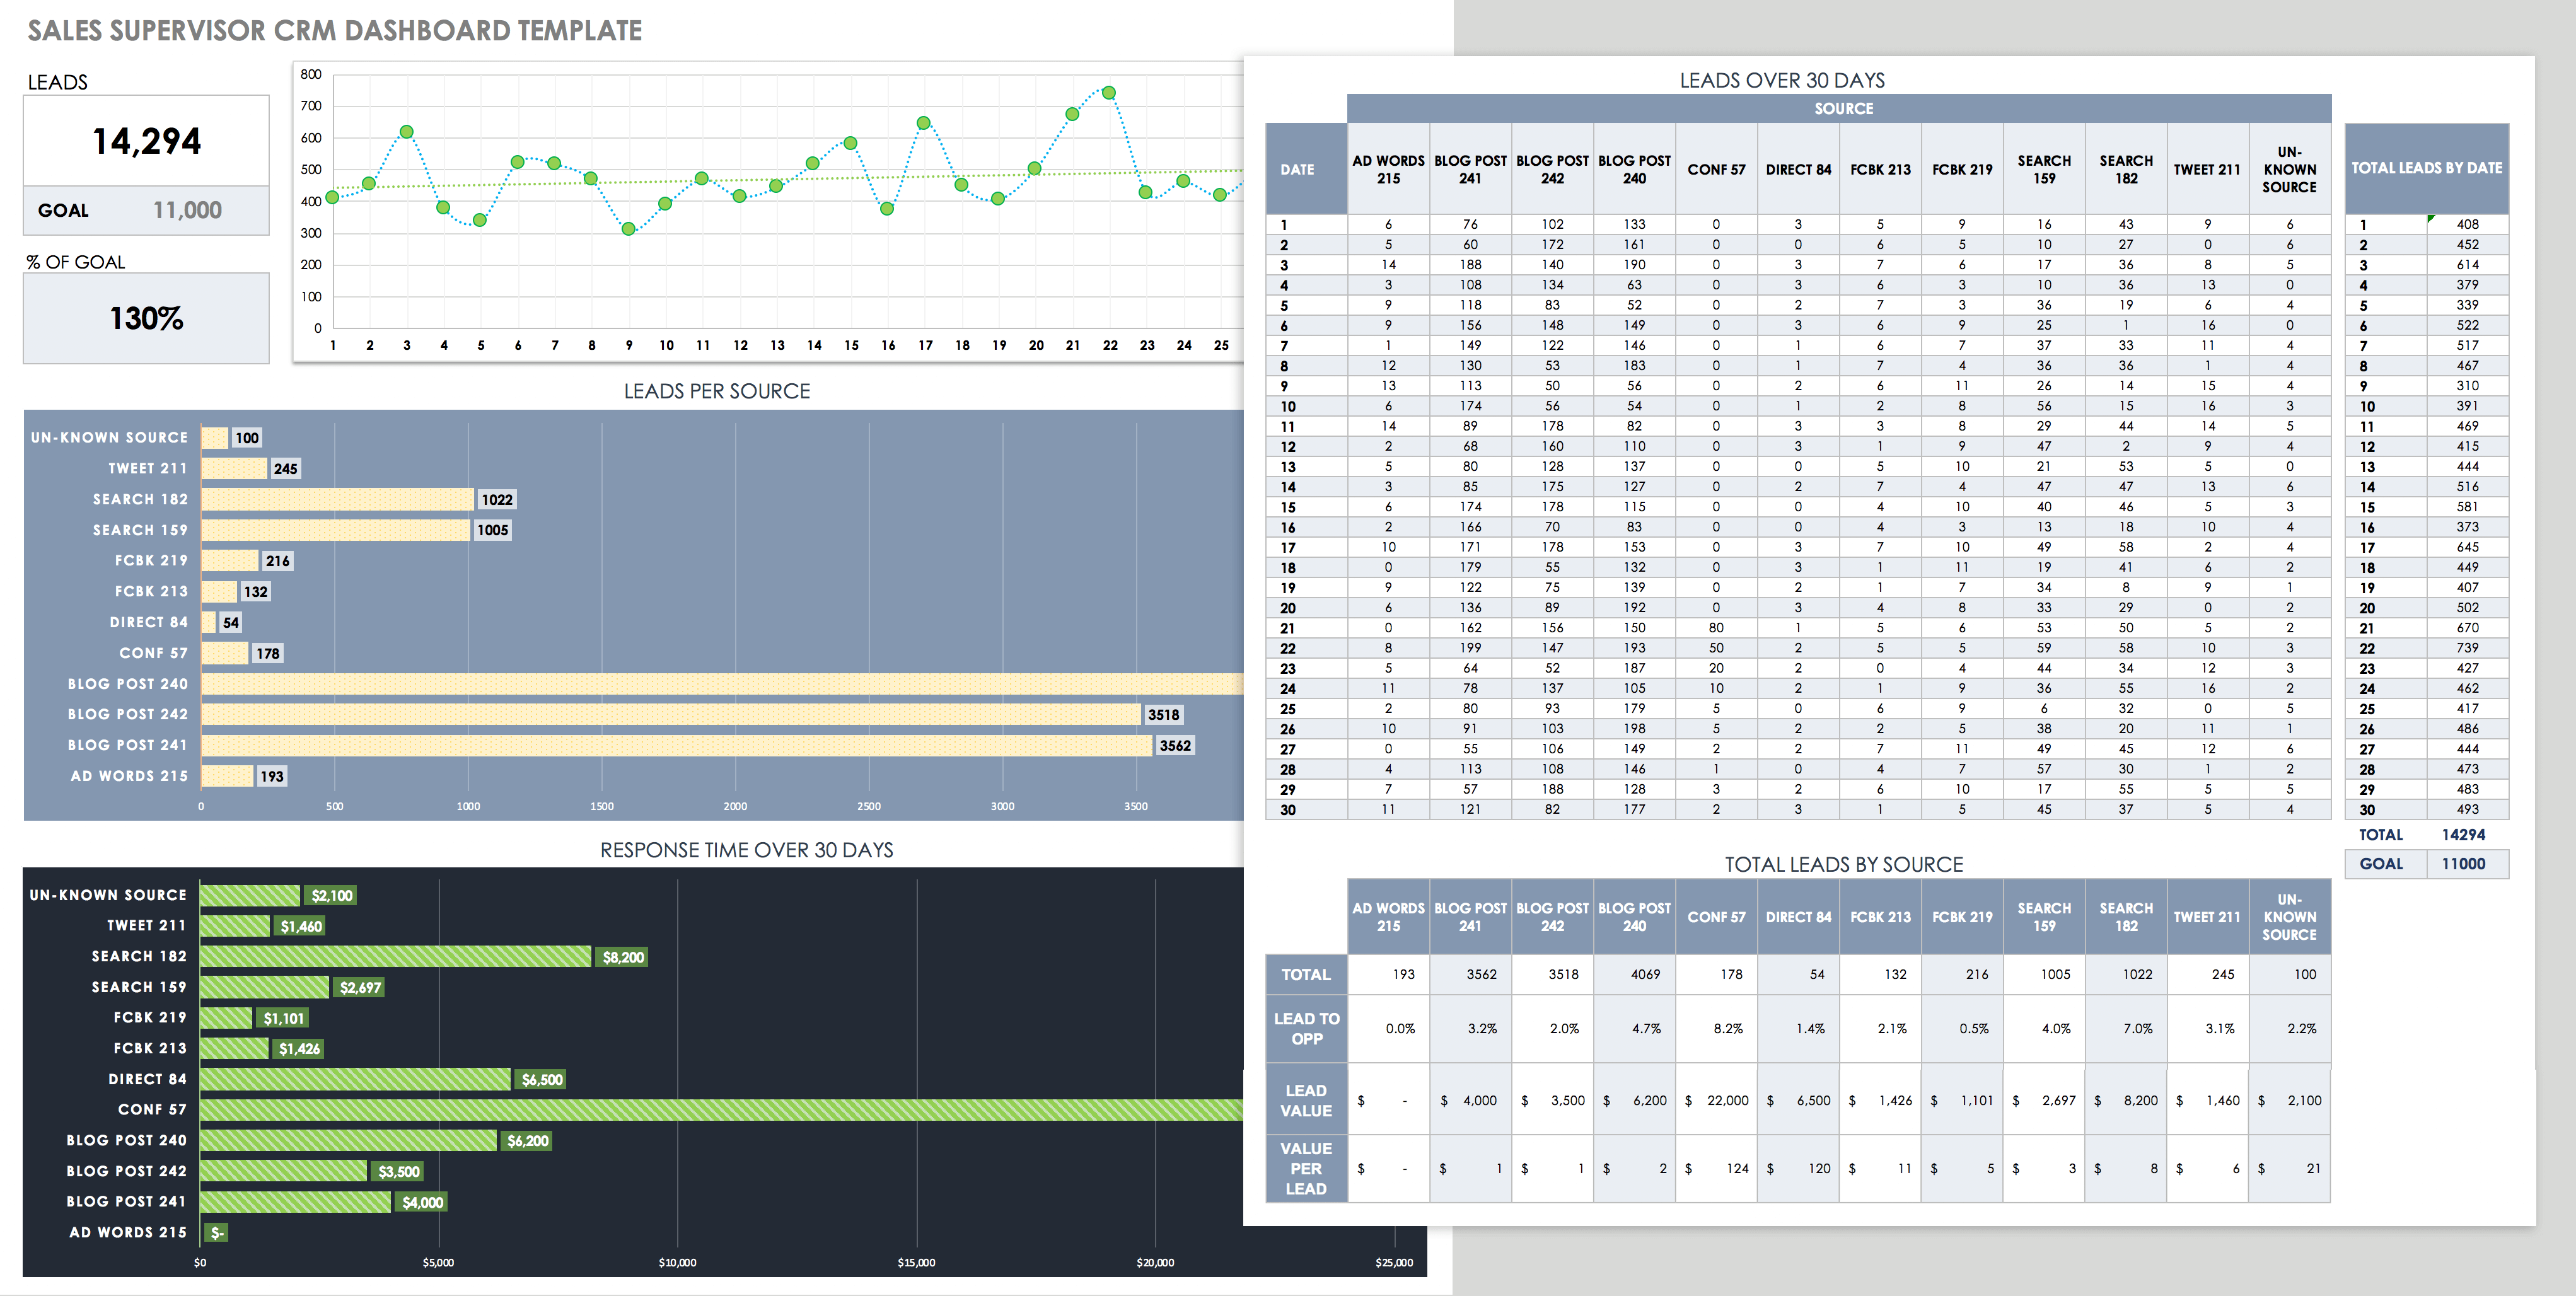
Sales Supervisor CRM Dashboard Template - Excel
Every sales supervisor needs to track where leads are coming from, how the team is generating them, and how long it takes to convert the leads into sales. A dashboard pinpoints where you are relative to your goals, and how much more your team needs to do to attain those goals.
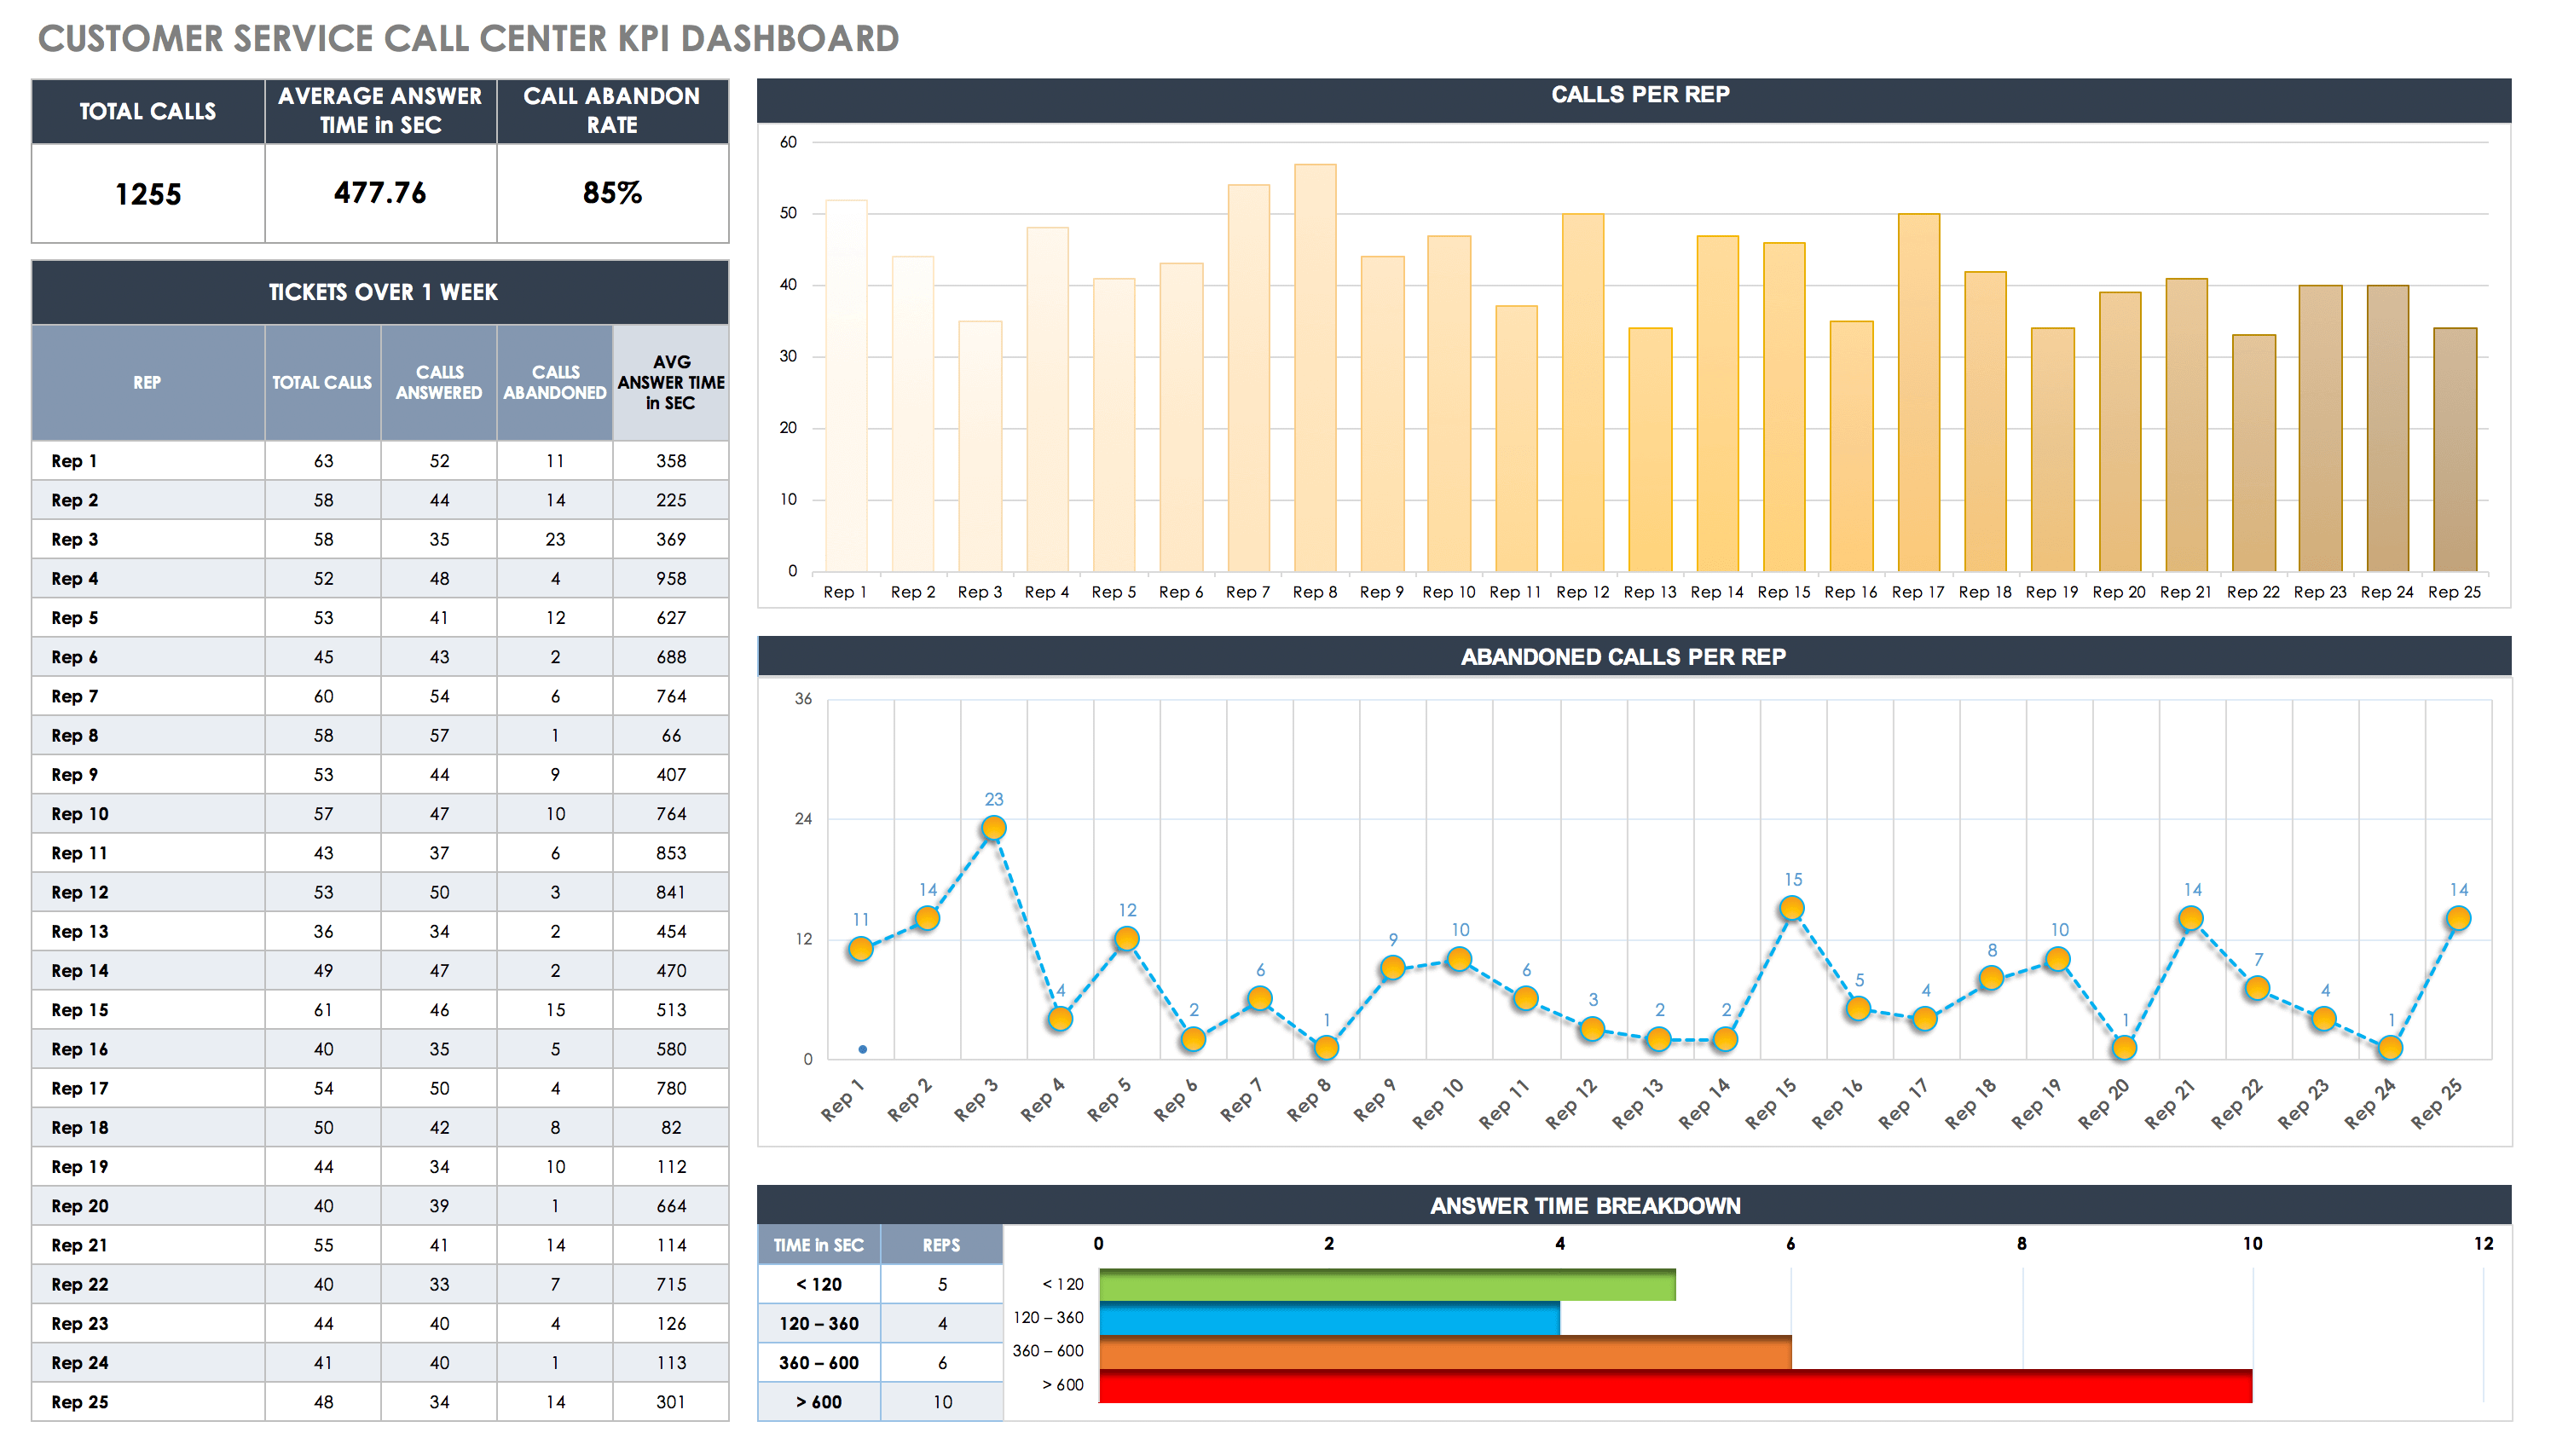
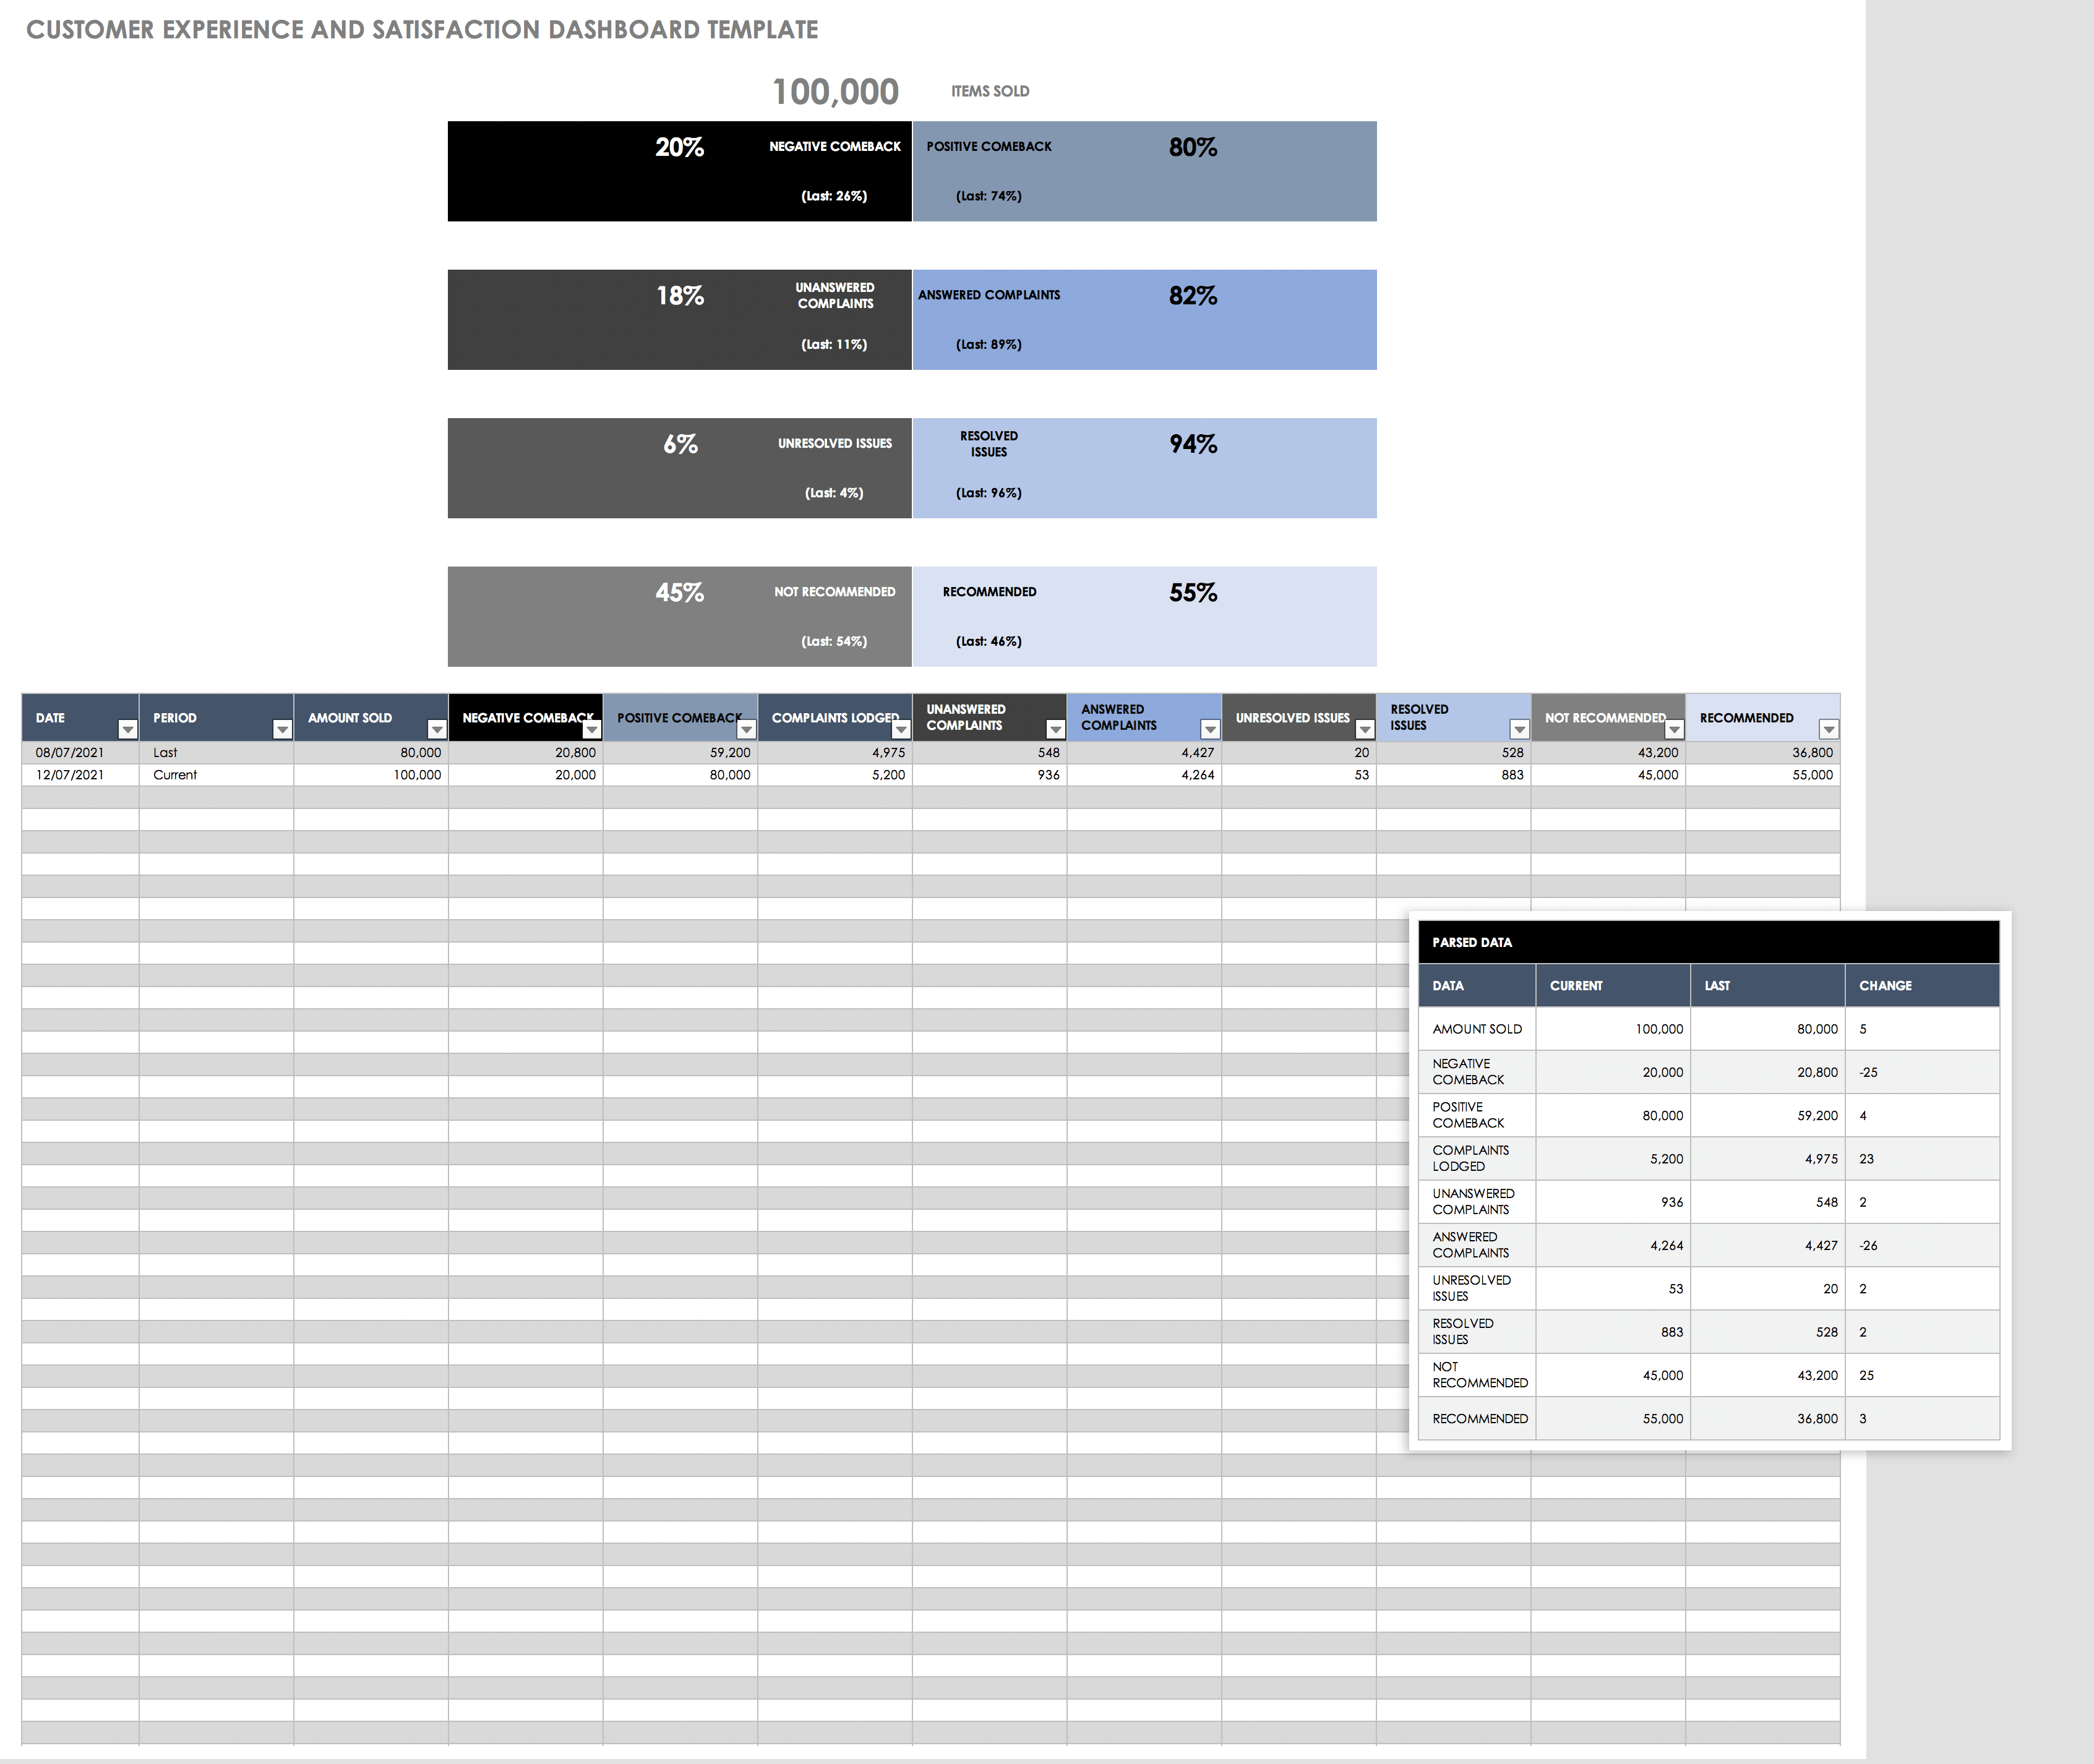
Customer Service Call Center KPI Dashboard Template - Excel
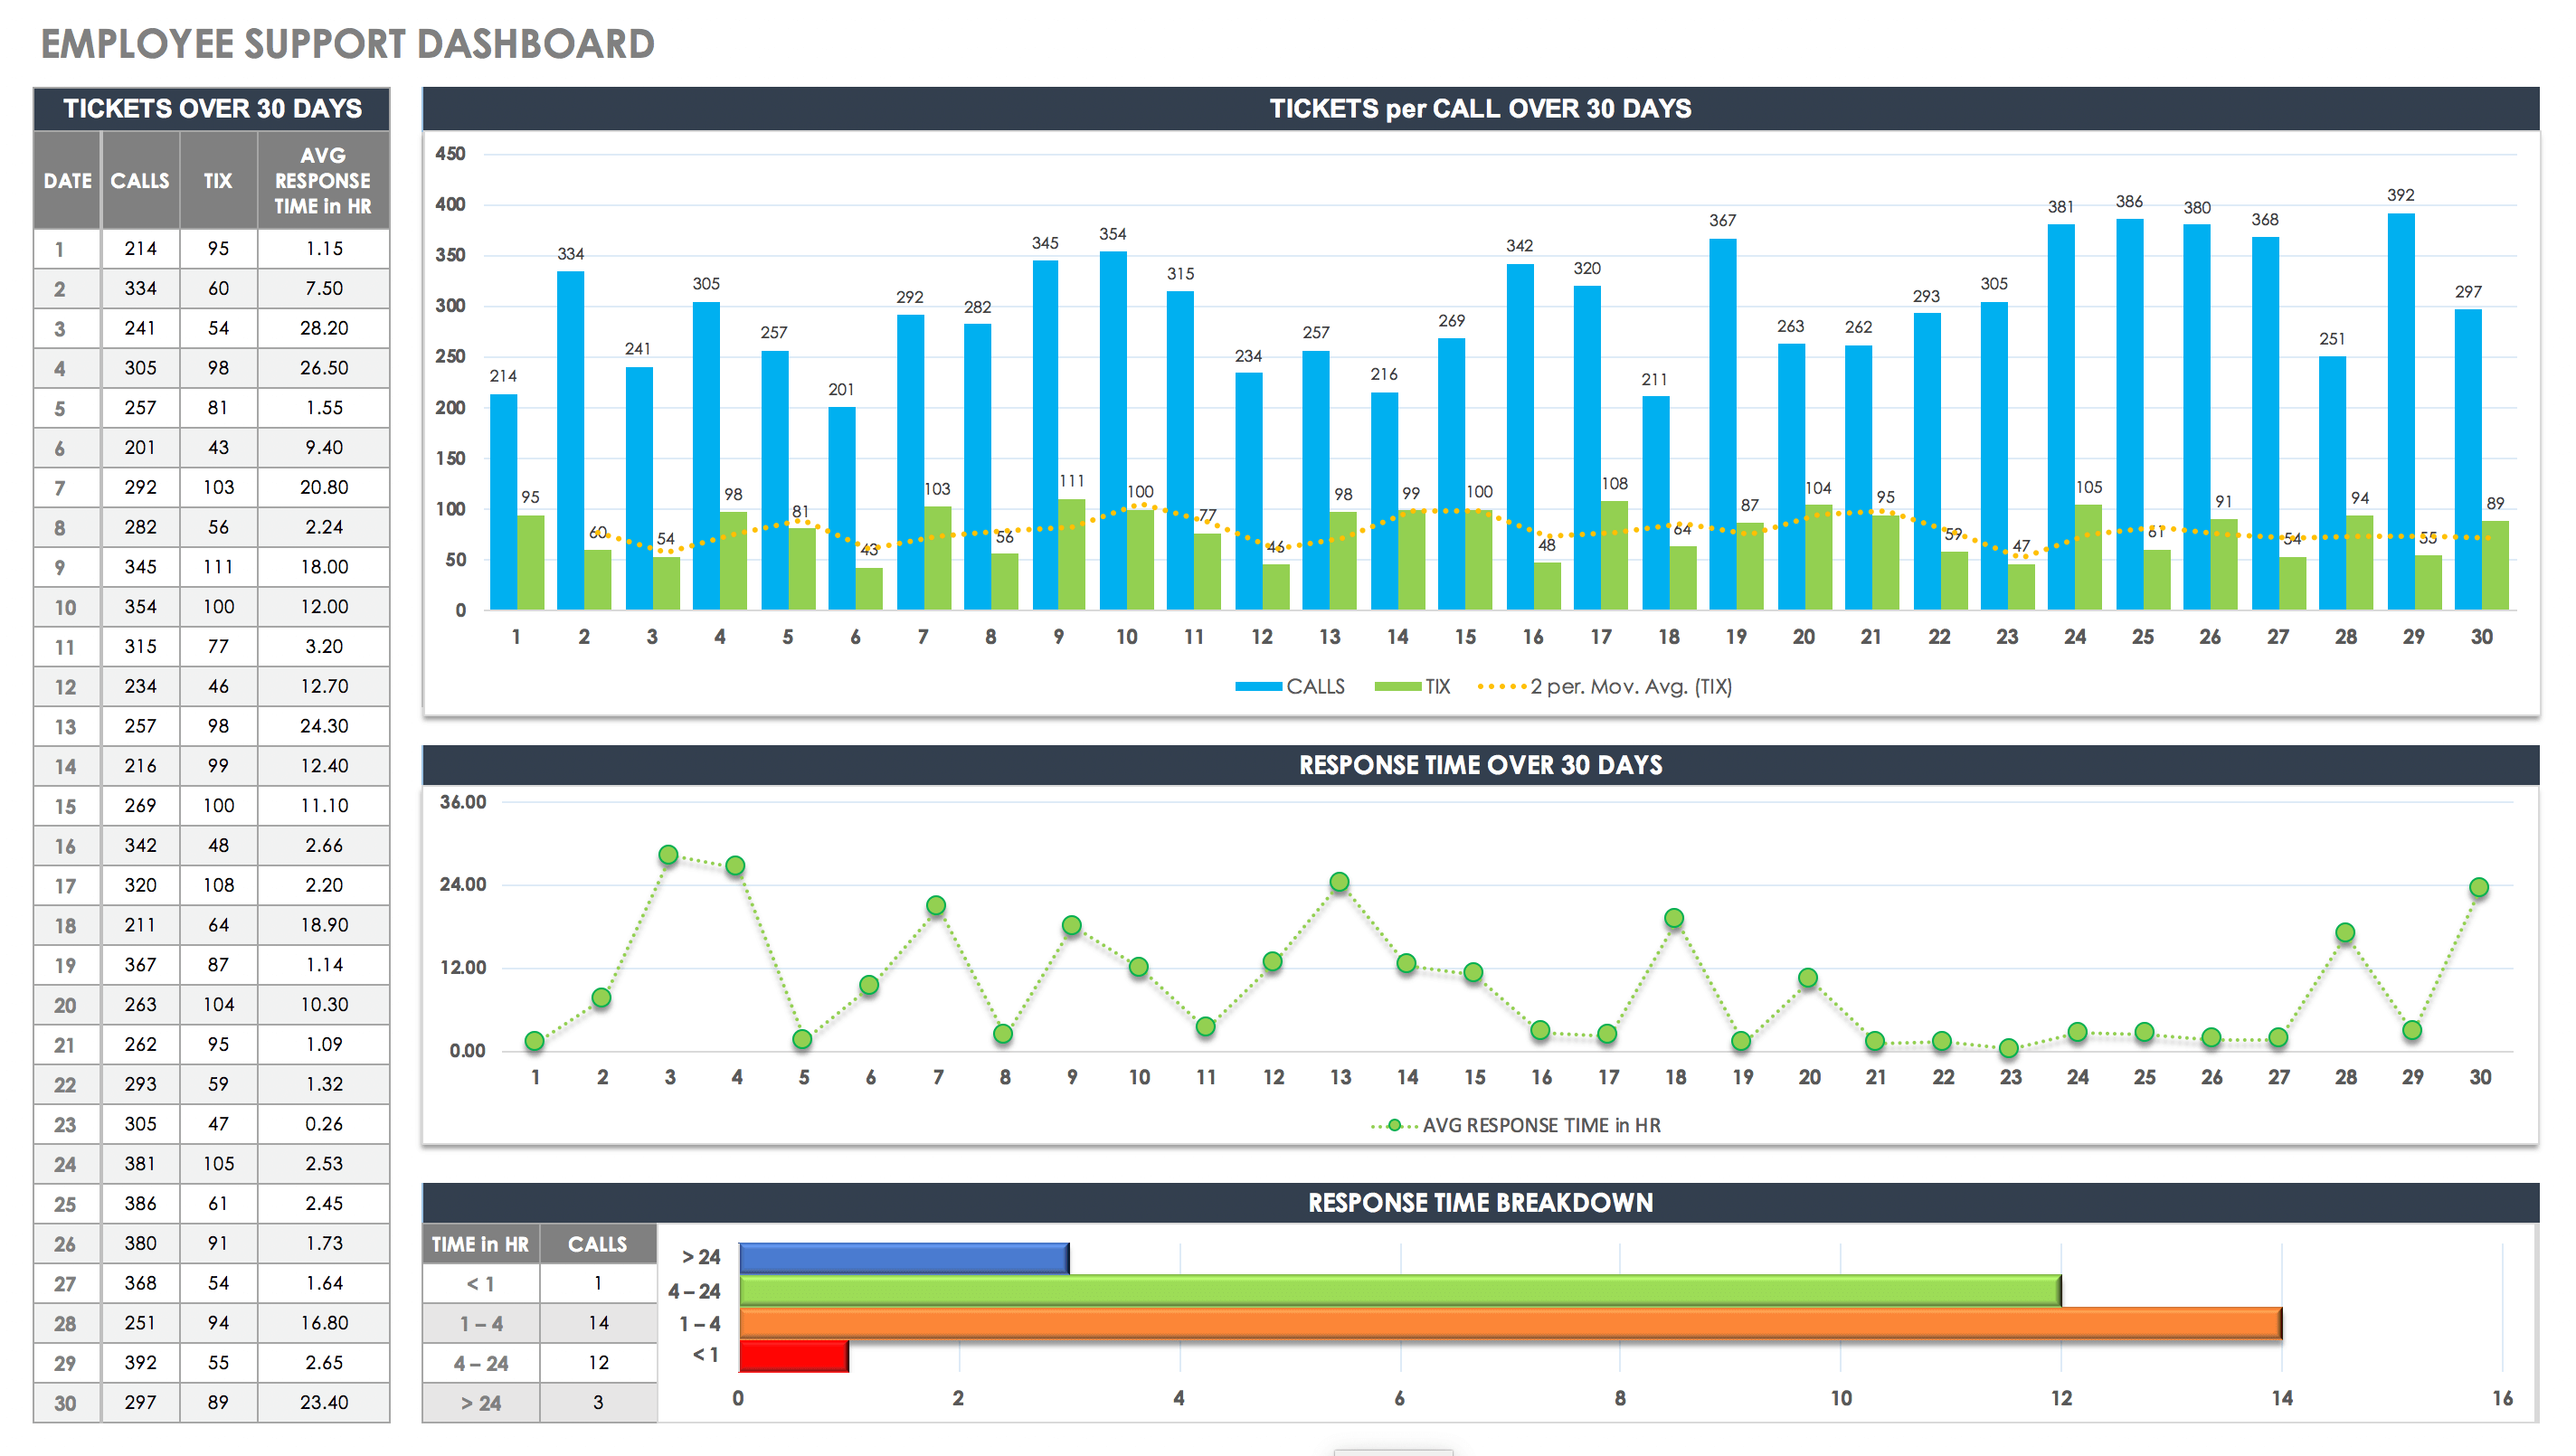
Easily gauge agent performance, calls per minute, customer satisfaction, and other metrics with this customer service call center KPI dashboard. You can compile data and conduct analyses of individuals or departments to see if your organization is keeping pace with weekly targets.
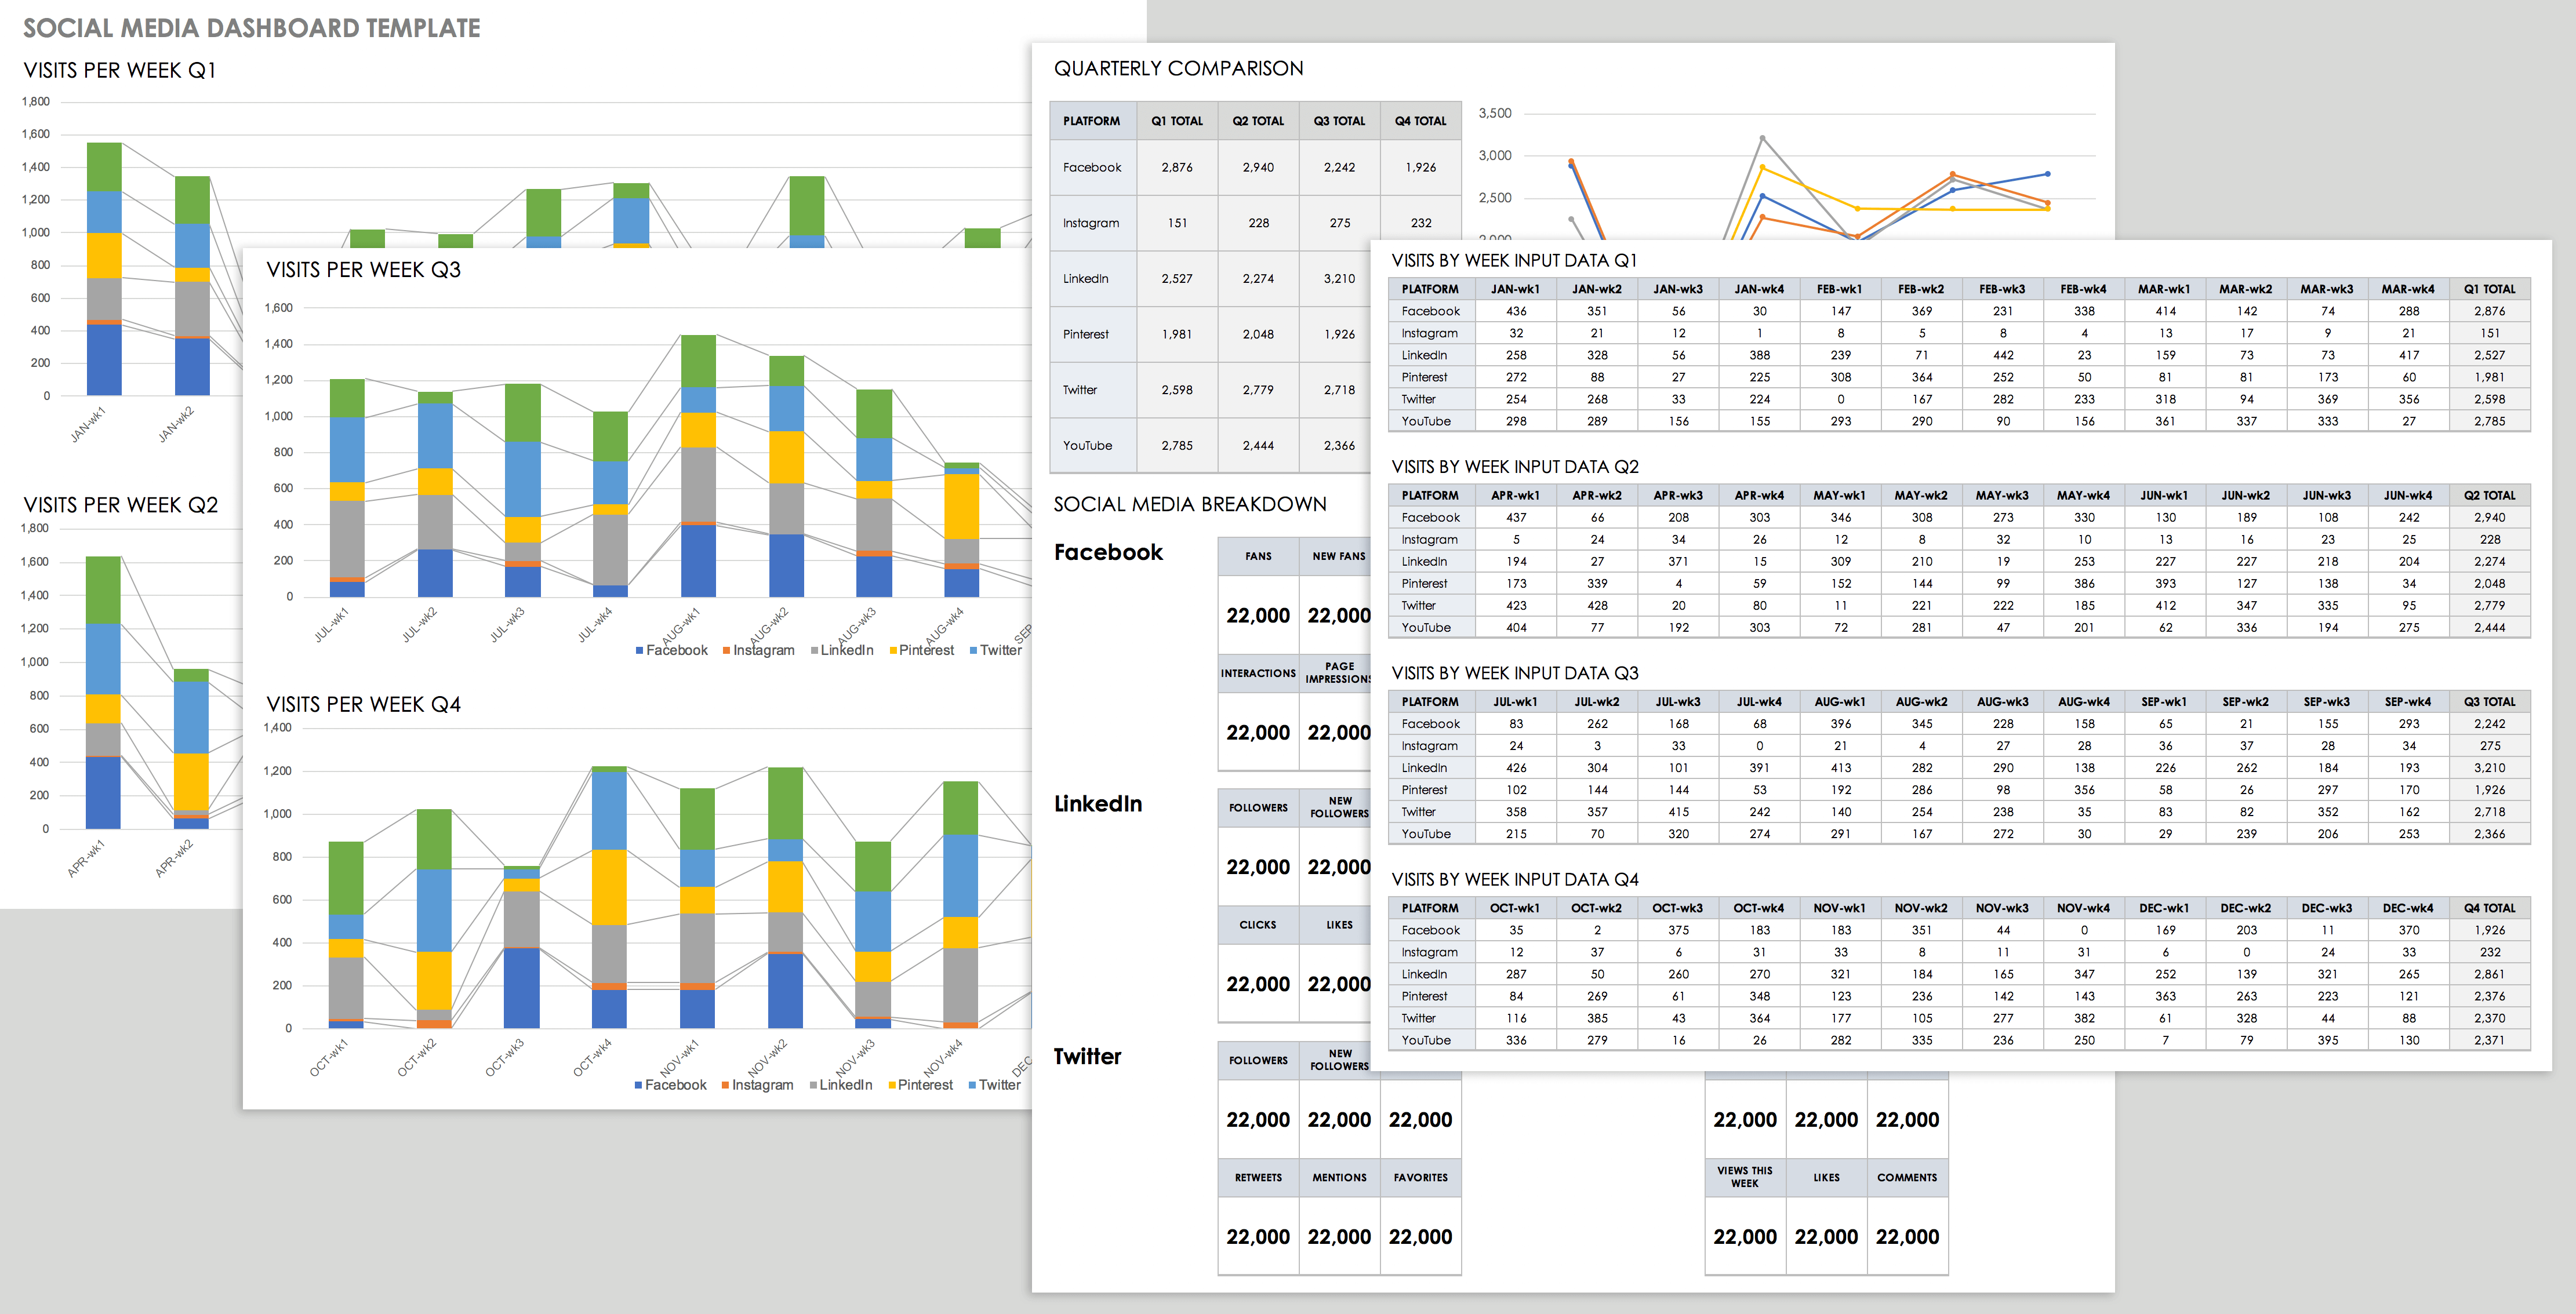
Social Media Dashboard Template - Excel
A social media dashboard allows you to monitor your performance on multiple channels in one report. Track audience engagement and make strategic decisions with this dashboard template that displays the data you need to focus your social media marketing efforts.
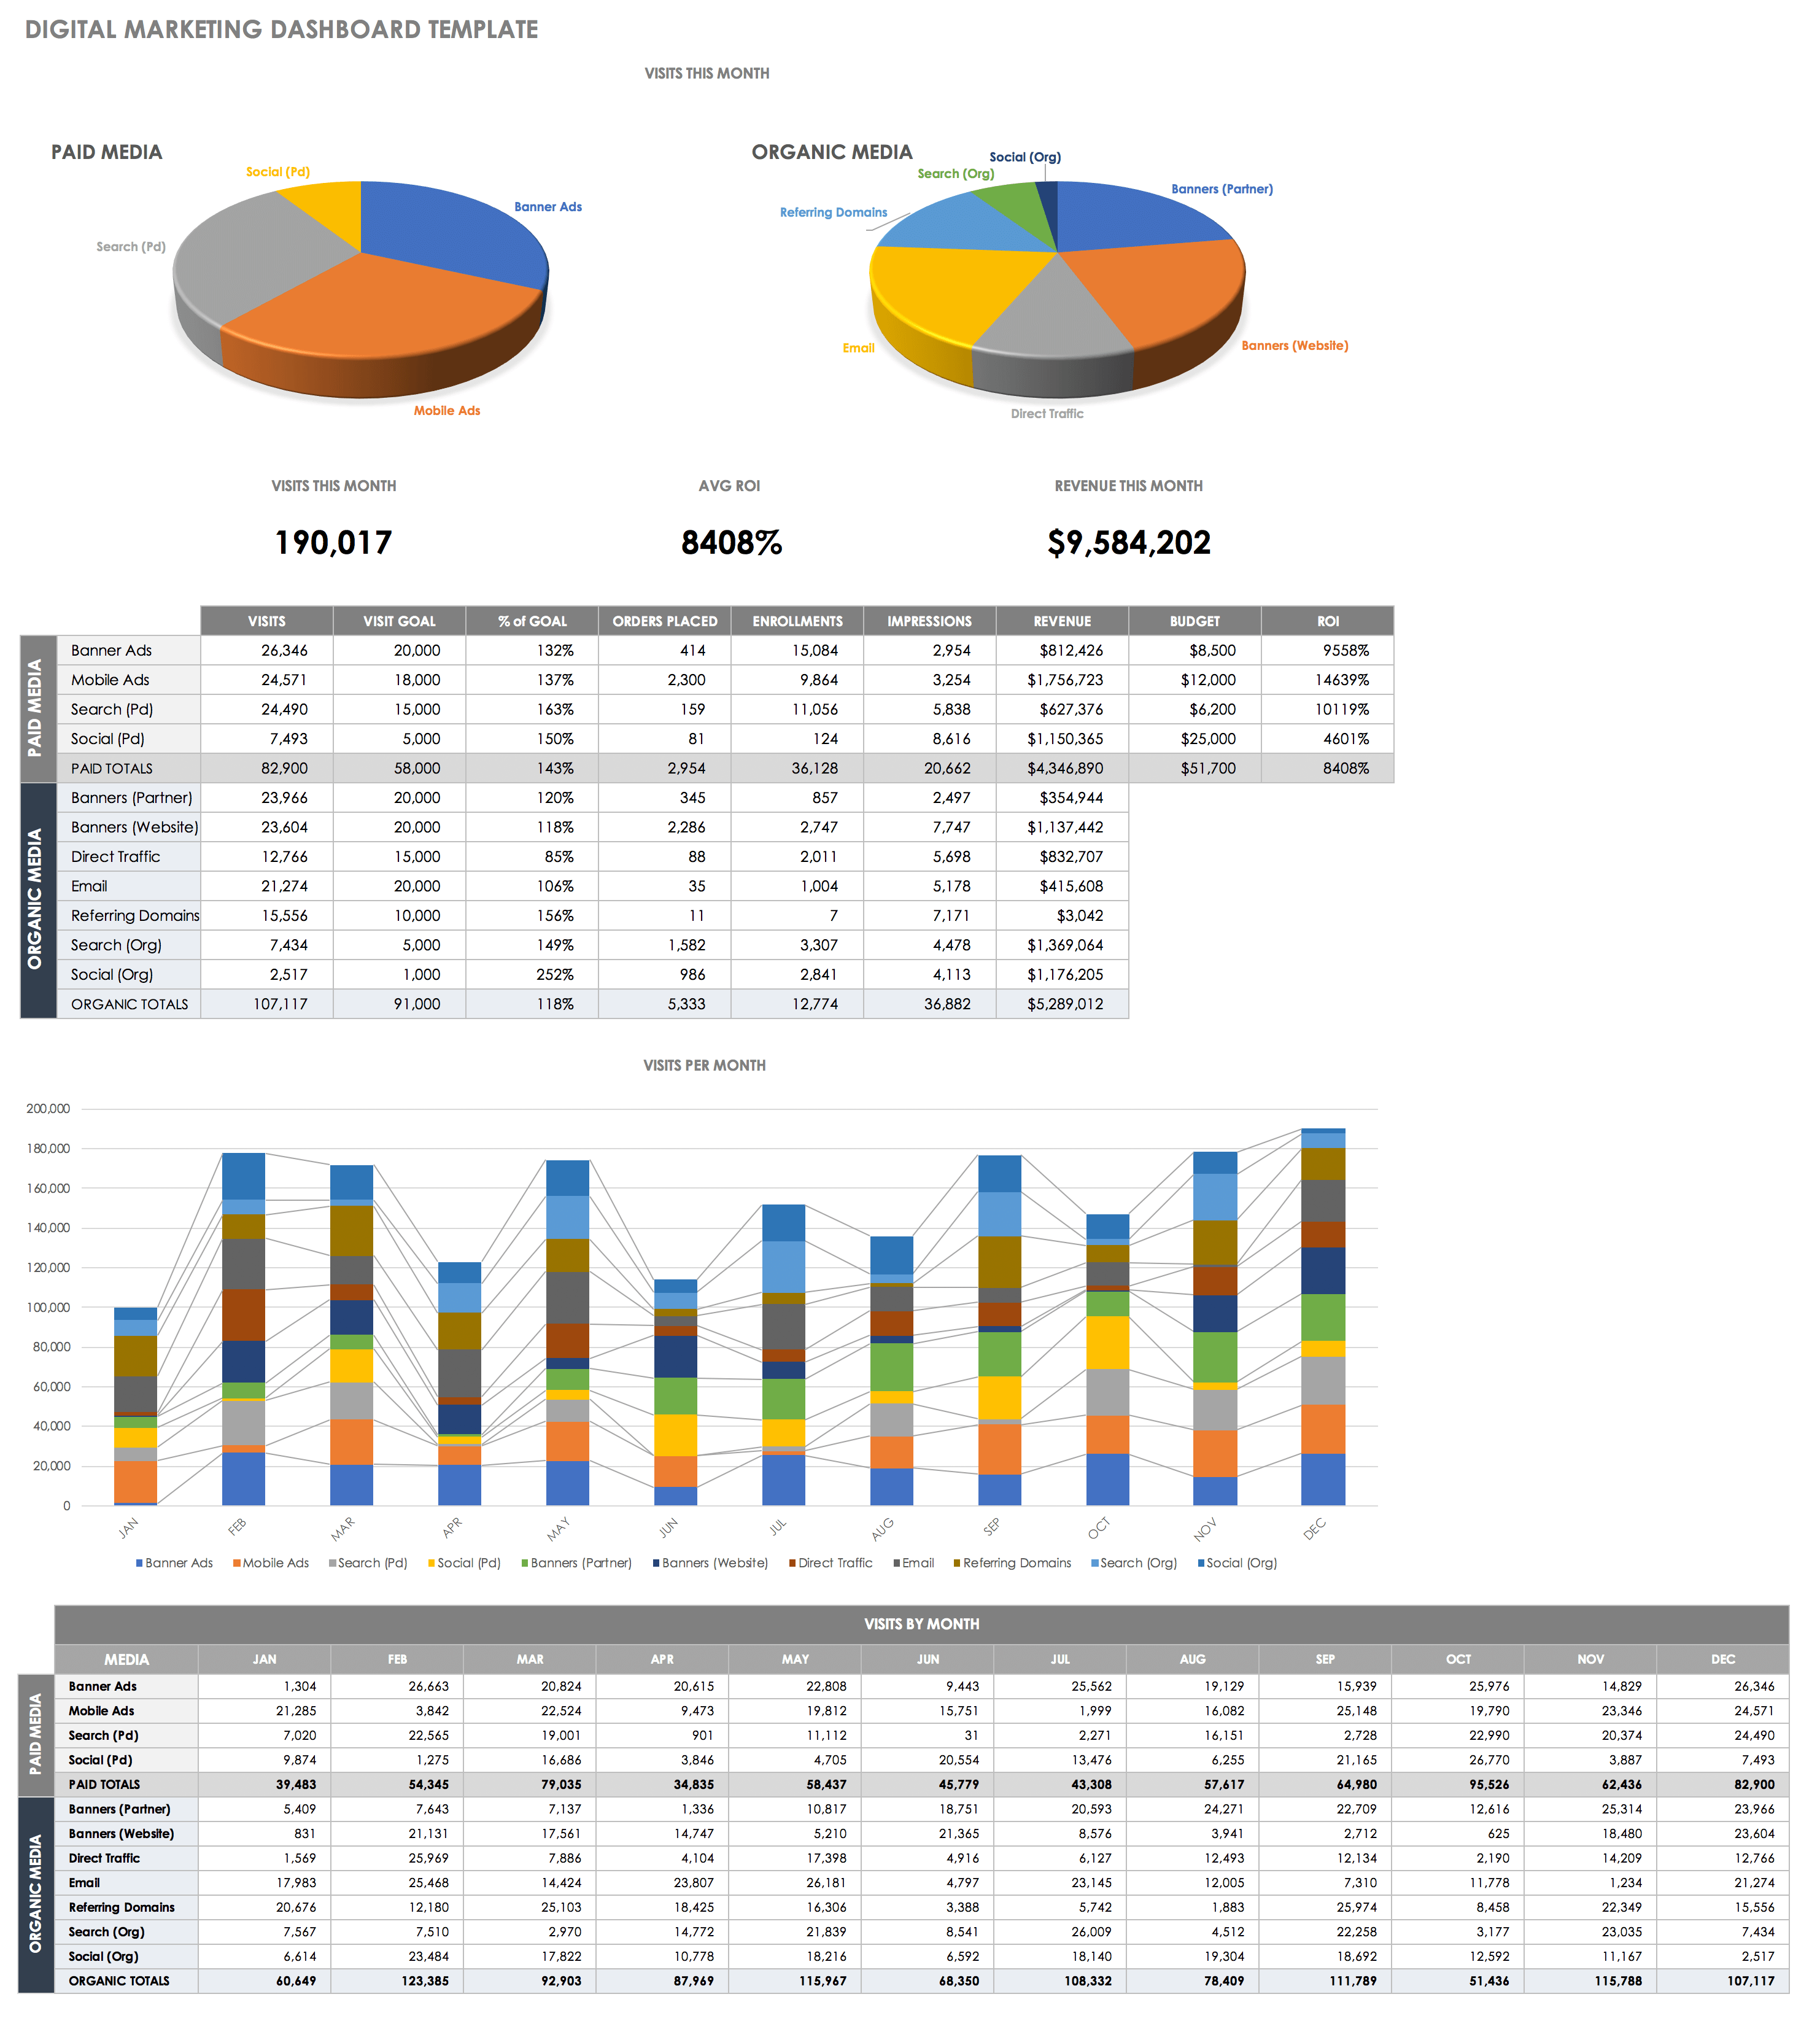
Digital Marketing Dashboard Template - Excel
Leads generated through a free trial program can be extremely valuable to SaaS marketing efforts. People who have decided to invest time in learning about a product are usually high- quality prospects. This digital marketing dashboard template provides a quick analysis of daily and monthly leads.
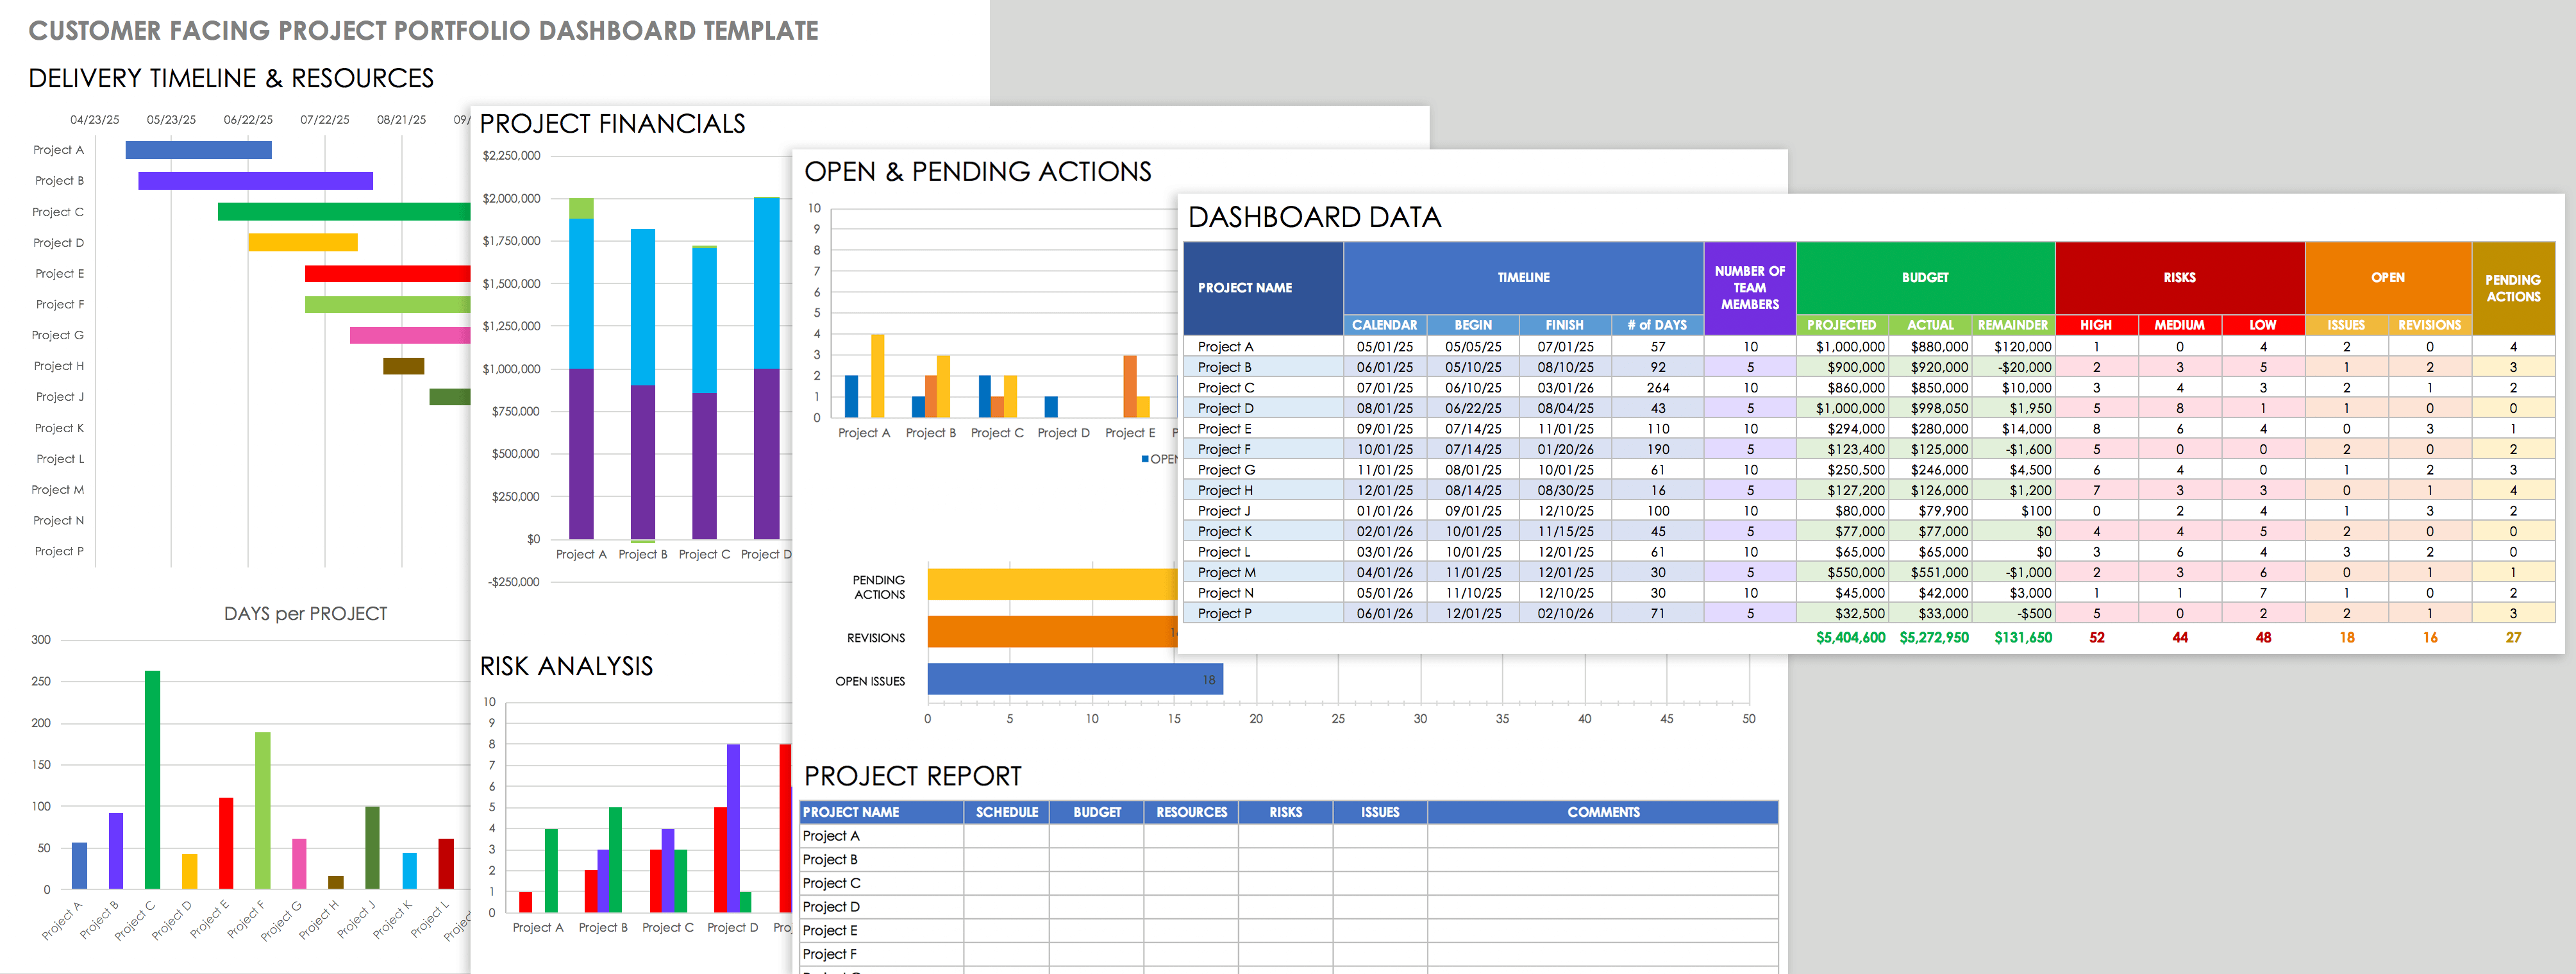
Customer-Facing Project Portfolio Dashboard Template - Excel
For advertising or marketing organizations, transparent reporting of project status, budgets, and timelines builds customer relationships. This dashboard template provides a status overview of all projects, and shows which projects are on schedule and what issues you need to address. Easily track budget, risks, and other key project parameters. Use this free, turnkey template to manage your project portfolio or customize it to meet your specific customer and company needs.
Download Customer-Facing Project Portfolio Dashboard Template
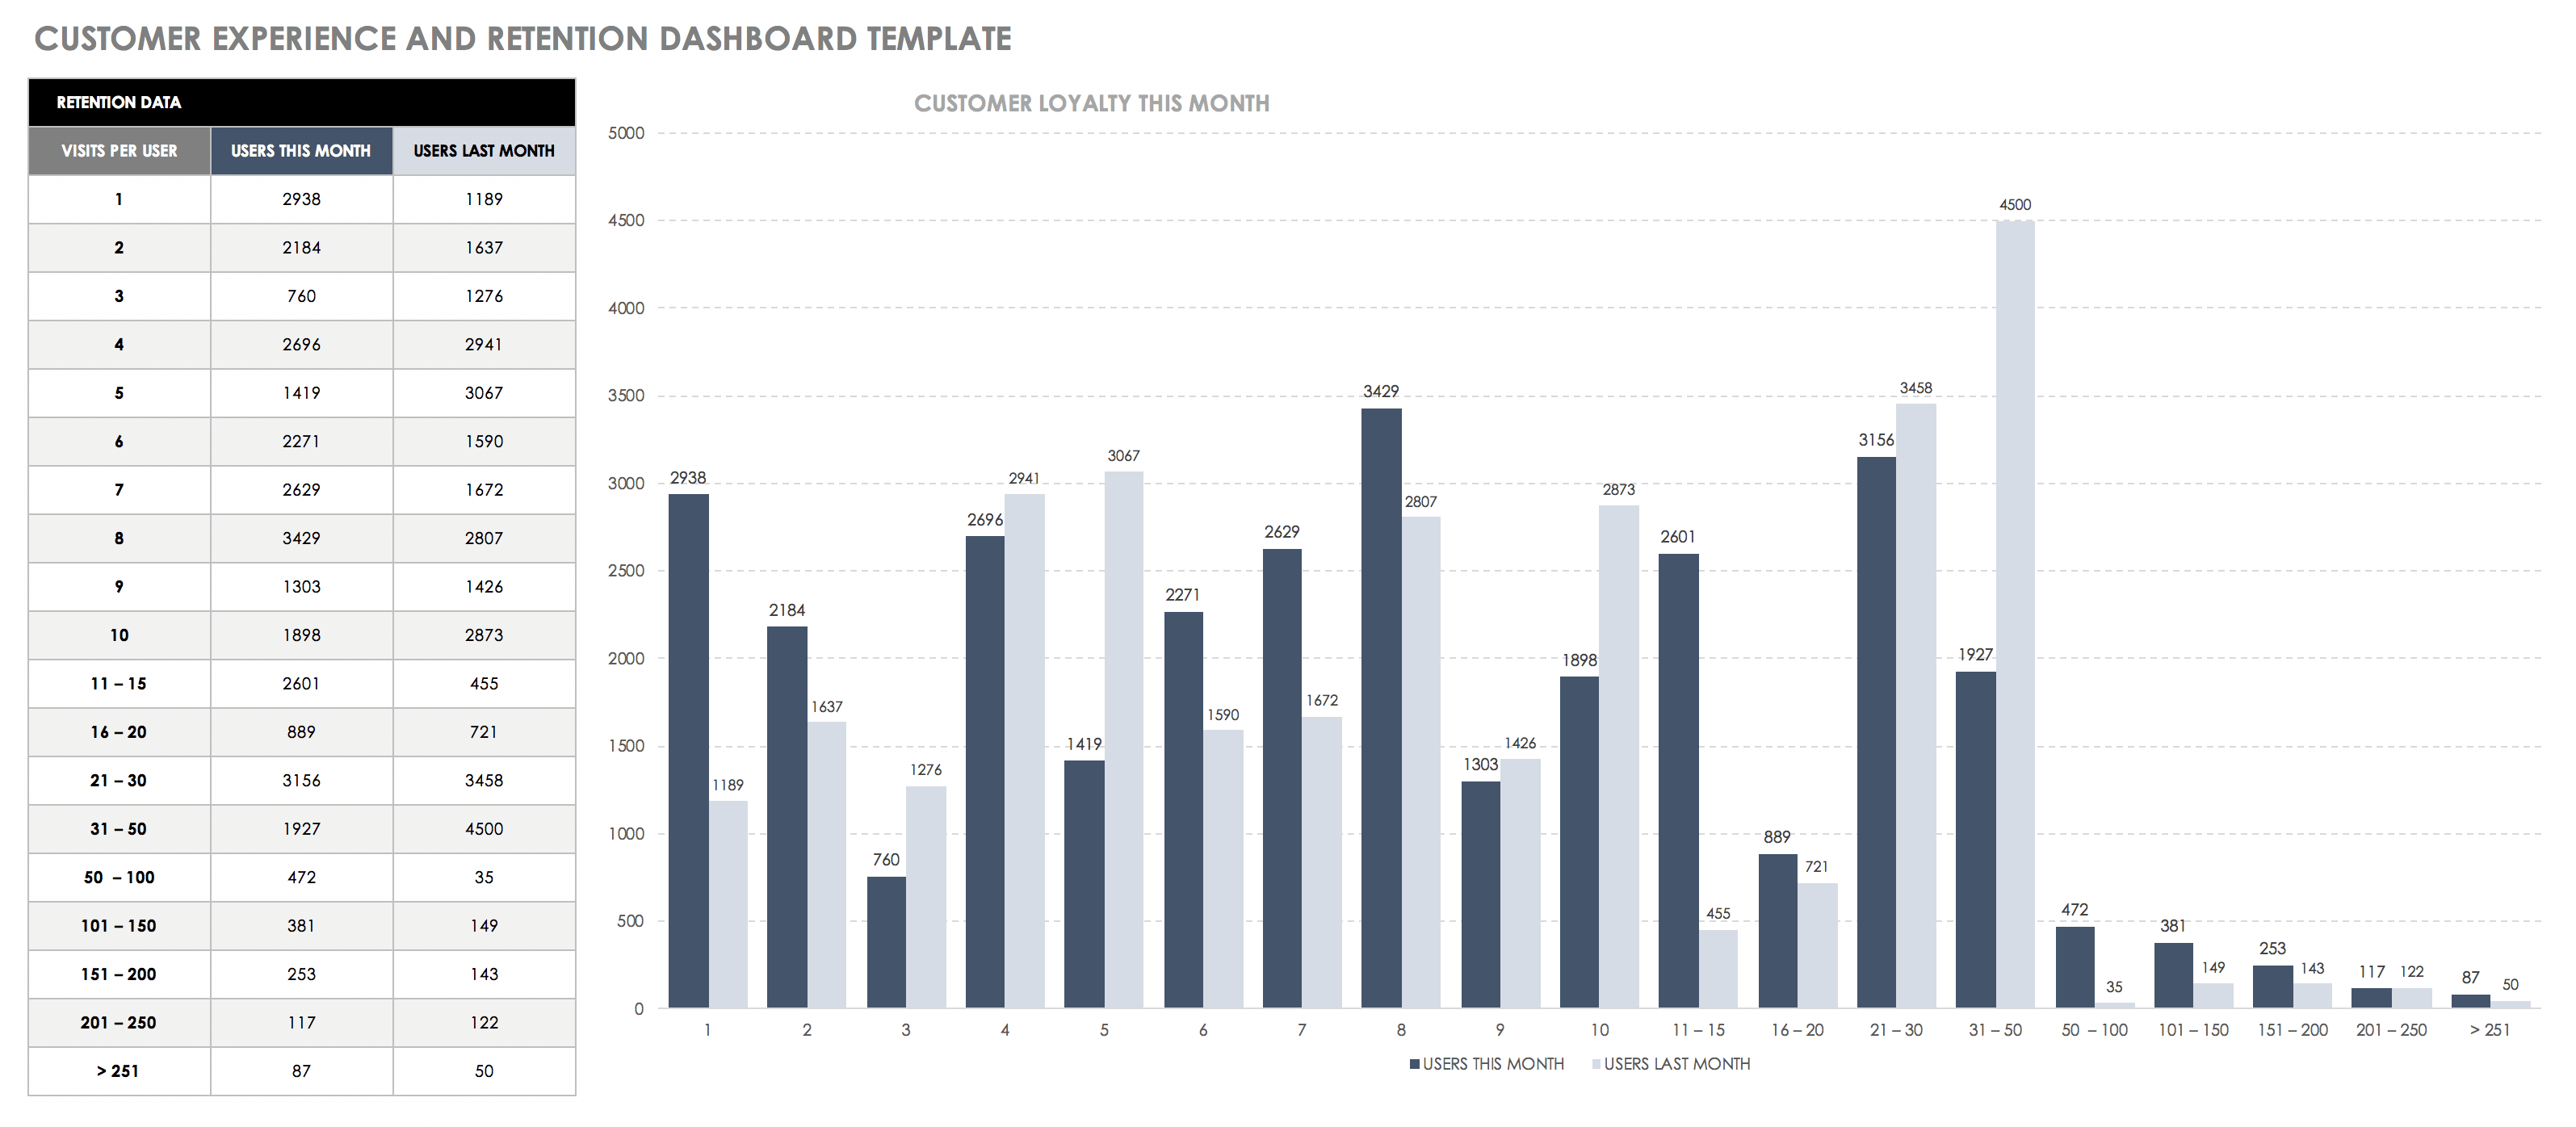
Customer Retention Template
This dashboard measures the number of repeat visits to your websites. It enables you to understand users and how they interact with your service or product. It also allows you to adjust messages and optimize your ROI.
Proven Success with CRM Dashboards: Use Cases
While working with an American Fortune 500 networking solutions giant, Keserwani and his team observed significant growth thanks to the use of CRM dashboards. “The company realized seven percent growth in customer satisfaction associated with e-renewals of software licenses and 11.3 percent growth in the conversion of leads coming from the agency channel,” he says. “We also prevented an estimated 13.5 percent of service tickets from escalating by employing a predictive analytics solution that would predict tickets most likely to escalate.”
He adds, “While working at a large bank in South Africa, we used Microsoft Dynamics CRM. The CRM dashboard helped us enhance the one-call-closure activation rate by 61 percent, reduce customer complaints by eight percent in the first quarter, improve cross-sell volume by four percent, five-and-a-half percent and seven percent in the next three quarters respectively, and upsell 31 percent of the tickets.”
Make Better Decisions, Faster with CRM Dashboards in Smartsheet
Empower your people to go above and beyond with a flexible platform designed to match the needs of your team — and adapt as those needs change.
The Smartsheet platform makes it easy to plan, capture, manage, and report on work from anywhere, helping your team be more effective and get more done. Report on key metrics and get real-time visibility into work as it happens with roll-up reports, dashboards, and automated workflows built to keep your team connected and informed.
When teams have clarity into the work getting done, there’s no telling how much more they can accomplish in the same amount of time. Try Smartsheet for free, today.


