How to Make a Project Schedule in Excel Using a Template
Use a project schedule template in Excel to organize tasks, set timelines, and view task durations in a color-coded bar chart. A template saves time and effort.
Follow the steps below to use an Excel project schedule template that keeps your project on track.
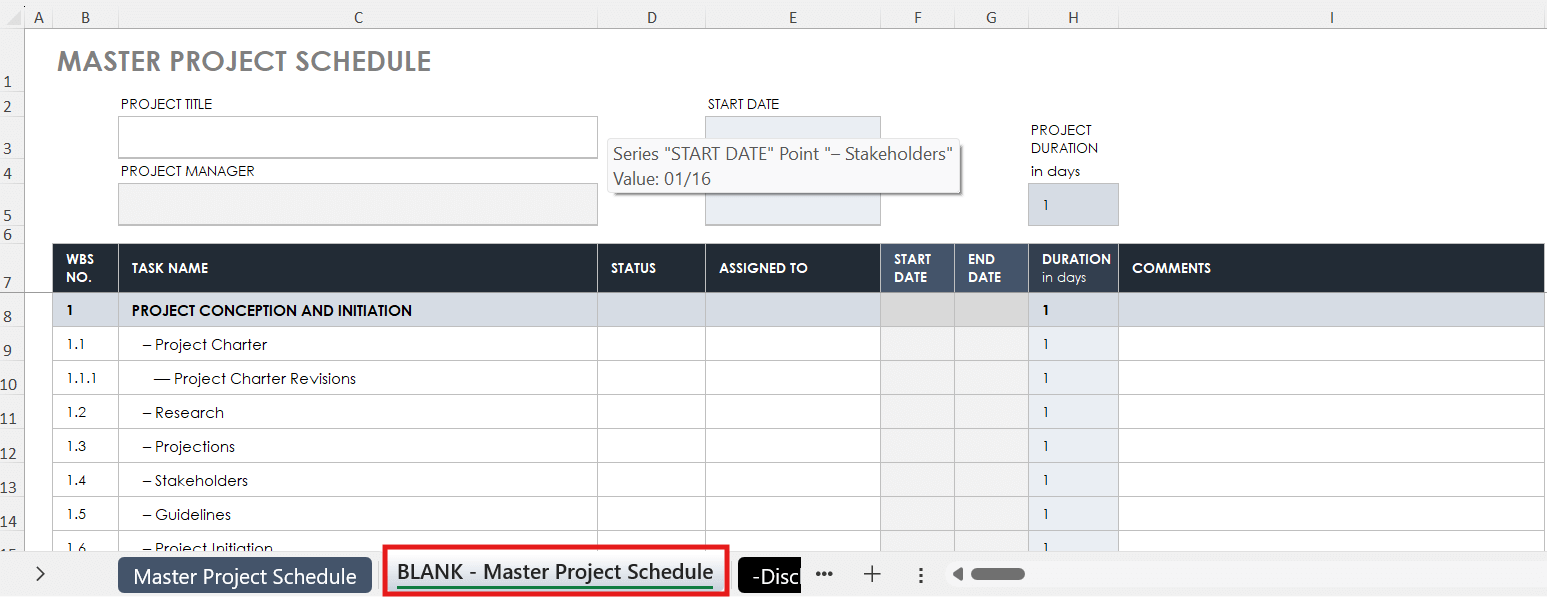
- Download the
master project schedule template
, and save it. Click the BLANK - Master Project Schedule tab to enter project-specific data.
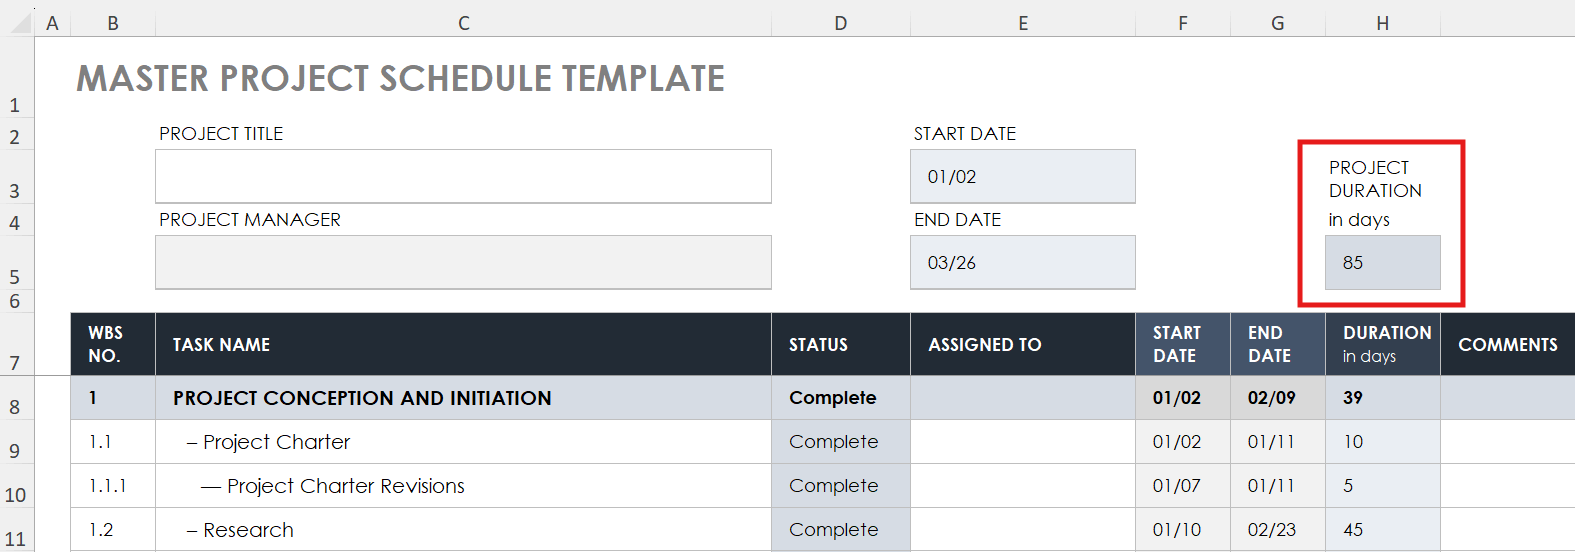
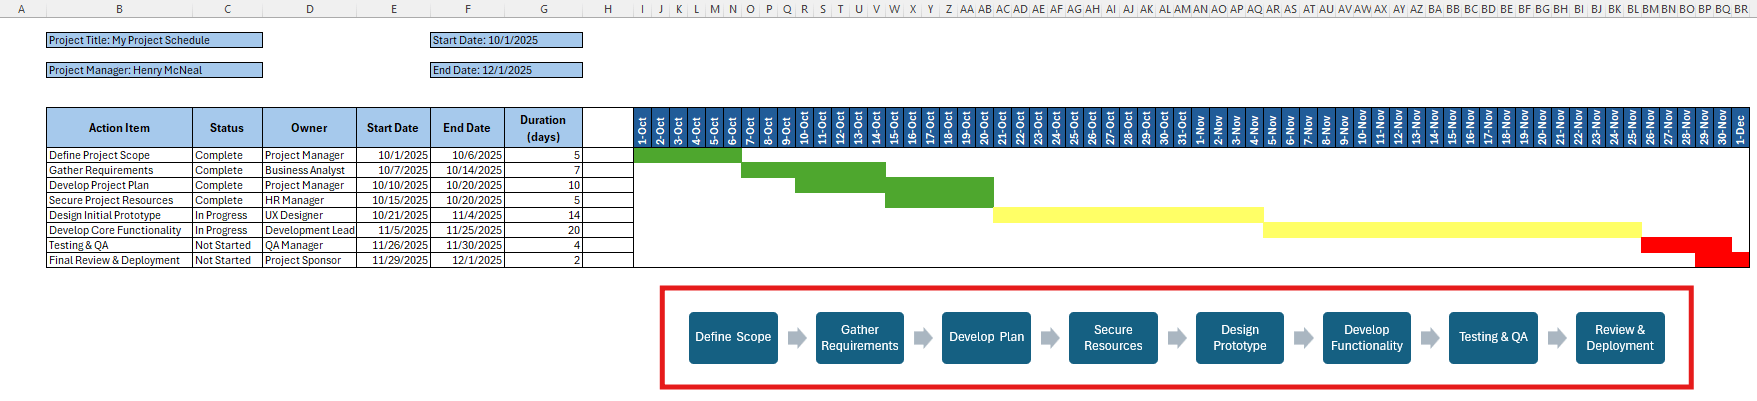
- Enter the project title, project manager, start date, and end date.
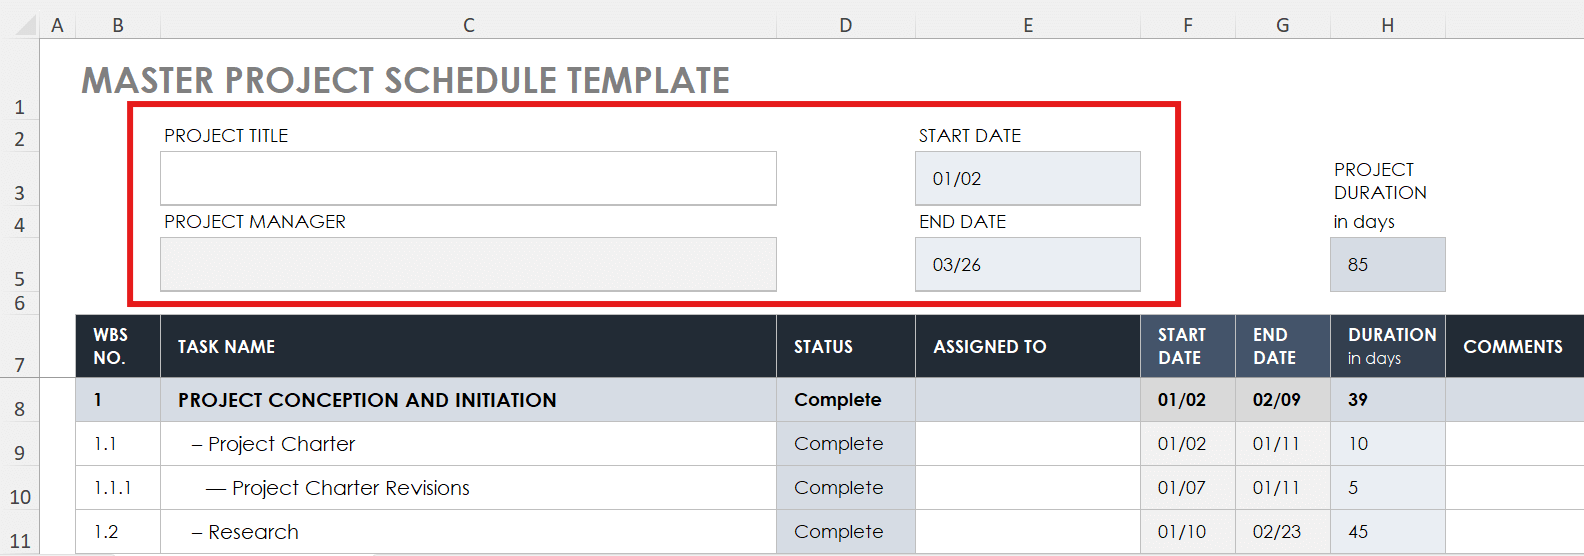
The Project Duration in days field auto-populates based on the start and end dates.
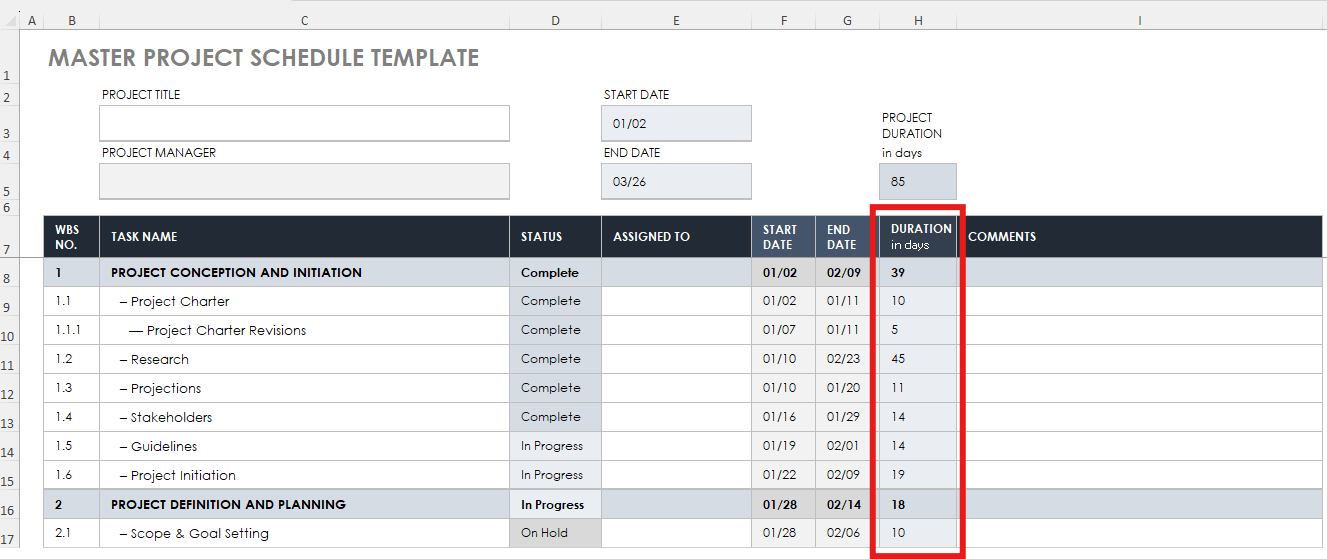
- Enter each task’s work breakdown structure (WBS) number, name, assignee, and start and end date.
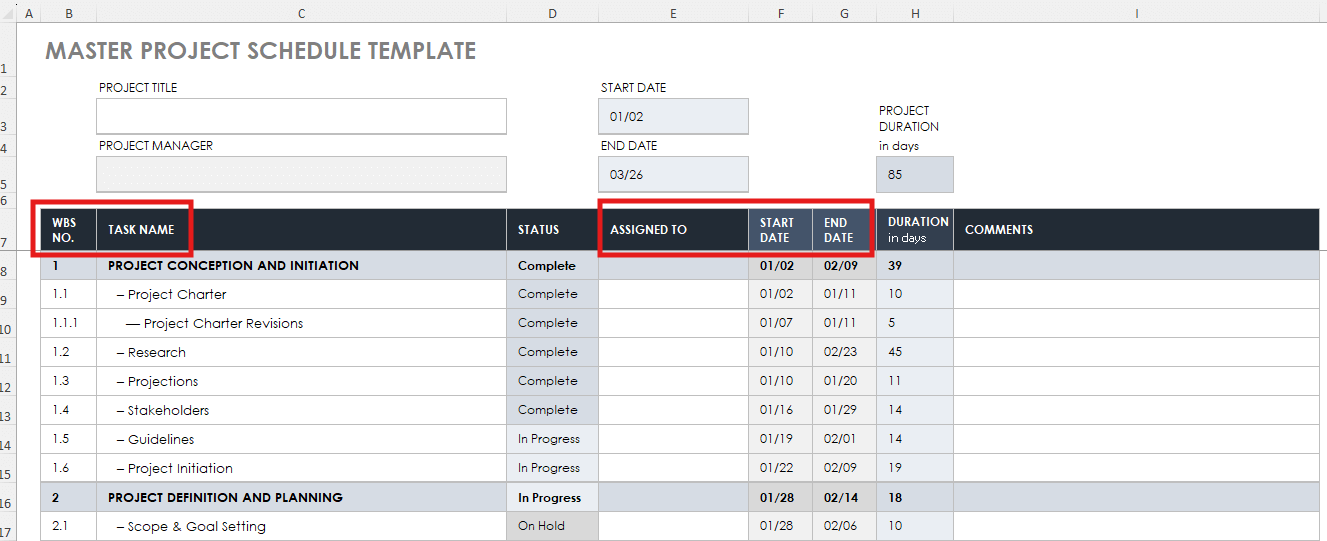
The Duration in days column auto-populates based on each task’s start and end date.
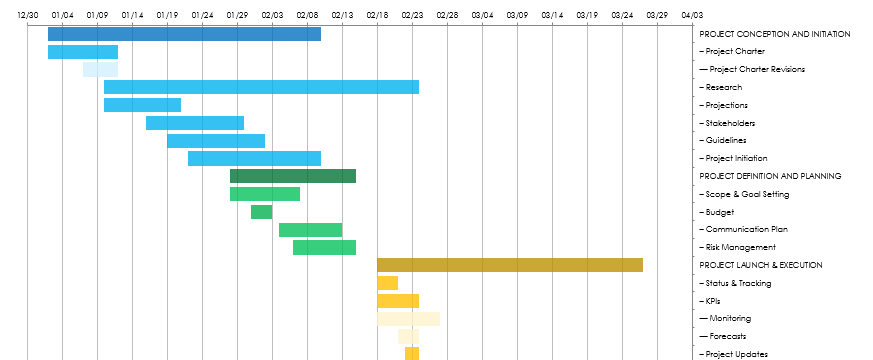
The color-coded bar chart auto-populates duration bars for each task.
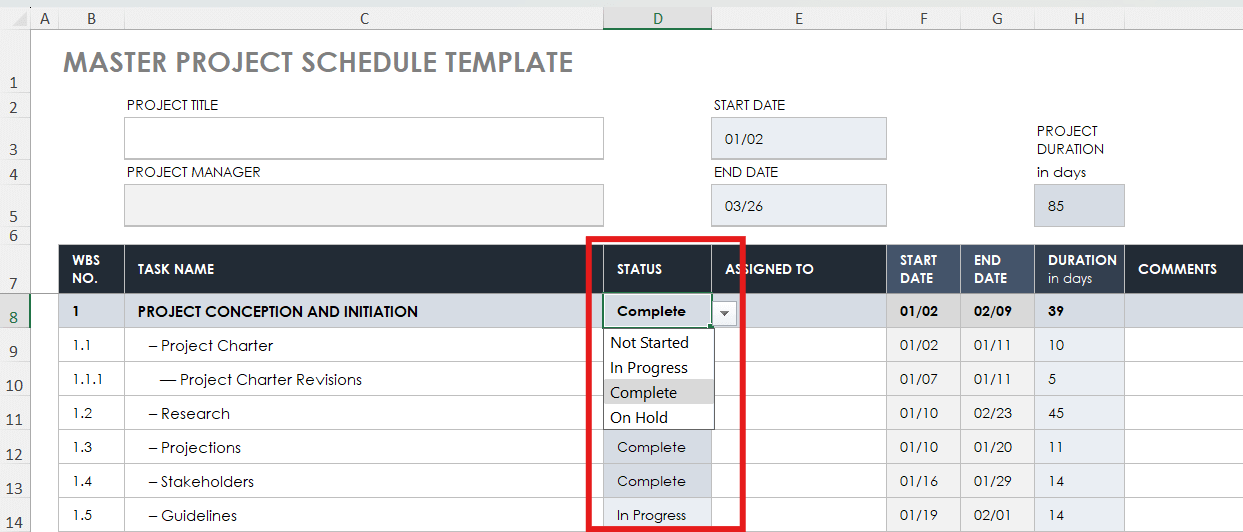
- Use the drop-down in the Status column to select each task’s status.
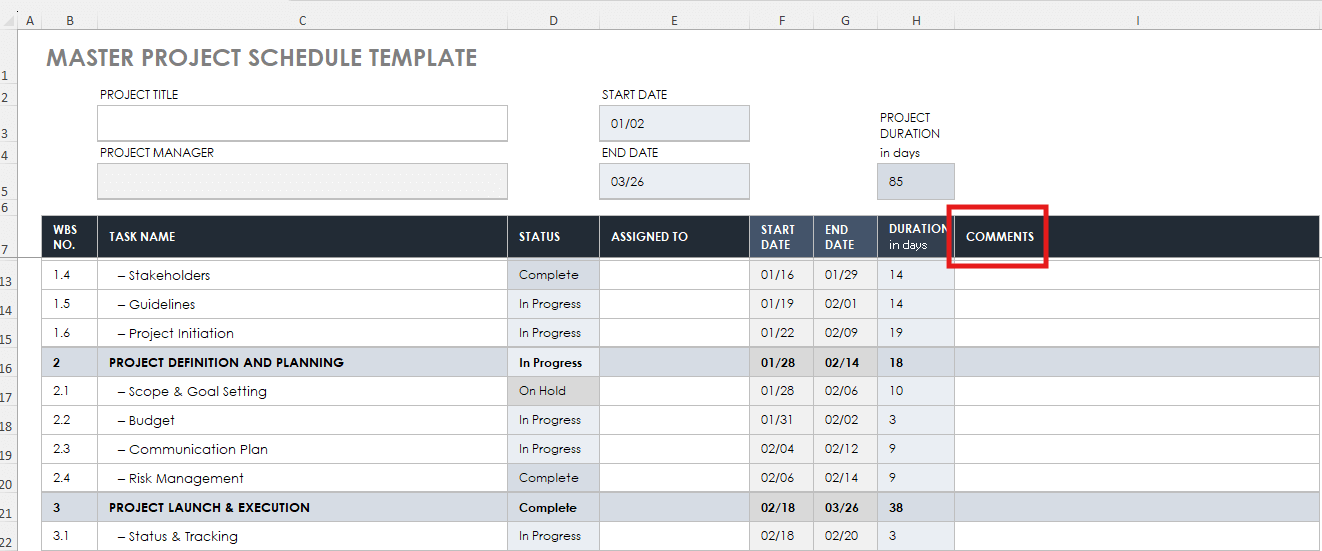
- Enter comments if you need to include additional information.
Check out the definitive guide to project scheduling to learn the benefits of an efficient schedule and best practices. Find a variety of project schedule templates in different formats to jump-start any project.
How to Make a Project Schedule in Excel From Scratch
You can create a project schedule in Excel using columns to organize project tasks and their timelines. Once you add data to the columns, build formulas to create a bar chart to track progress.
Follow the steps below to design a customized project schedule and the accompanying bar chart.
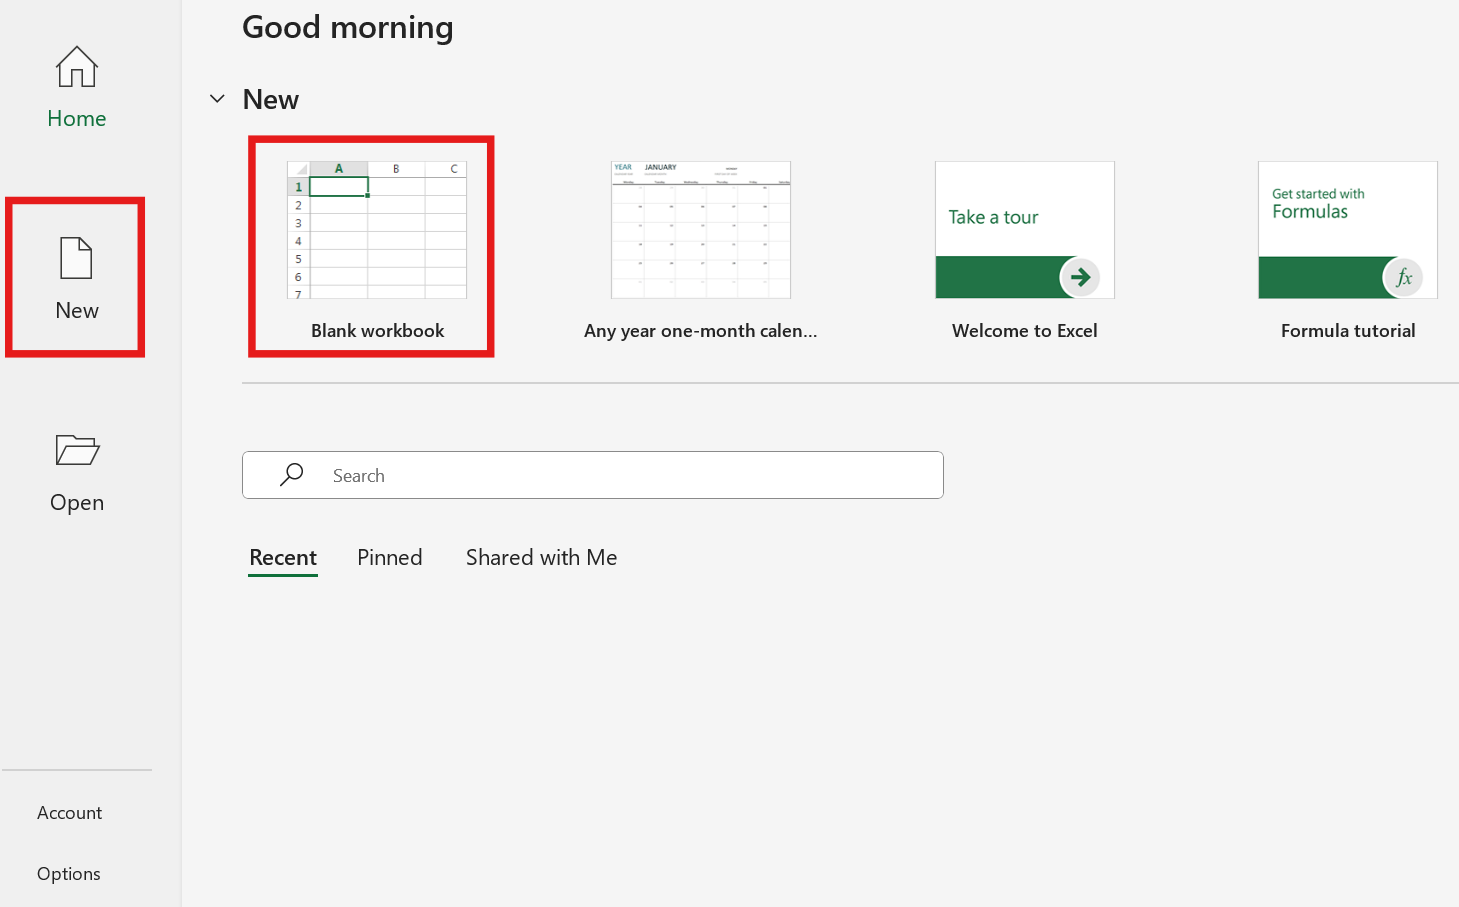
- Open Excel and click New > Blank workbook.
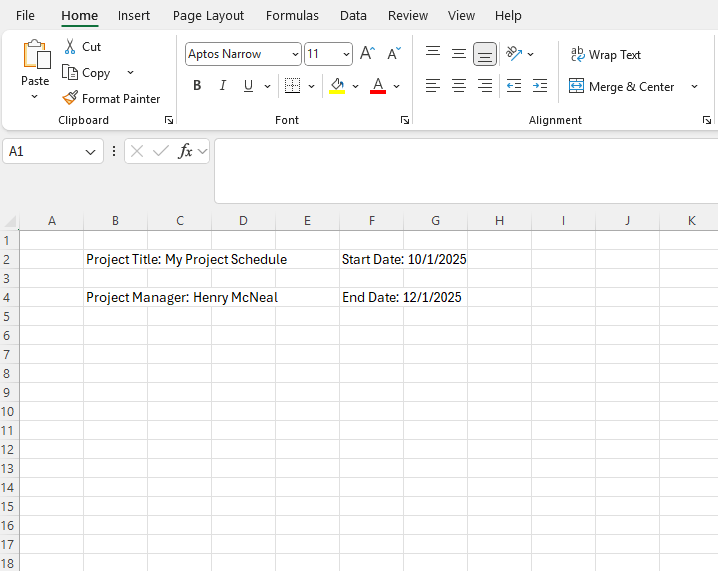
- Enter the project title, project manager, start date, and end date to add key project details.
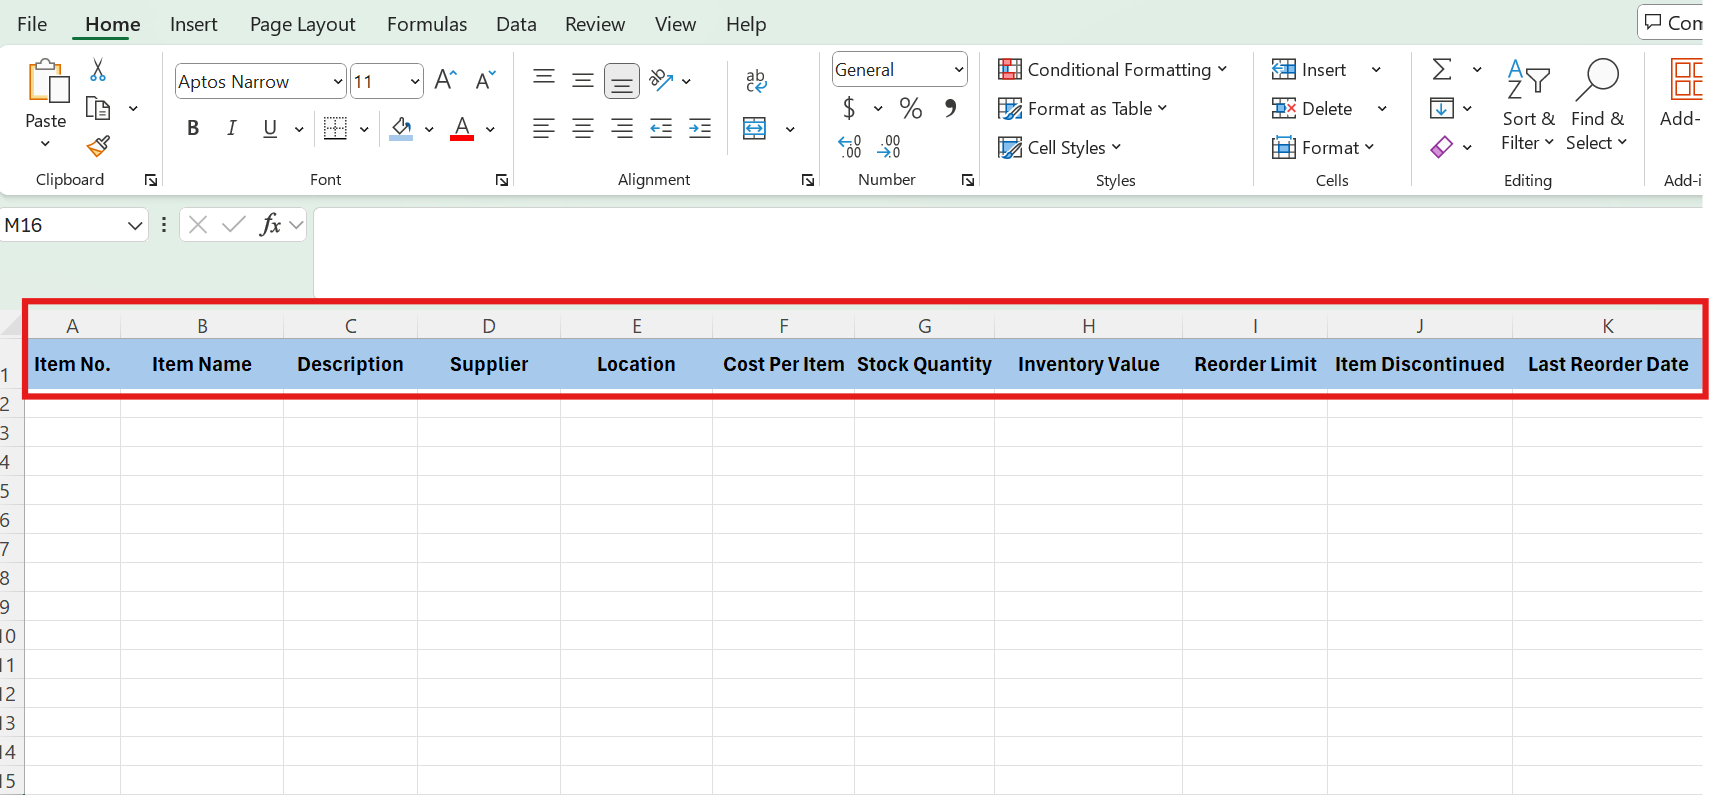
- Enter column headers, including Action Item, Status, Owner, Start Date, End Date, and Duration (days). Adjust column widths so that each header is completely visible.
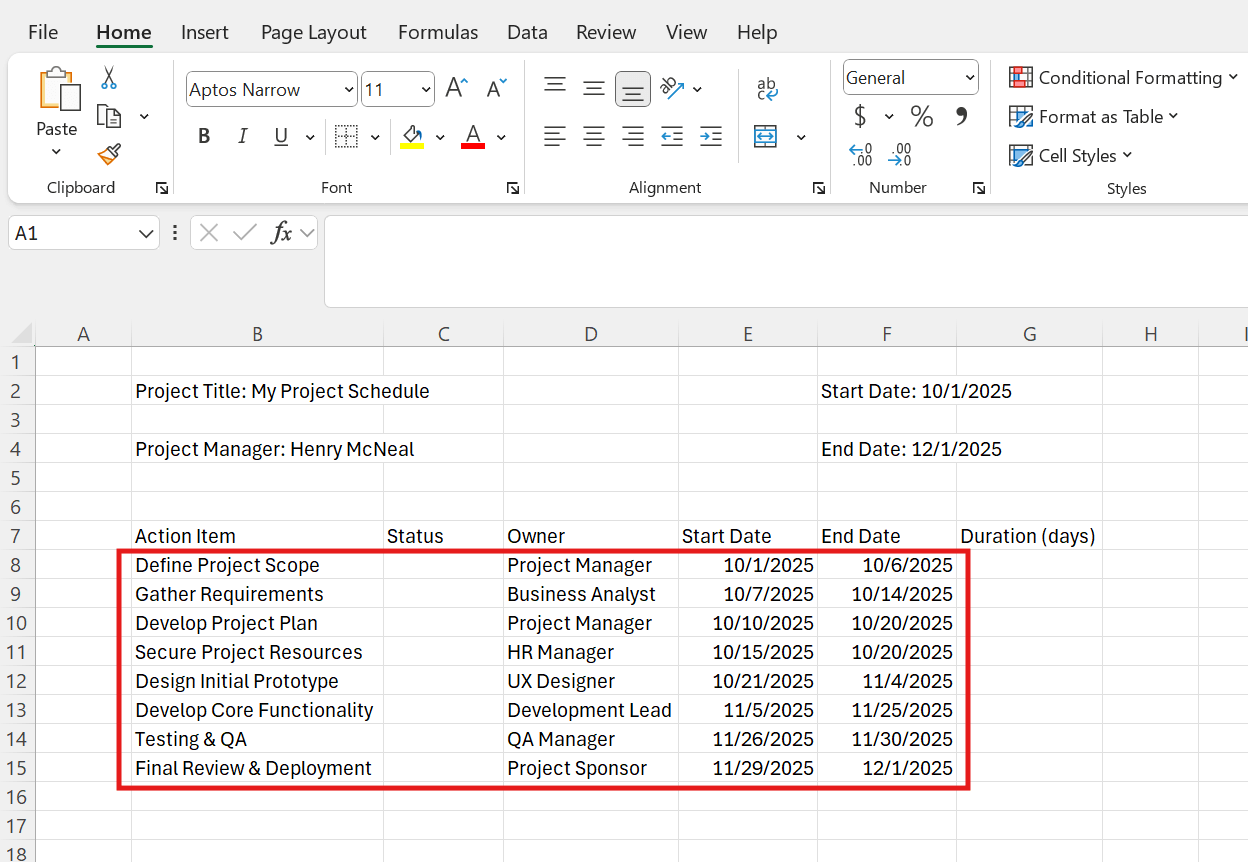
- Enter the project action items (tasks, deliverables, and milestones), owners, and start and end dates in the following rows.
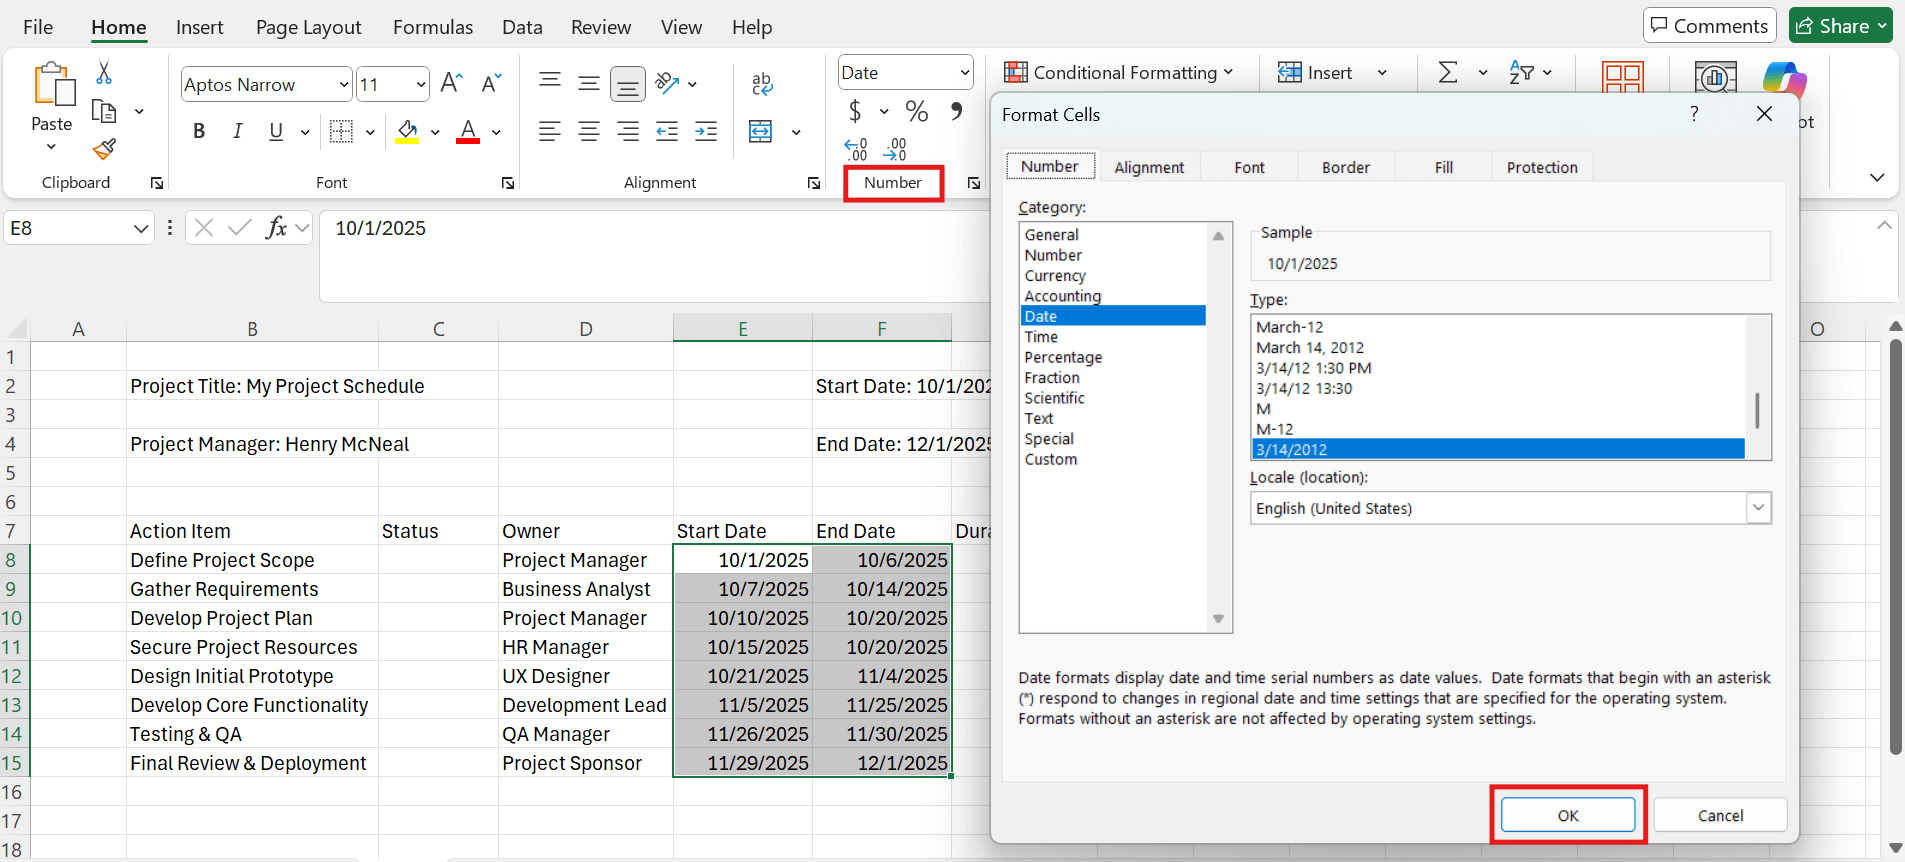
- Format your start and end date columns so that they are consistent and readable. Highlight the dates in the Start Date and End Date columns. From the Home tab, click Number, then Date under Category. Click any date type, then OK.
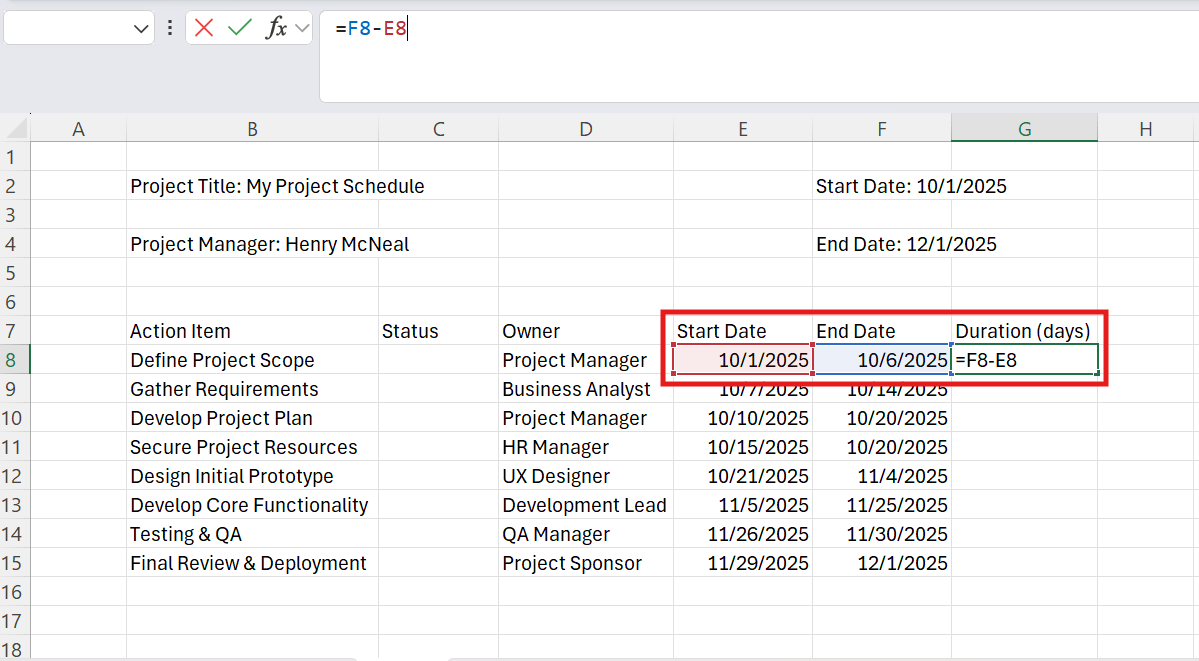
- In the Duration column, enter a formula that auto-calculates the duration in days. In the first cell under Duration (days), enter a formula that subtracts the start date from the end date. In the example below, the formula is =F8-E8.
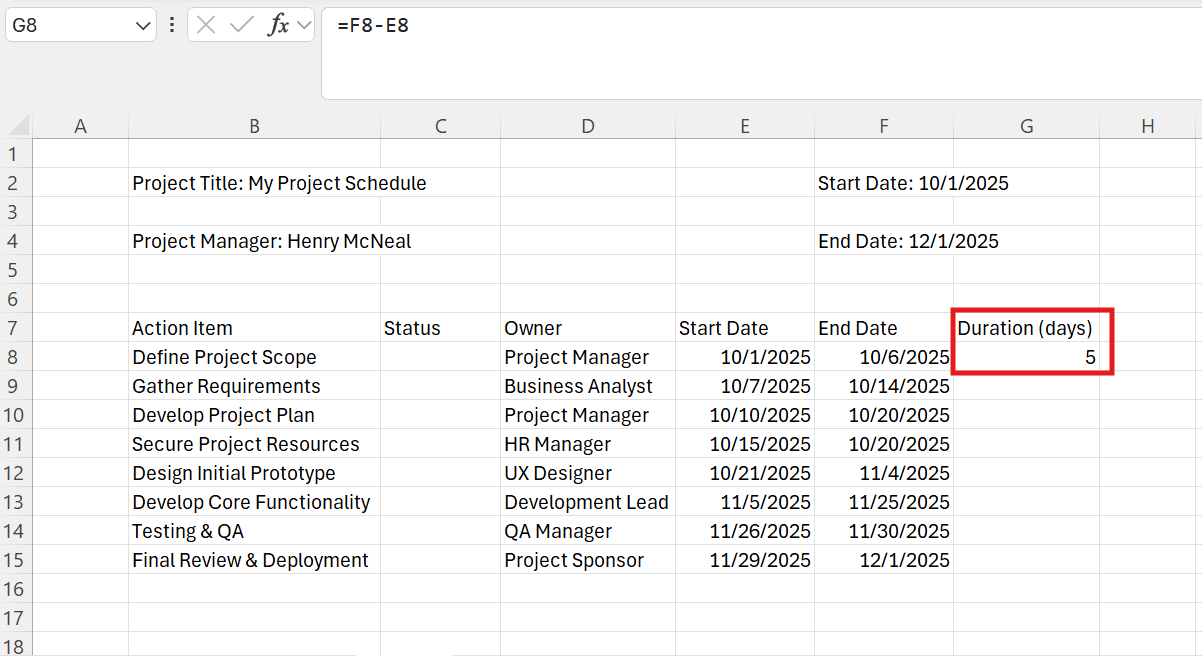
Press Enter to see the duration calculation in the corresponding cell.
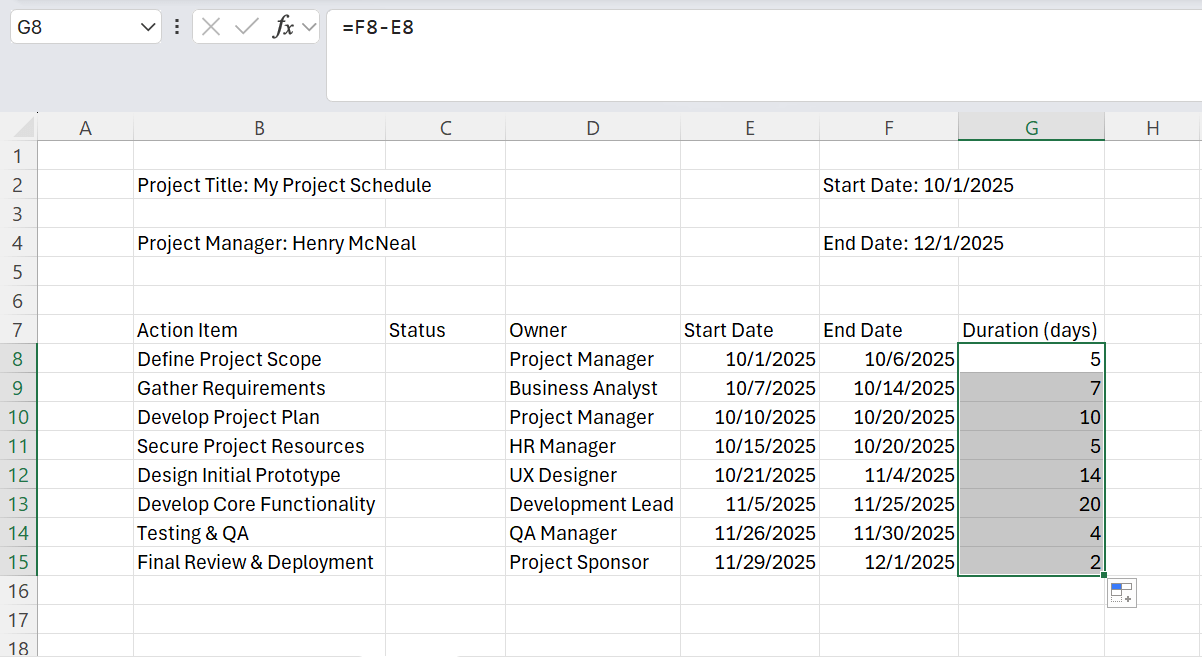
Click on the cell, click the green square in the lower-right corner of the cell, and drag the formula down the column to apply it to all the rows.
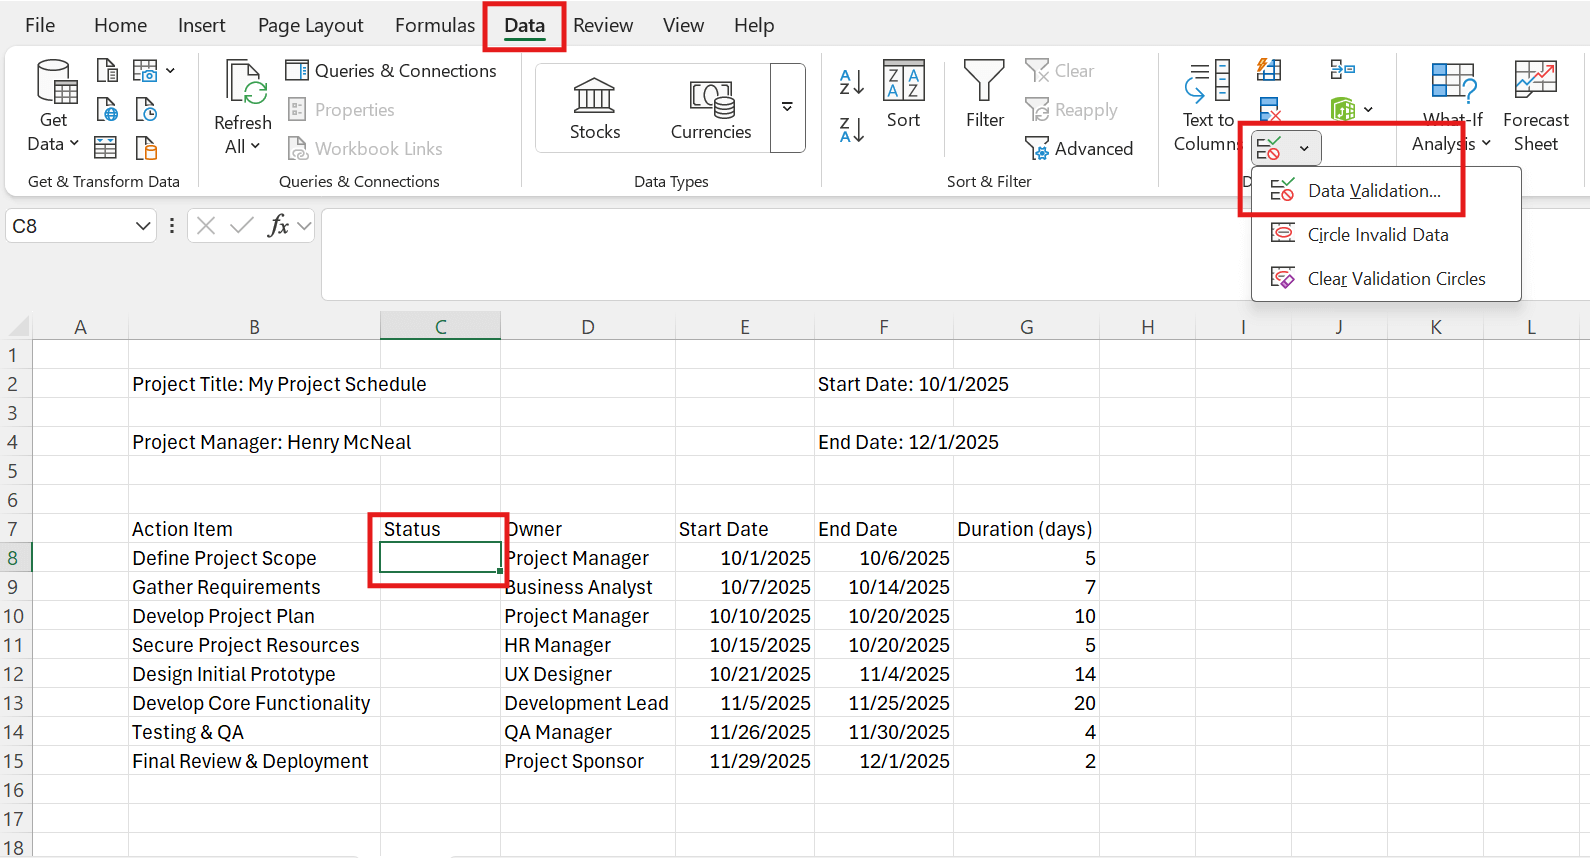
- Click the first cell under Status to add a drop-down menu. Click the Data tab > Data Tools > Data Validation.
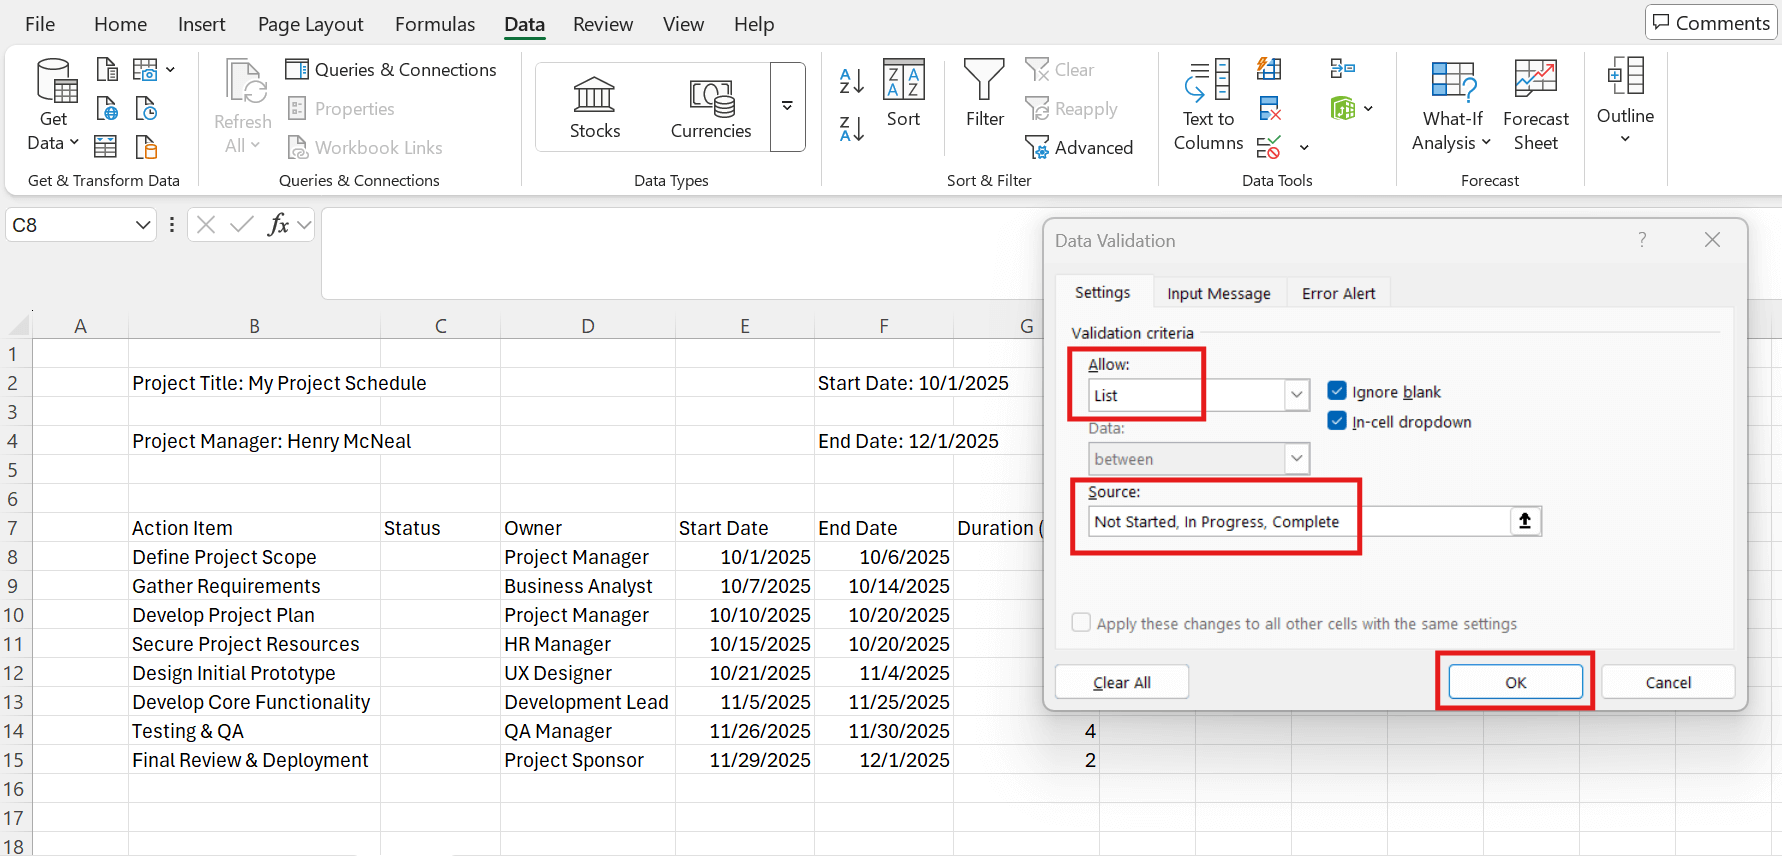
Use the drop-down in the Allow: menu and click List. In the Source: menu, enter Not Started, In Progress, Complete. Make sure the source list is separated by commas. Click OK.
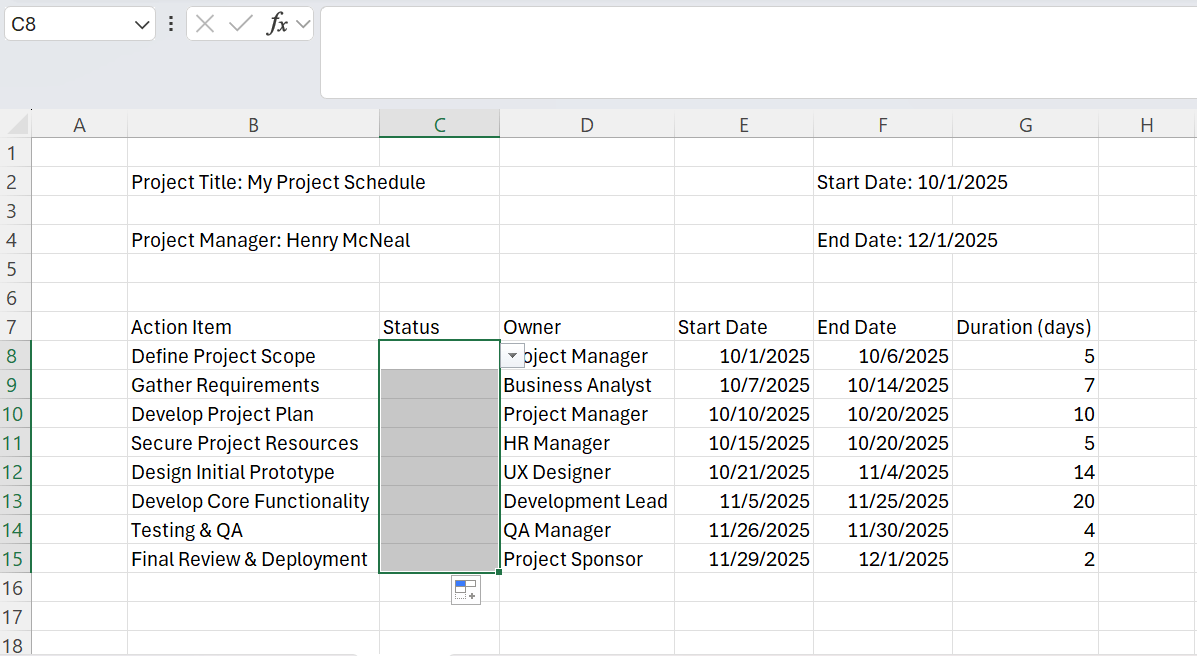
Click on the cell that has the drop-down menu option, click the green square in the lower-right corner of the cell, and drag the data validation down the column to apply it to all the rows.
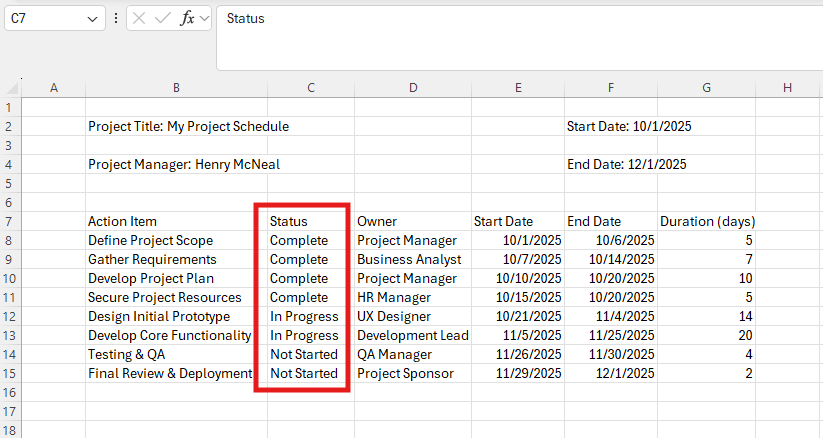
Use the drop-down to enter a status for each action item.
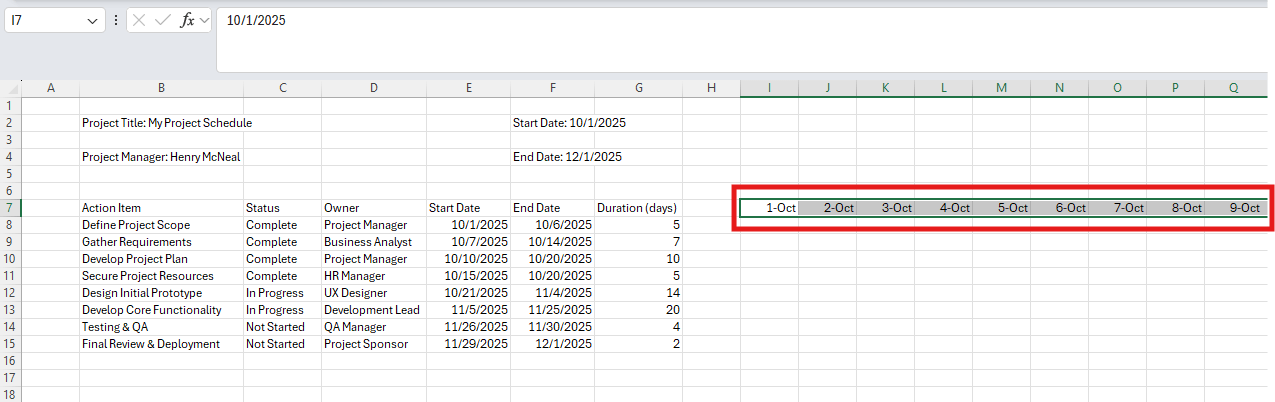
- Enter the project’s start date to the right of the Duration (days) column. Click the cell, and from the bottom-right corner, drag your cursor to the end date to add a timeline.
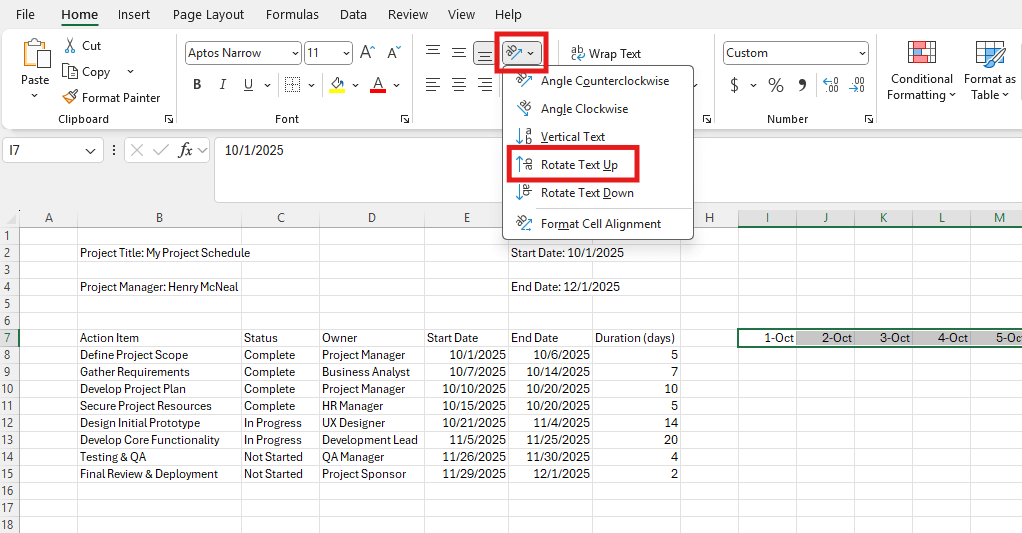
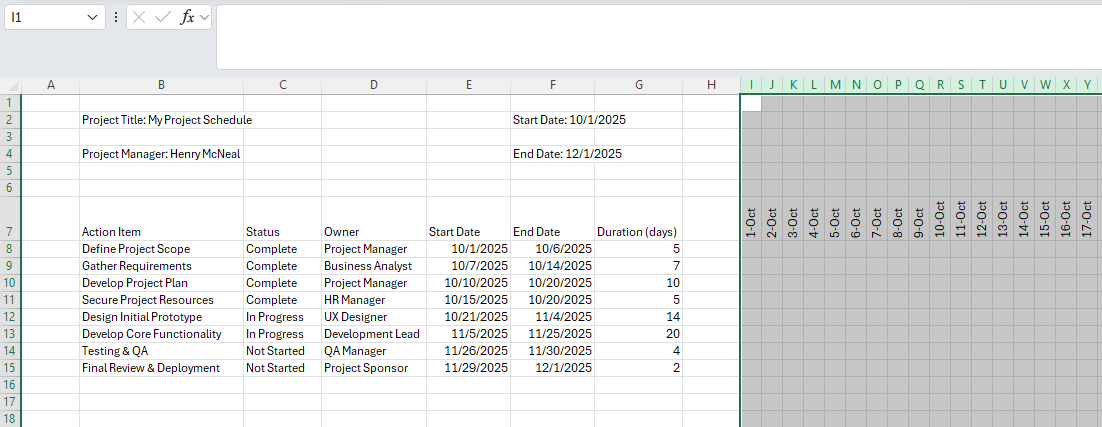
To change the dates orientation to vertical, highlight the dates, click the orientation icon on the Home tab, and click Rotate Text Up.
Adjust the width of the timeline date columns by highlighting them and decreasing their width to create a more compact view.
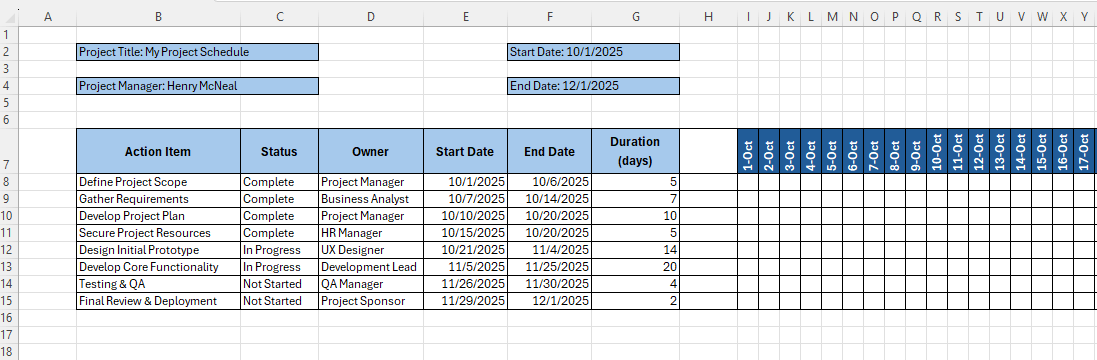
- Click the project title cell, click the border icon to add a border. Click the fill color icon, and pick a color for the background. Use the corresponding icons to adjust the font, and align the cell text to create a customized appearance.
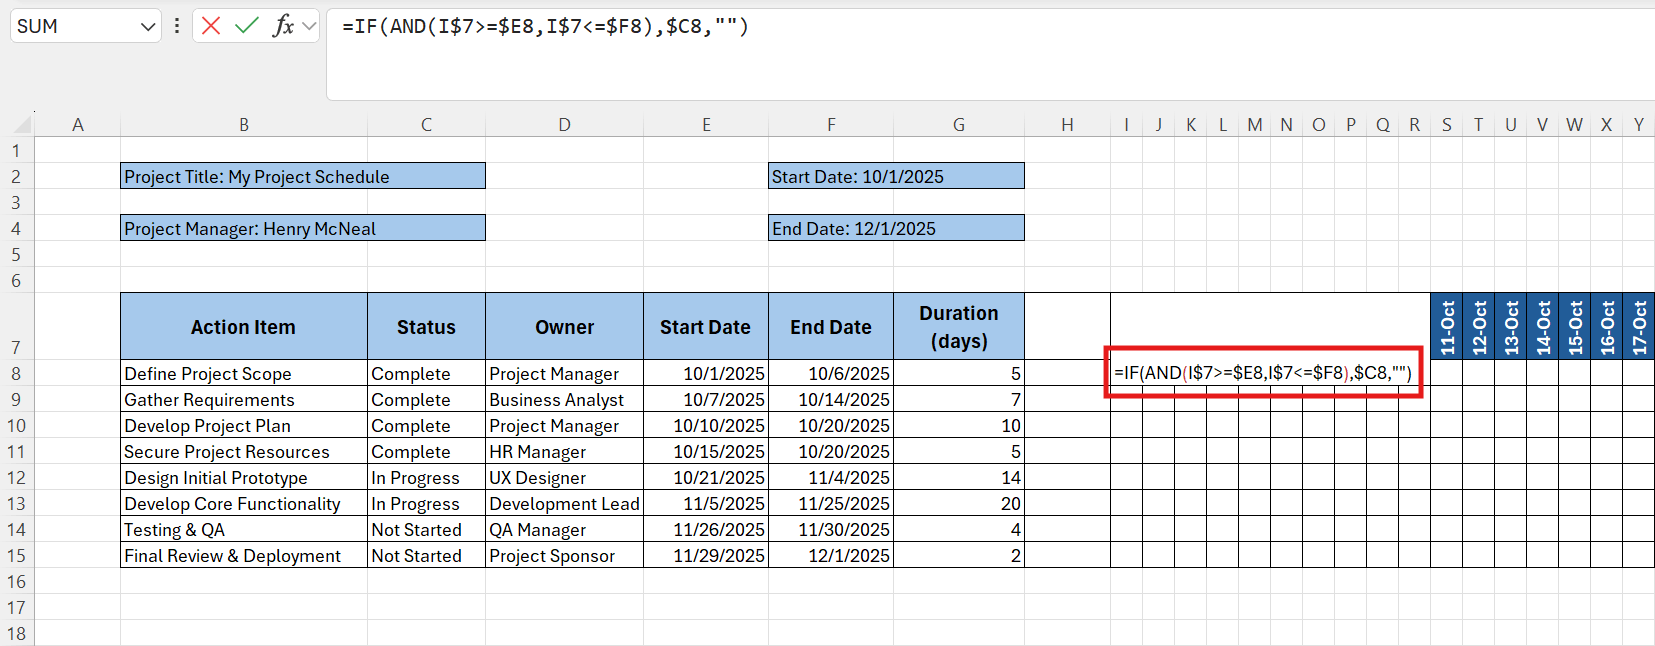
- Click on a timeline cell and use the IF AND formula to populate duration bars. The formula creates a duration based on the action item’s start date, end date, and status. In the example below, the formula is =IF(AND(I$7>=$E8,I$7<=$F8),$C8,""). If start dates, end dates, or statuses change, the duration bars also change, making this a dynamic element.
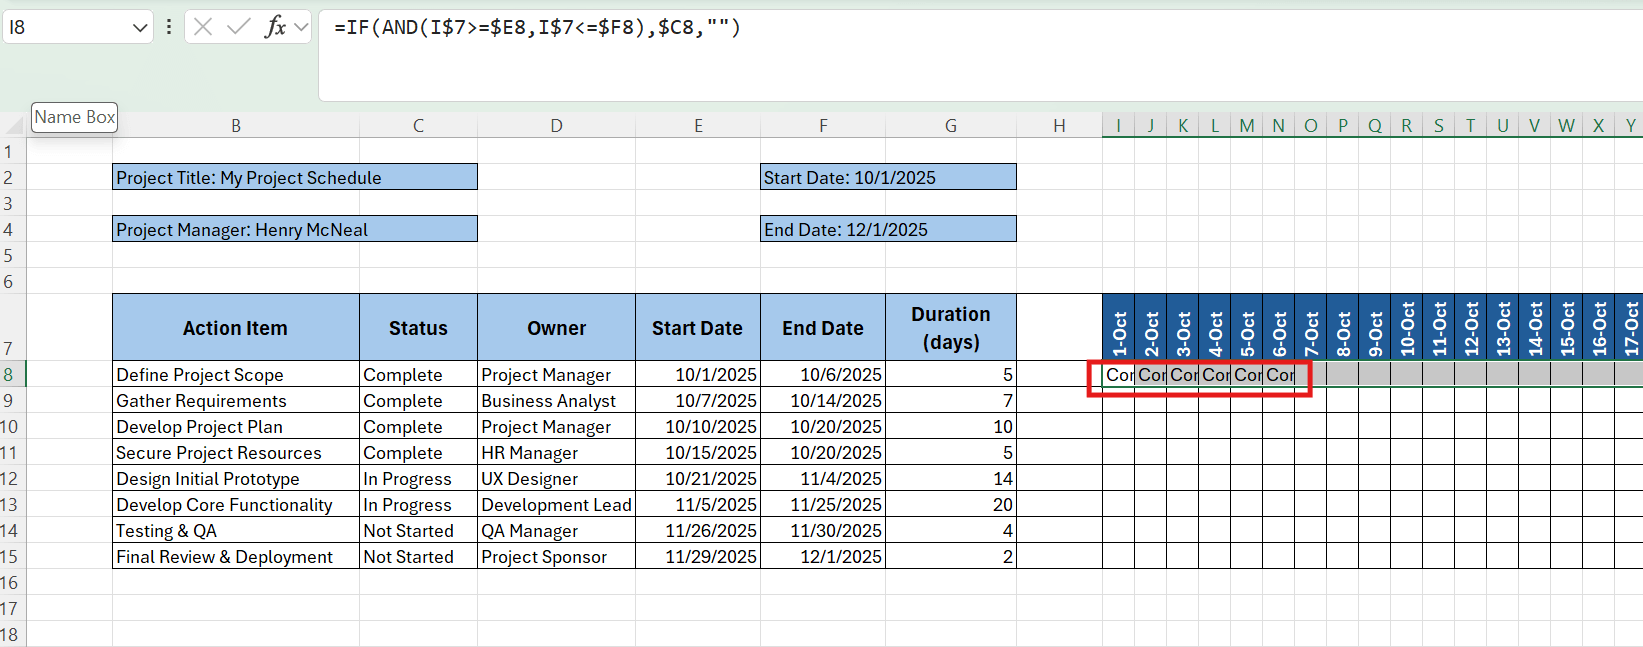
Click on the green corner in the lower-right corner of the cell with the formula and drag it to the end of the timeline. The action item’s status will apply to each cell of the task’s duration.
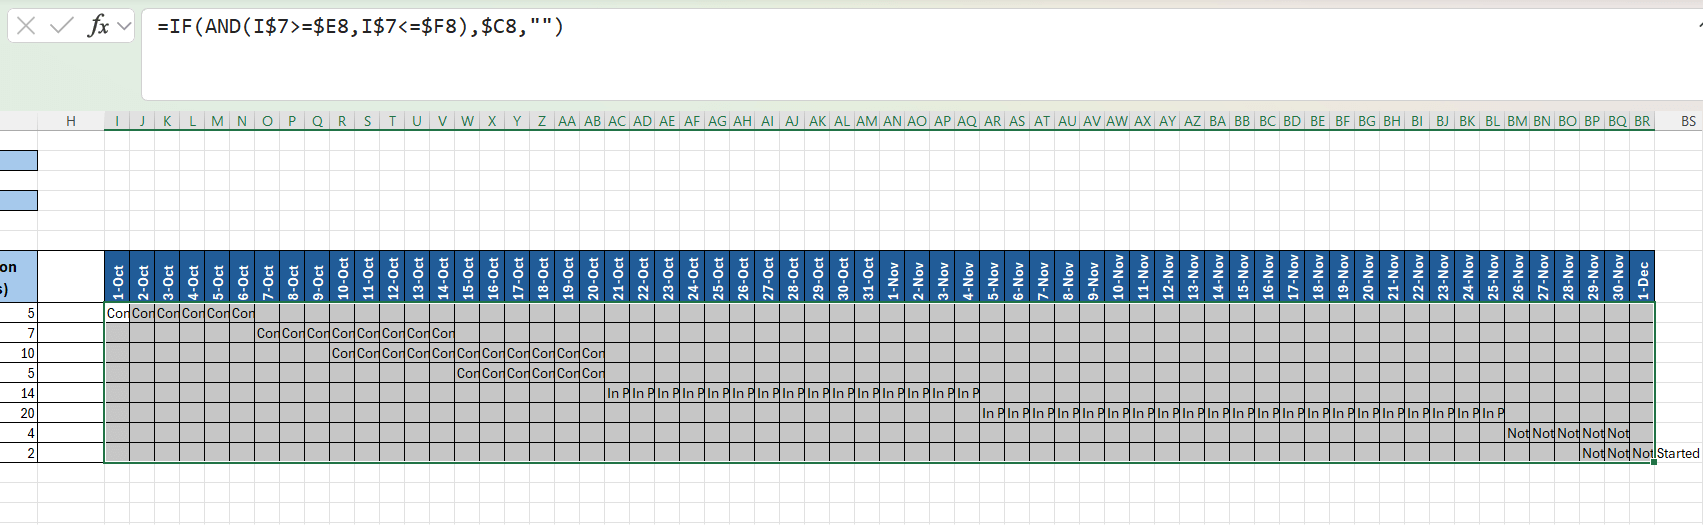
Click the first cell under the timeline’s last date. In the example below, it is Dec 1. Then drag the IF AND formula through the last row.
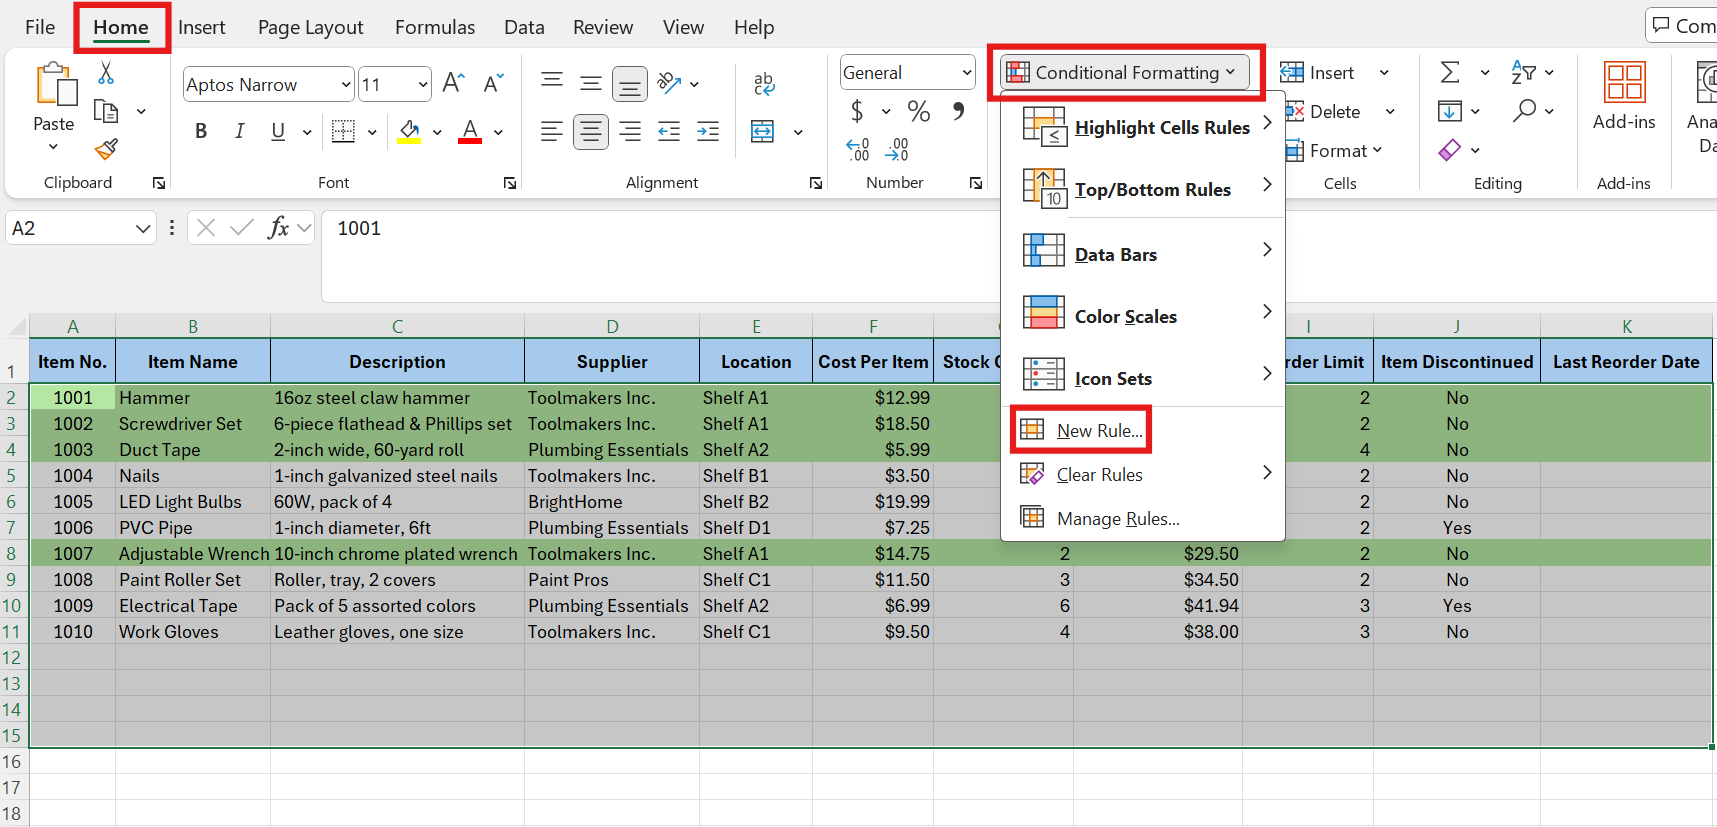
- Add rules that apply colors to duration bars based on status. Highlight the calendar, click Conditional Formatting > Highlight Cells Rules > Text that Contains.
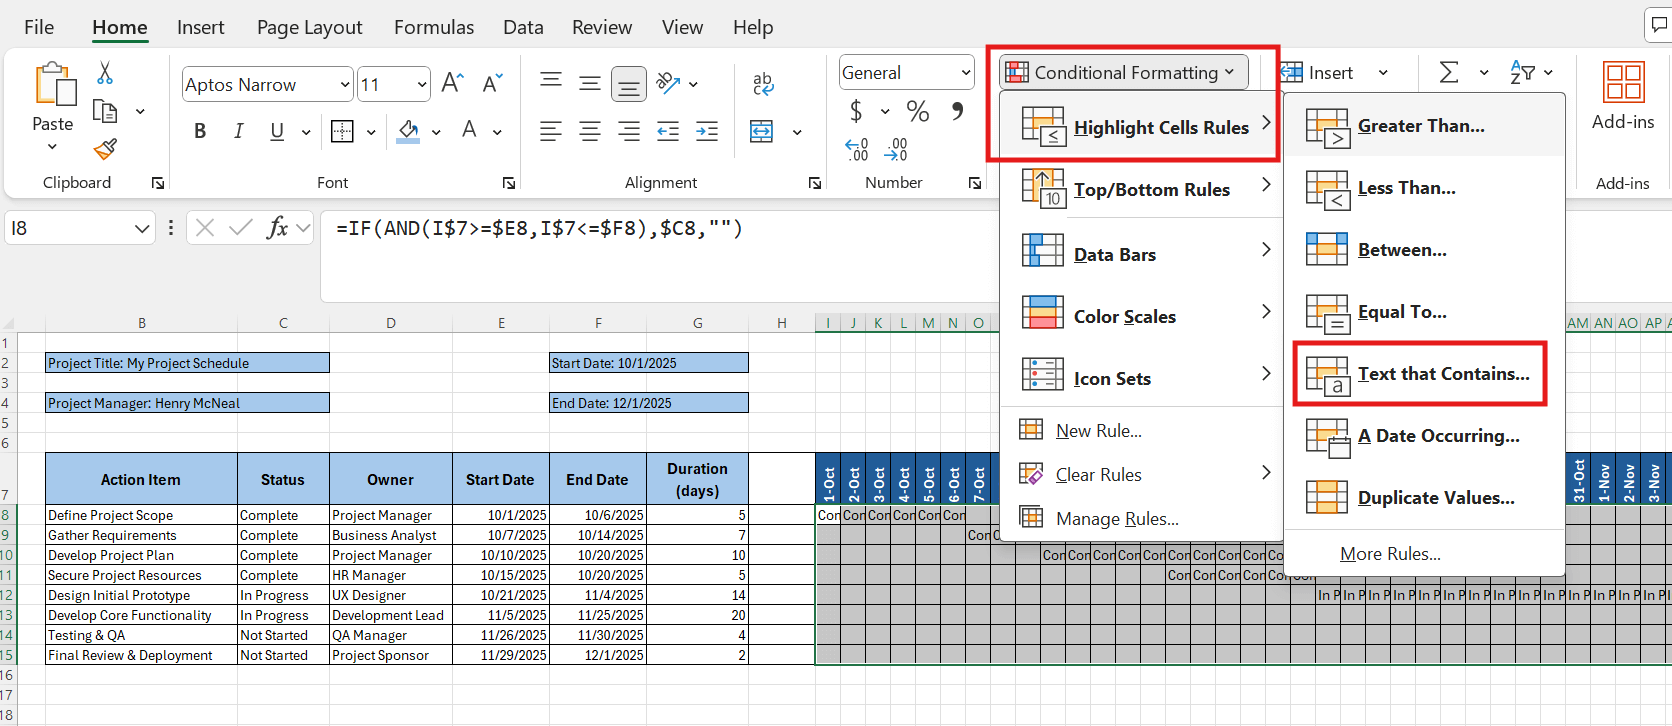
Enter Complete in the text field, and click Custom Format from the drop-down.
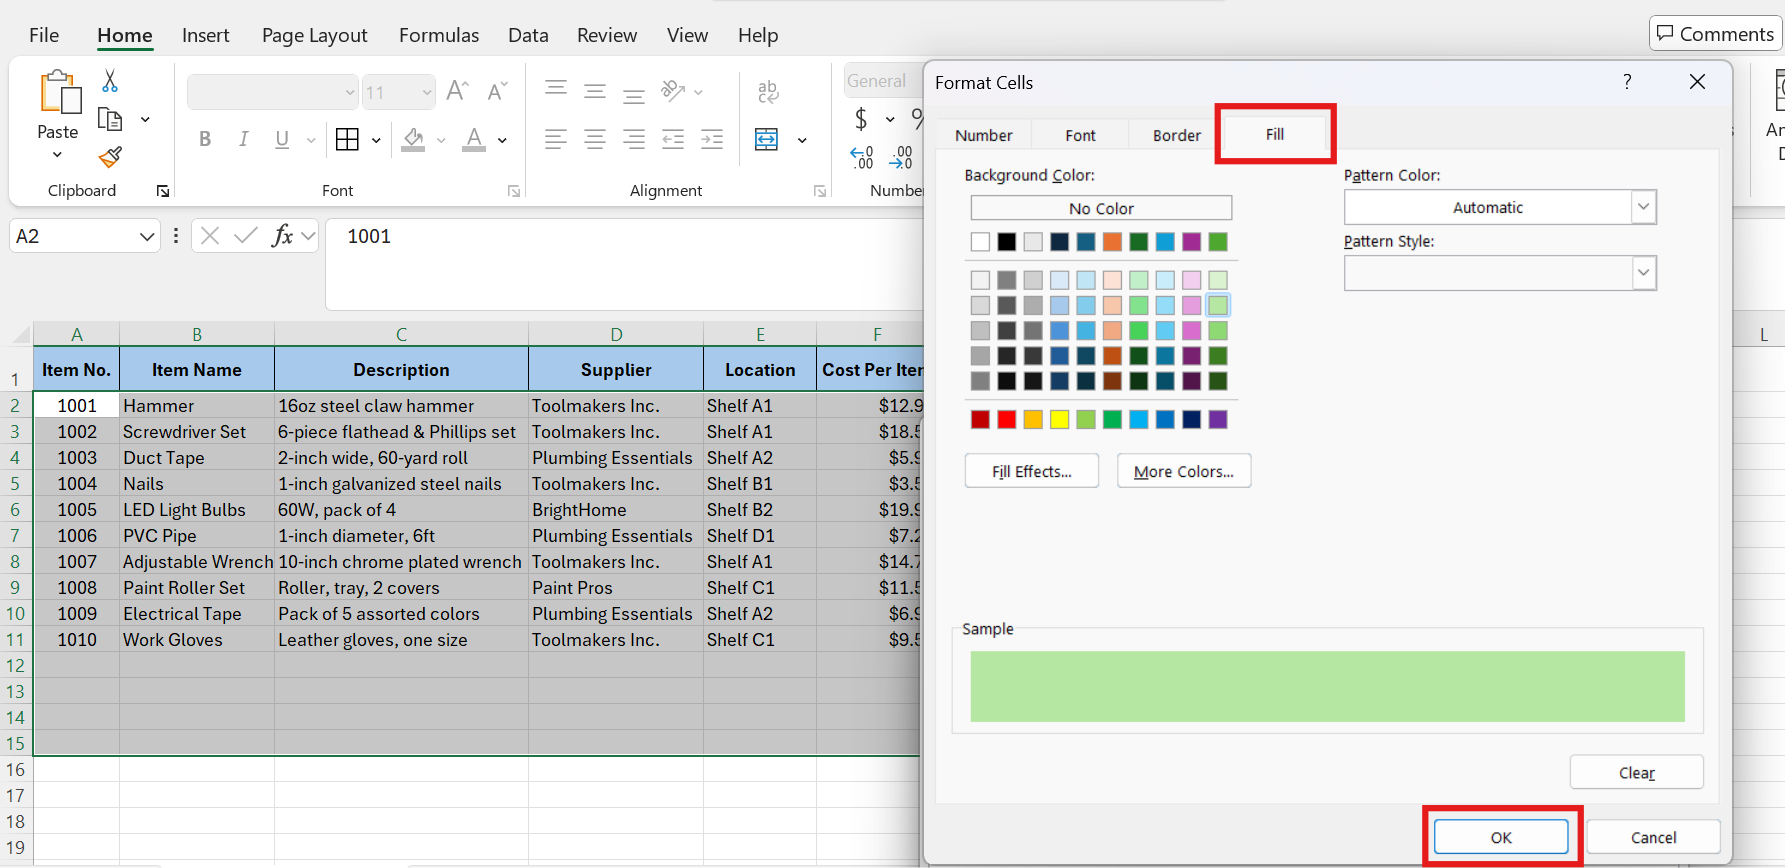
Choose a fill color, and click OK.
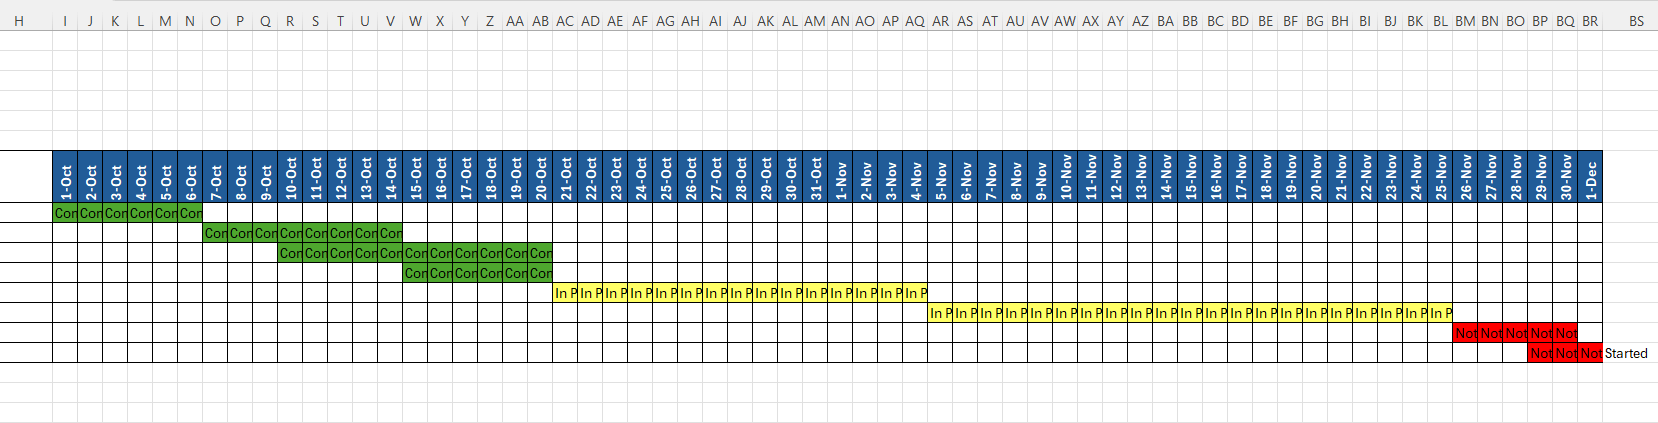
Repeat the conditional formatting steps for In Progress and Not Started, choosing different fill colors for each.
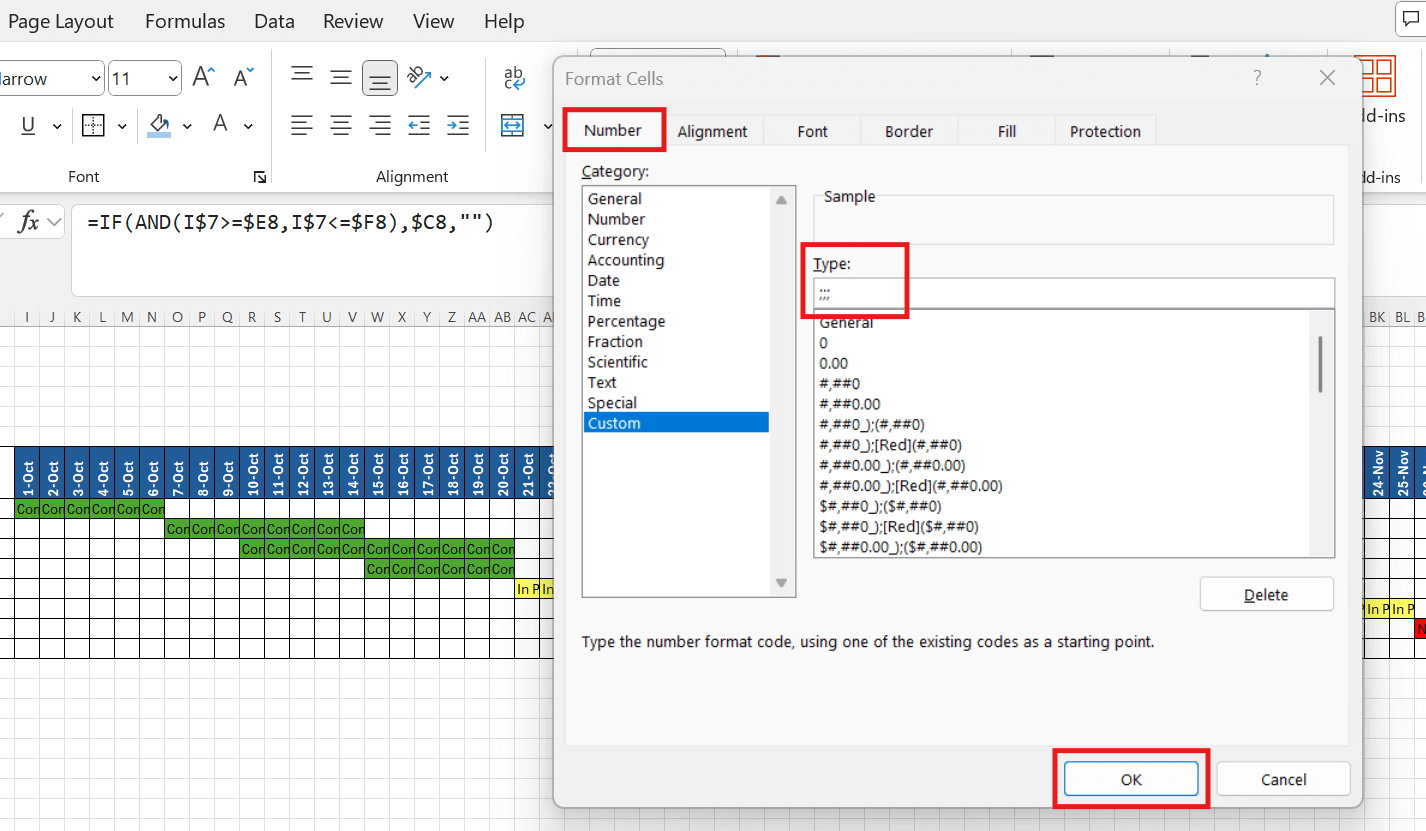
- To remove text from the duration bars on the calendar, highlight the entire calendar. Click Format > Format Cells.
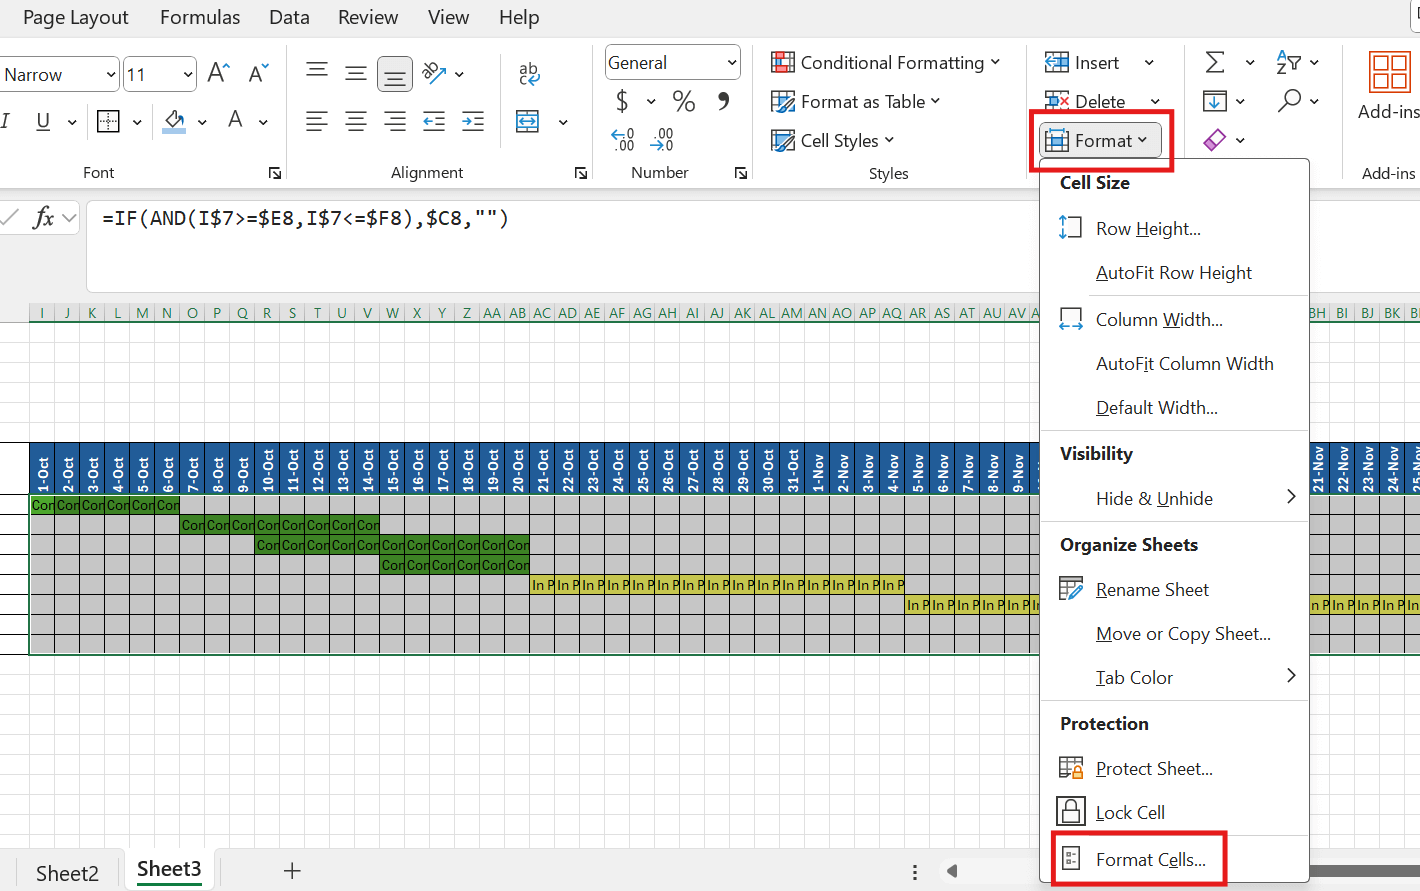
Under Category:, click Custom, and enter ;;; in the Type: field. Click OK.
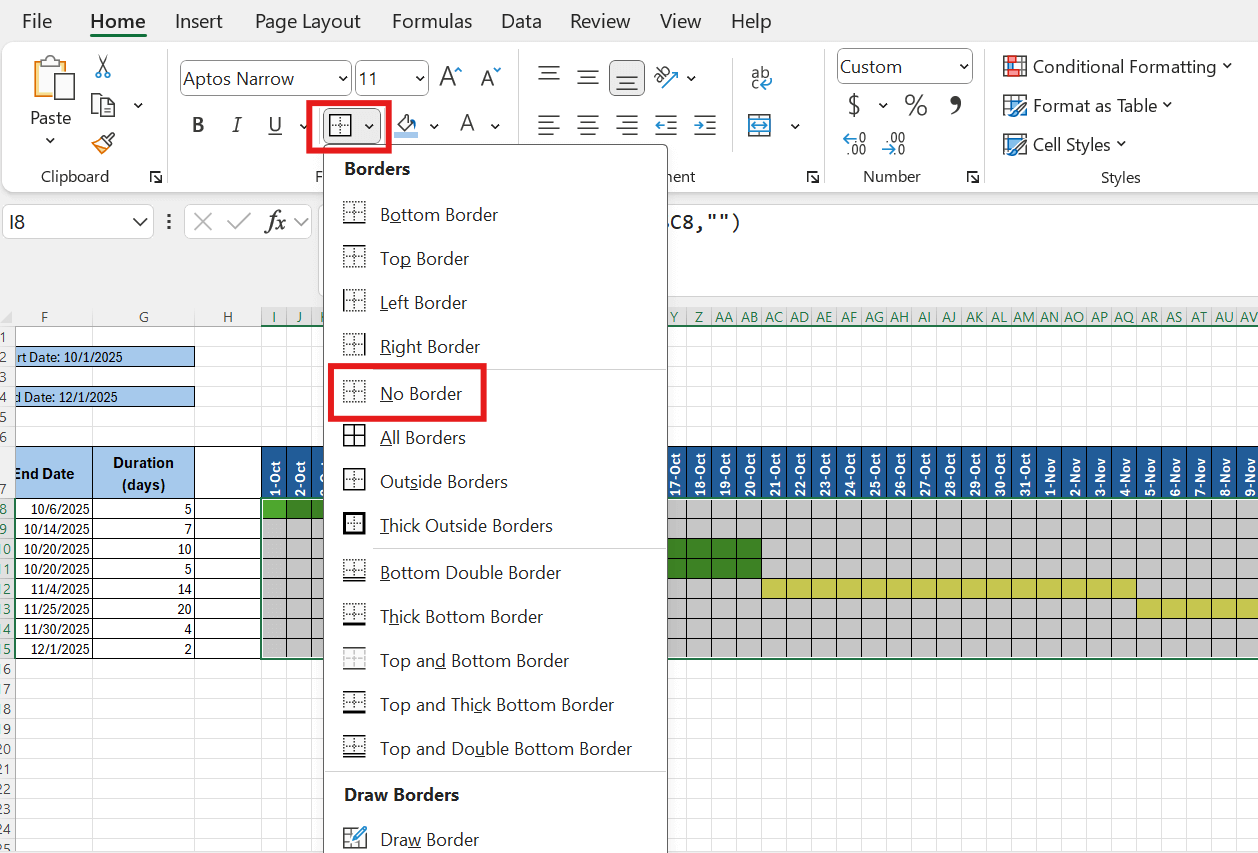
To remove borders, highlight the calendar, click the borders icon, and click No Border.
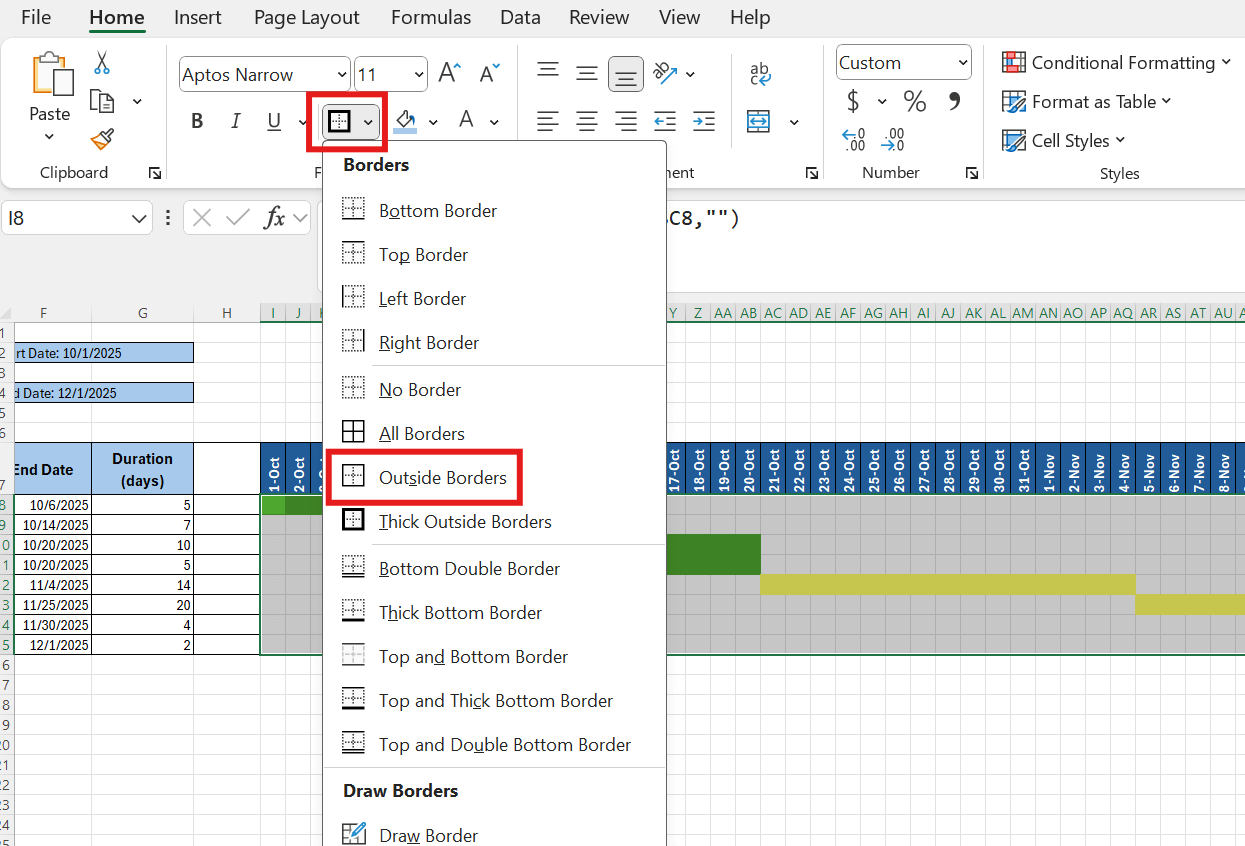
Add an outside border by clicking the borders icon, then Outside Borders.
Tip: Remove gridlines for a cleaner appearance.
- SmartArt is an Excel tool that creates visual diagrams with just a few clicks. Use it alongside your spreadsheet to represent your project schedule as a simple visual. To access SmartArt, click the Insert tab and SmartArt.
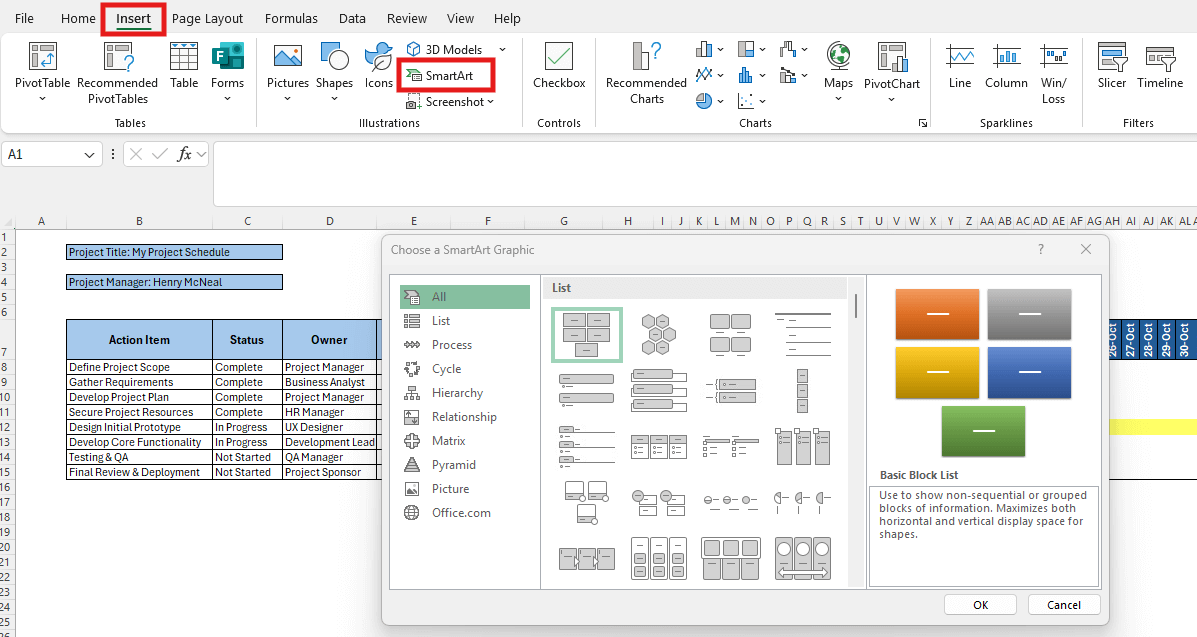
Select a graphic from the options. The example below illustrates Process > Basic Process.
Learn how to create a comprehensive project schedule, including tips from experts.
Do More with a Project Schedule Template Set in Smartsheet
The project schedule template set in Smartsheet consists of a task tracker sheet, a task status report, a report that lists tasks due by assignees, and a dashboard. The templates in this set work together to help you plan, initiate, manage, and launch your project.
Task Tracker Sheet
Start organizing your project elements in the template task tracker sheet. Use the designated columns to add details about what needs to happen in each phase, assign tasks, track progress, determine how long each should take, and identify predecessors.
![]()
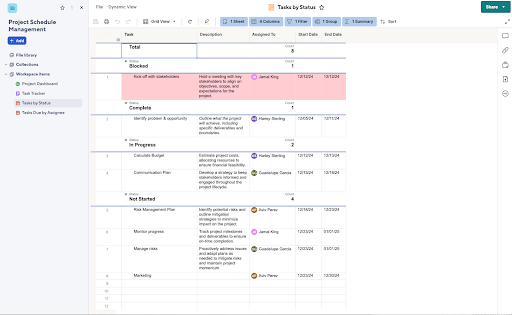
Task by Status Report
Complete the task tracker template to view a pre-populated report showing the status of each task in the project schedule. The report organizes tasks by status: Blocked, Complete, In Progress, and Not Started. You’ll also find task details, who is responsible, and start and due dates.
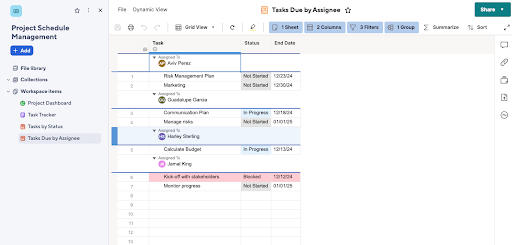
Tasks Due by Assignee Report
This report focuses on displaying information about task owners. Easily see which team members are responsible for which tasks, the status, and the due dates.
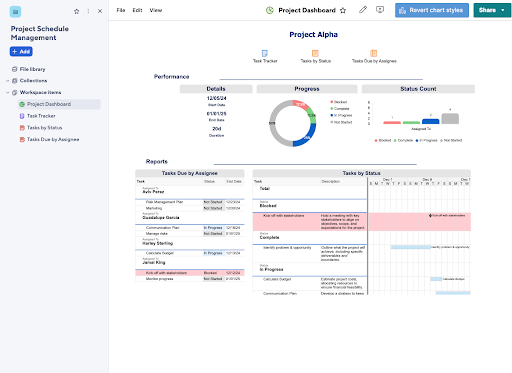
Project Dashboard Template
The project dashboard pulls together all the information in this template set into an at-a-glance performance view that charts progress, status, and key details. You can also embed the other reports in this template set for a complete overview of the project.
Manage your project deadlines and tasks easily with the project schedule management template.
Easily Manage Project Schedules with Smartsheet
From simple task management and project planning to complex resource and portfolio management, Smartsheet helps you improve collaboration and increase work velocity -- empowering you to get more done.
The Smartsheet platform makes it easy to plan, capture, manage, and report on work from anywhere, helping your team be more effective and get more done. Report on key metrics and get real-time visibility into work as it happens with roll-up reports, dashboards, and automated workflows built to keep your team connected and informed.
When teams have clarity into the work getting done, there’s no telling how much more they can accomplish in the same amount of time. Try Smartsheet for free, today.