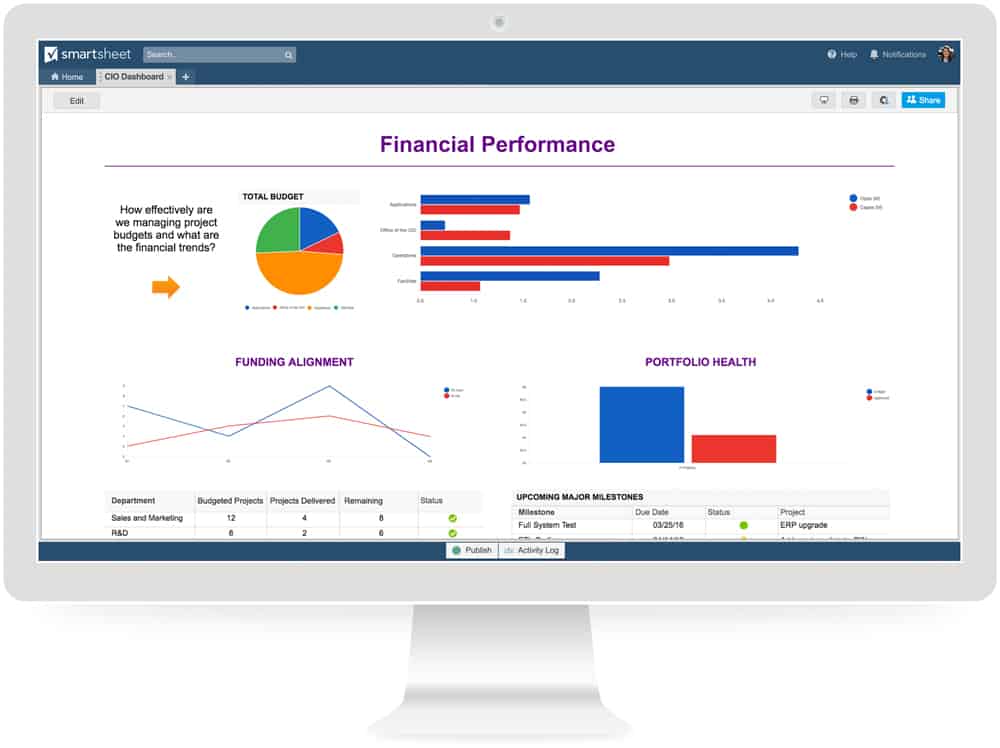
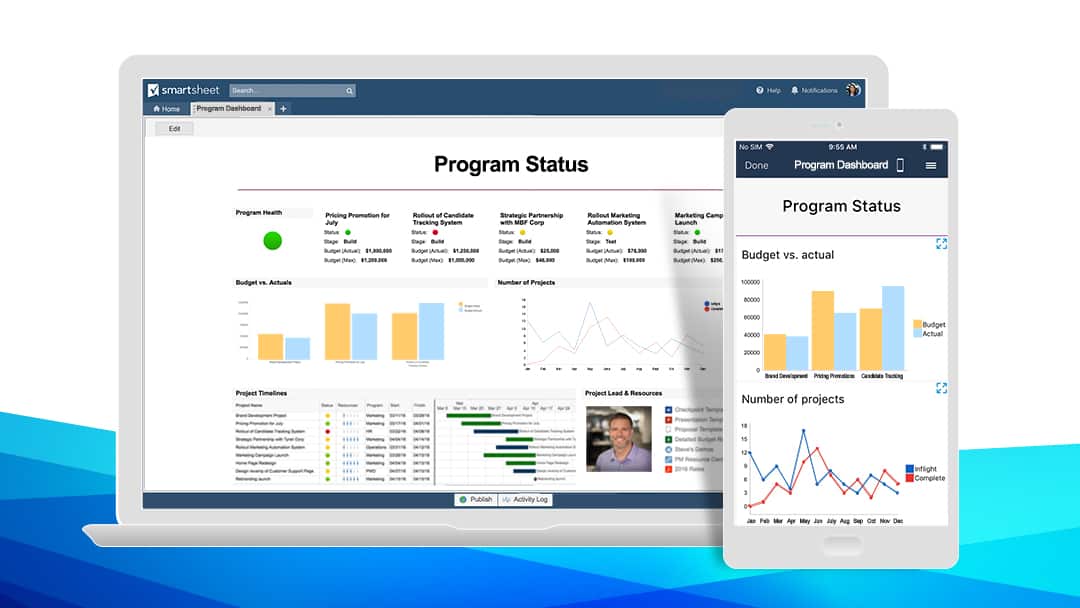
Earlier this month, we revealed Smartsheet dashboards, an unprecedented bird's-eye view into your business's work in Smartsheet. With dashboards, you have a customizable, powerful tool that arms you with real-time data and information for making the best decisions. Let’s look at some best practices for getting started with dashboards so you can improve your work right away.
Preparing Your Information for Dashboards
Before you start building a dashboard, there are three factors you must determine.
- Your purpose: Is this dashboard for a single project, multiple projects, or a general information portal?
- Your audience: Are you building a dashboard for yourself, your team, middle management, or a C-level executive?
- Your data: What data and information will be most useful for your audience?
Dashboards are powerful tools for visualizing work across your business, but they can only pull from data that already exists in your sheets and reports. Make sure they are populated with accurate information you’d like rolled up to your dashboard. Everything in your dashboard is gathered from one of the following information sources:
- Data in a sheet: Quickly consolidate totals and averages from data in your sheets. For any piece of data that you want to include in a dashboard, you’ll need to first build the calculation to figure it in the sheet itself.
- Reports: You are able to pull a full Smartsheet report into a dashboard. Building a report allows you to display a certain set of rows and/or a specific set of columns, consolidating information across multiple sheets into a single view.
- Links: It can be extremely efficient to use portals as information hubs to link all relevant documents on a topic. Links can direct to important Smartsheet sheets, external web pages, files, and more.
Determine which of these types of data you already have, and which you still need to create. Once you know what you’d like your dashboard or portal to contain, it’s time to start building.
Remember: You cannot do any calculations on a dashboard itself. Calculations must be completed in your sheets using hierarchy functions or summary sections with formulas at the sheet level. Next, configure your reports. Reports pull in data from your sheets, and dashboards pull from your reports, so ensure you’re only gathering the data you want to show.
Building Your Dashboard or Portal
Once you’ve made your preparations, it’s time to start building your dashboard or portal. Create a dashboard just like you would a sheet or report.
- Click Create New, or right-click in a folder or workspace and select Dashboard/Portal from the drop-down menu.
- Determine which types of widgets you’ll need. We recommend using several different widget types in your dashboard to surface all the data you need in a cohesive layout.
- When you’re finished planning, start building out your widgets. It’s important to not be too concerned with how they’re organized yet. Make sure they’re properly linking to the data you want before you do anything else.
- After your widgets are built and your dashboard is populated, it’s time to organize. Move, resize, and edit your widgets as needed. Remember, your dashboards can be about six widgets wide, but infinitely long.
Quick tips:
- Don’t worry about making your dashboard “pretty” when you first start. Get your data connected to your widgets first, then focus on formatting.
- The power of dashboards are in their visual, at-a-glance nature. Let the surfaced data speak for itself without trying to reinvent the wheel.
- Use Rich Text widgets as placeholders to test out sizing and organization.
- Sketch plans out on paper before you get started.
- Take screenshots of your dashboard layout before you make changes. If you don’t like your new layout, you have a record of the previous one.
Sharing Your Dashboard With Stakeholders
Once your dashboard is built and surfacing all the data you need, it’s time to share it. To share a dashboard, use the sharing tab at the bottom of a completed page. The power of dashboards are in their flexibility, even after they're built. More than one person can work on a dashboard at any one time. That’s helpful for project managers and their teams building a dashboard collectively.
There are two levels of sharing on dashboards: Admins and Viewers. Anyone who is an admin can add, remove, and edit widgets and the dashboard layout. Viewers can view all content on a dashboard, but cannot edit or share with anyone else. However, unlike reports, viewers do not require access to the underlying sheets to view their information in dashboards, ensuring an easy way to highlight critical data from both sheets and reports to your audience without showing them everything under the hood.
If you and your team find a dashboard layout that works well for you, you can create a template from it for use elsewhere. Copy a dashboard by selecting Save as New to create a new template that you or your coworkers and clients can reuse. Of course, you can edit all of the widgets to pull from new reports and sheets. Dashboard links will automatically update when someone duplicates a workspace.
Quick tips:
- Have employees get used to adding header rows to their sheets if they plan on rolling up the information under them.
- Take time to provide report training to employees working on the sheets your dashboards will be pulling from.
- You can drag a dashboard between folders and workspaces to share with a group of people.
With these best practices, we hope you’ll find dashboards to be as versatile and useful a tool as we do. If you're on a Team or Individual plan and interested in upgrading your plan, contact our team today.
Editor's note: This post has been updated and re-published to reflect recent product changes. We hope you find it helpful.


