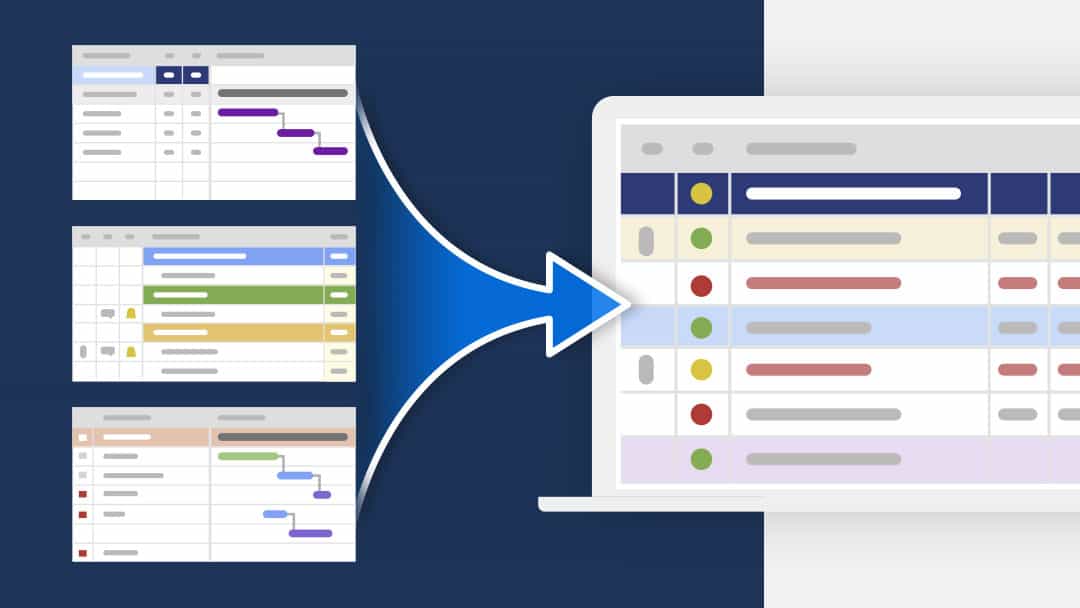
Ensuring that real-time information is accessible and actionable to teams and stakeholders can be challenging. One survey found that information workers spend 36 percent of their day looking for and consolidating information, and 44 percent of the time they still can’t find the information they need. Centralized information is essential for ensuring that work can move forward quickly and effectively.
Smartsheet dashboards and portals are powerful tools that surface relevant information and data in real-time, so teams and leaders can make better decisions, faster. And now — with our new web content widget — your dashboards and portals can have even more impact.
Eliminate search time, maximize impact
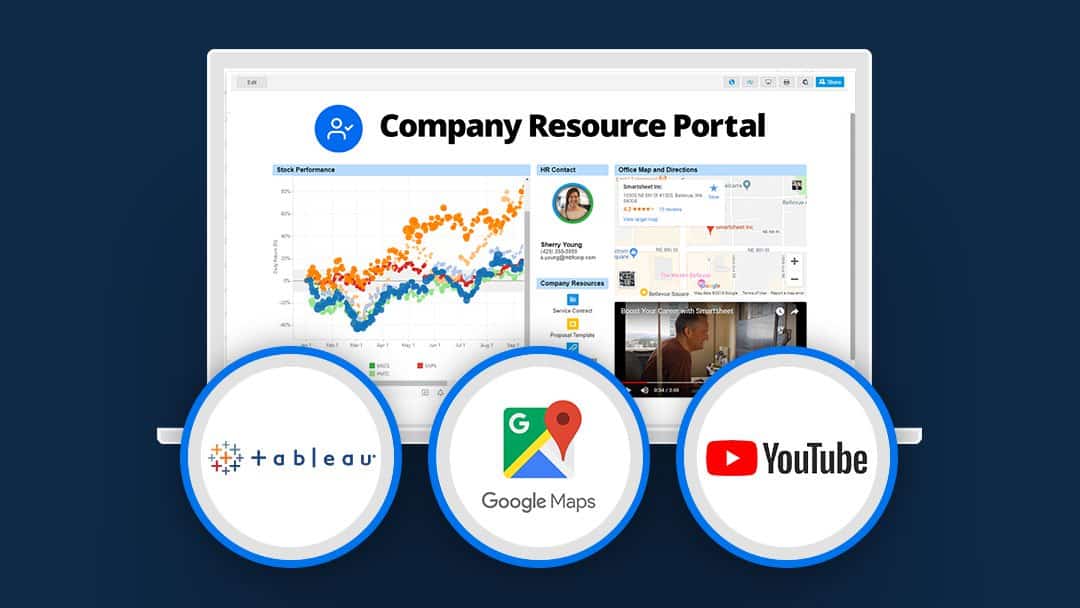
Whether it’s a centralized information hub, an executive dashboard, or just a resource for your team or customers, the new web content widget gives you the ability to embed, view, and interact with content from some of the most popular online applications including Google, Microsoft, Tableau, YouTube, and other sources, directly in a dashboard or portal.
You can also embed Smartsheet forms and published sheets, so Smartsheet content and external content can be surfaced in one place— empowering you and your team to more easily access the information you need to keep everyone on the same page and move your ideas to impact, fast.
There are a number of content sources that you can now add to your dashboards and portals with the web content widget:
Show videos: You can embed videos from YouTube and Vimeo to surface visual information such as how-to videos and directional content on your portals.
Display reports and charts from Tableau and Power BI: Reports and charts from Tableau and Power BI enhance the way you present data visualization across your dashboards and provide you with the ability to slice and dice your data as needed.
Surface Google and Microsoft files: Easily view the information that matters to you and your teams like documents, presentations, and spreadsheets in Google Workspace and Microsoft 365.
Embed interactive Google Maps: Help your team know where they need to go and easily navigate to points of interest.
Add published sheets: Add Smartsheet published sheets in grid view, Gantt view, card view, or calendar view.
Embed Smartsheet forms: Quickly and easily collect feedback or requests by embedding forms in your dashboard or portal.
Our customers are already excited about the new ways their teams will be able to engage with the web content widget across dashboards and portals:
"The best way to reach our employees is to provide content that is enticing and visually stimulating. Embedding videos directly on our dashboards will allow us to connect with our audience through media without them navigating away from our page. We can provide quick explanations of the different charts, what they are looking at, how to interpret data, etc... This is going to be a game-changer with how our team interacts with our dashboards. Very exciting stuff indeed."
Christine Wickland
Learning Business Partner, Nordstrom
Check out our example dashboard on desktop to see all of the content sources in action, and review the full list of available sources in our help article.
Create more powerful resources
With so many content sources, both external and within Smartsheet, available for the web content widget there are many new ways to think about setting up your dashboards and portals. To help you understand what’s possible and give you some ideas on how to get started, check out a few of our example dashboards and portals below:
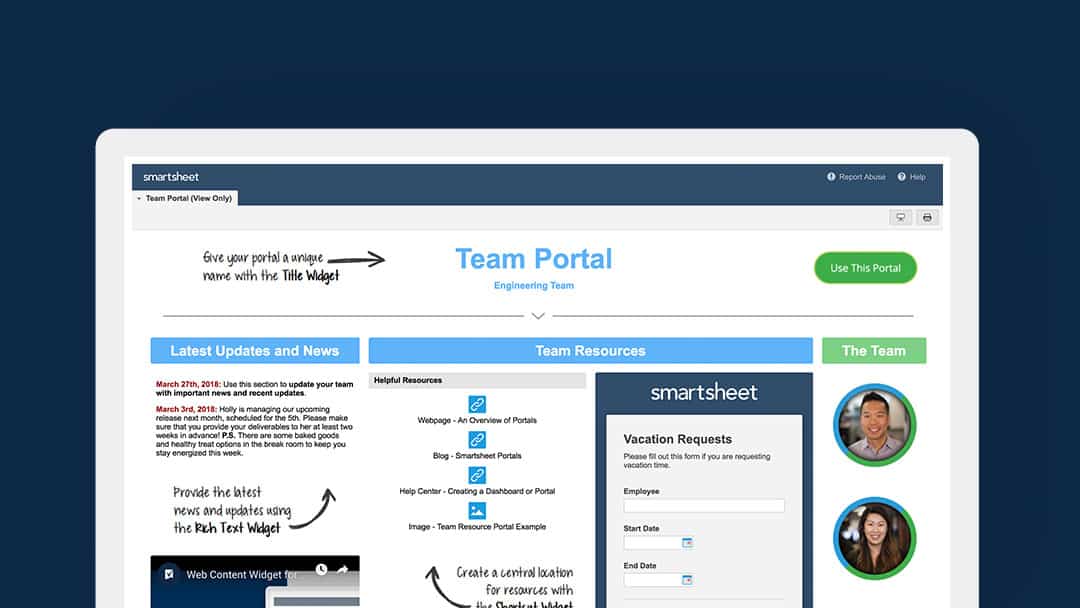
Team portal
The team portal template features rich text, shortcuts, images, and some new content sources from the web content widget: YouTube videos and Smartsheet forms. This portal is a great way to ensure your team is on the same page and has a central location for information, requests, and resources.
Try out our team portal template.
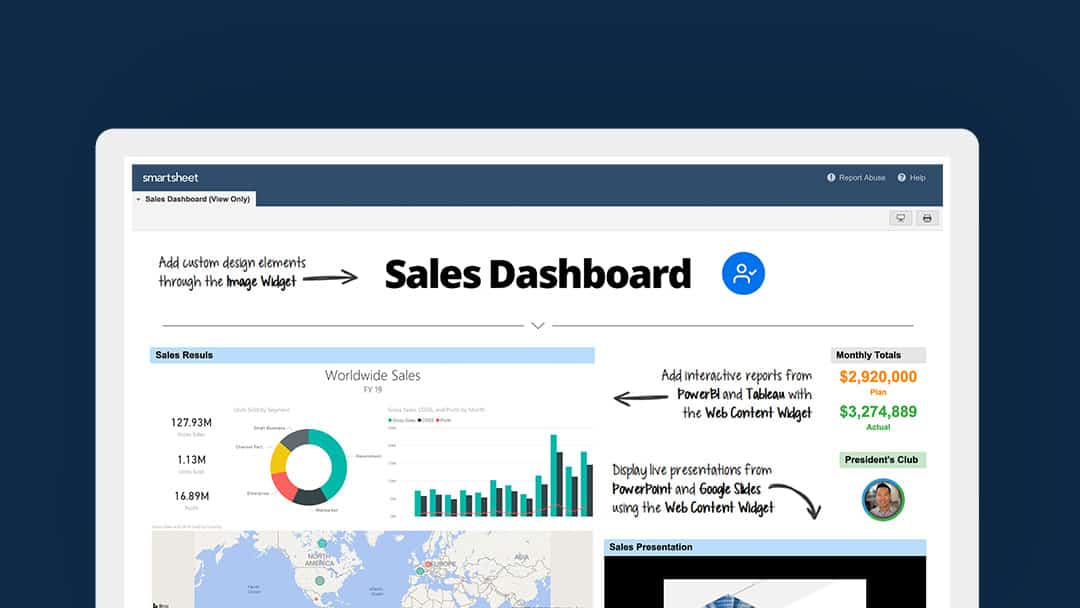
Sales dashboard
The sales dashboard example features metrics, shortcuts, and images, and some new content sources from the web content widget: an interactive PowerBI report and a live slide deck in Microsoft PowerPoint. This example highlights some ways that you could add external reports and presentations to your dashboard, and make them easily accessible for your team.
Check out the sales dashboard example.
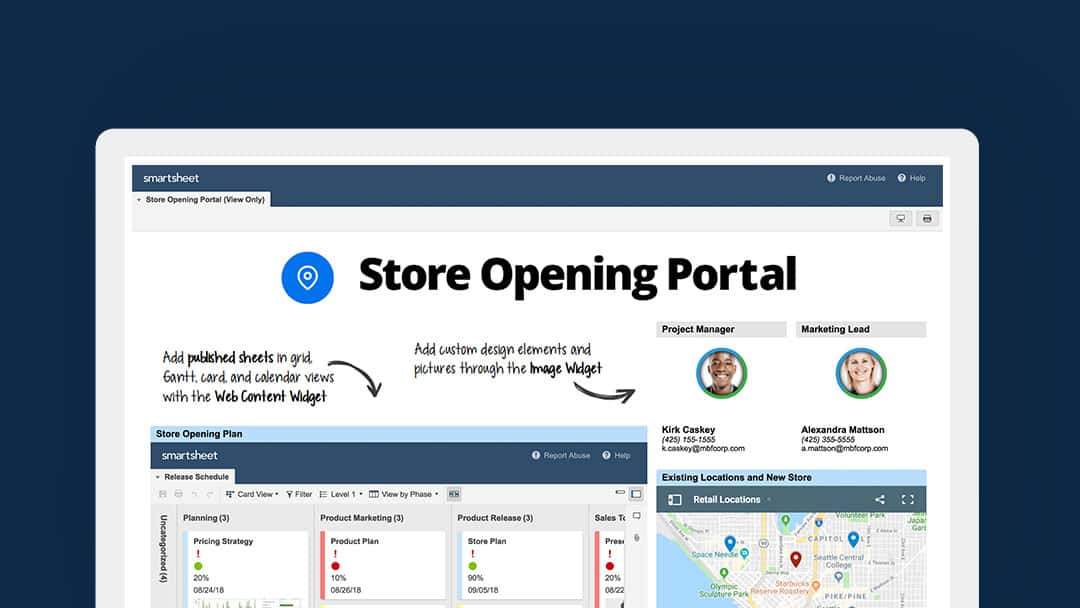
Store opening portal
This sample store opening portal features rich text, shortcuts, images, and some new content sources from the web content widget: a published sheet in card view, a map from Google maps, and a document from Google Docs. This example demonstrates the power of interactive maps, and the ability to create true end-to-end portals for projects like store openings.
View the store opening portal.
Don’t have dashboards or portals? They are available with a Business plan or higher. You can request more information on dashboards and portals. Or to learn more about the web content widget, watch the video below.

