Article
New Charts Experience: Build dashboard charts without the data-prep step, now available!
September 3, 2026
The new charting experience supports 3 ways to build charts:
- Build with AI - Create a chart using a prompt from a sheet
- Build manually - Create a chart from a sheet or report by leveraging our new in-built aggregation functions
- Build legacy charts - If you still prefer to create your own metrics sheet or prepare data ahead
The primary goal with the new charting experience is to empower users to source their data directly from a primary sheet or report without building an intermediate helper/metric sheet. Select a data source, see a default chart appear, then refine it from there — previewing your changes as you go. The most time-consuming step, manually preparing your data, is gone.
Aggregate directly in the chart with Count, Sum, Average, Min, Max, or Median
Choose bar, column, line, pie, donut, or stacked and grouped output
Preview your chart live as you adjust the configuration. Existing charts remain in Legacy mode and continue to work as they do today.
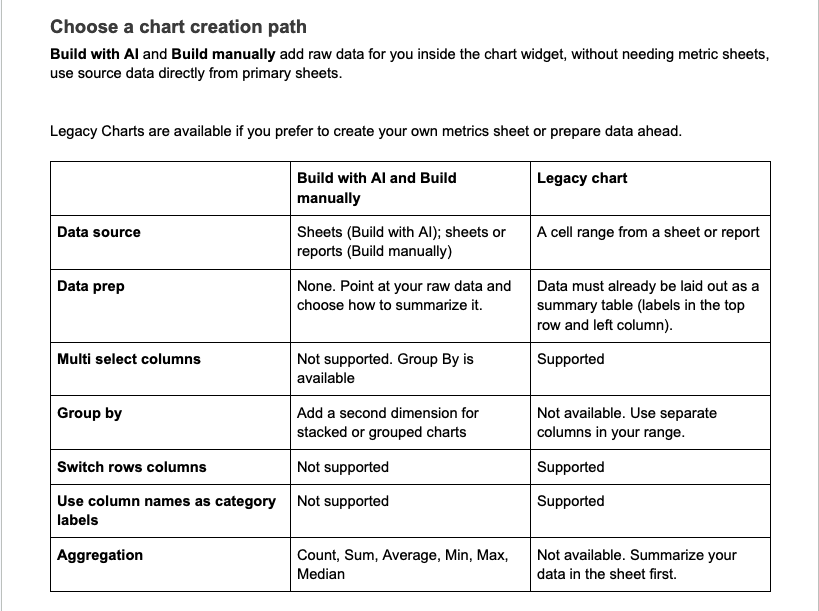
Learn more here: Use Chart Widgets
Environment Availability: Commercial US, Commercial EU, Commercial AU
Plan Availability: Pro, Business, Enterprise
Subscription Model Availability: Legacy Collaborator Model and User Subscription Model (USM)